Aug 20, 2021 | Volume 11 - Issue 3
Warren N. Ponder, Elizabeth A. Prosek, Tempa Sherrill
First responders are continually exposed to trauma-related events. Resilience is evidenced as a protective factor for mental health among first responders. However, there is a lack of assessments that measure the construct of resilience from a strength-based perspective. The present study used archival data from a treatment-seeking sample of 238 first responders to validate the 22-item Response to Stressful Experiences Scale (RSES-22) and its abbreviated version, the RSES-4, with two confirmatory factor analyses. Using a subsample of 190 first responders, correlational analyses were conducted of the RSES-22 and RSES-4 with measures of depressive symptoms, post-traumatic stress, anxiety, and suicidality confirming convergent and criterion validity. The two confirmatory analyses revealed a poor model fit for the RSES-22; however, the RSES-4 demonstrated an acceptable model fit. Overall, the RSES-4 may be a reliable and valid measure of resilience for treatment-seeking first responder populations.
Keywords: first responders, resilience, assessment, mental health, confirmatory factor analysis
First responder populations (i.e., law enforcement, emergency medical technicians, and fire rescue) are often repeatedly exposed to traumatic and life-threatening conditions (Greinacher et al., 2019). Researchers have concluded that such critical incidents could have a deleterious impact on first responders’ mental health, including the development of symptoms associated with post-traumatic stress, anxiety, depression, or other diagnosable mental health disorders (Donnelly & Bennett, 2014; Jetelina et al., 2020; Klimley et al., 2018; Weiss et al., 2010). In a systematic review, Wild et al. (2020) suggested the promise of resilience-based interventions to relieve trauma-related psychological disorders among first responders. However, they noted the operationalization and measure of resilience as limitations to their intervention research. Indeed, researchers have conflicting viewpoints on how to define and assess resilience. For example, White et al. (2010) purported popular measures of resilience rely on a deficit-based approach. Counselors operate from a strength-based lens (American Counseling Association [ACA], 2014) and may prefer measures with a similar perspective. Additionally, counselors are mandated to administer assessments with acceptable psychometric properties that are normed on populations representative of the client (ACA, 2014, E.6.a., E.7.d.). For counselors working with first responder populations, resilience may be a factor of importance; however, appropriately measuring the construct warrants exploration. Therefore, the focus of this study was to validate a measure of resilience with strength-based principles among a sample of first responders.
Risk and Resilience Among First Responders
In a systematic review of the literature, Greinacher et al. (2019) described the incidents that first responders may experience as traumatic, including first-hand life-threatening events; secondary exposure and interaction with survivors of trauma; and frequent exposure to death, dead bodies, and injury. Law enforcement officers (LEOs) reported that the most severe critical incidents they encounter are making a mistake that injures or kills a colleague; having a colleague intentionally killed; and making a mistake that injures or kills a bystander (Weiss et al., 2010). Among emergency medical technicians (EMTs), critical incidents that evoked the most self-reported stress included responding to a scene involving family, friends, or others to the crew and seeing someone dying (Donnelly & Bennett, 2014). Exposure to these critical incidents may have consequences for first responders. For example, researchers concluded first responders may experience mental health symptoms as a result of the stress-related, repeated exposure (Jetelina et al., 2020; Klimley et al., 2018; Weiss et al., 2010). Moreover, considering the cumulative nature of exposure (Donnelly & Bennett, 2014), researchers concluded first responders are at increased risk for post-traumatic stress disorder (PTSD), depression, and generalized anxiety symptoms (Jetelina et al., 2020; Klimley et al., 2018; Weiss et al., 2010). Symptoms commonly experienced among first responders include those associated with post-traumatic stress, anxiety, and depression.
In a collective review of first responders, Kleim and Westphal (2011) determined a prevalence rate for PTSD of 8%–32%, which is higher than the general population lifetime rate of 6.8–7.8 % (American Psychiatric Association [APA], 2013; National Institute of Mental Health [NIMH], 2017). Some researchers have explored rates of PTSD by specific first responder population. For example, Klimley et al. (2018) concluded that 7%–19% of LEOs and 17%–22% of firefighters experience PTSD. Similarly, in a sample of LEOs, Jetelina and colleagues (2020) reported 20% of their participants met criteria for PTSD.
Generalized anxiety and depression are also prevalent mental health symptoms for first responders. Among a sample of firefighters and EMTs, 28% disclosed anxiety at moderate–severe and several levels (Jones et al., 2018). Furthermore, 17% of patrol LEOs reported an overall prevalence of generalized anxiety disorder (Jetelina et al., 2020). Additionally, first responders may be at higher risk for depression (Klimley et al., 2018), with estimated prevalence rates of 16%–26% (Kleim & Westphal, 2011). Comparatively, the past 12-month rate of major depressive disorder among the general population is 7% (APA, 2013). In a recent study, 16% of LEOs met criteria for major depressive disorder (Jetelina et al., 2020). Moreover, in a sample of firefighters and EMTs, 14% reported moderate–severe and severe depressive symptoms (Jones et al., 2018). Given these higher rates of distressful mental health symptoms, including post-traumatic stress, generalized anxiety, and depression, protective factors to reduce negative impacts are warranted.
Resilience
Broadly defined, resilience is “the ability to adopt to and rebound from change (whether it is from stress or adversity) in a healthy, positive and growth-oriented manner” (Burnett, 2017, p. 2). White and colleagues (2010) promoted a positive psychology approach to researching resilience, relying on strength-based characteristics of individuals who adapt after a stressor event. Similarly, other researchers explored how individuals’ cognitive flexibility, meaning-making, and restoration offer protection that may be collectively defined as resilience (Johnson et al., 2011).
A key element among definitions of resilience is one’s exposure to stress. Given their exposure to trauma-related incidents, first responders require the ability to cope or adapt in stressful situations (Greinacher et al., 2019). Some researchers have defined resilience as a strength-based response to stressful events (Burnett, 2017), in which healthy coping behaviors and cognitions allow individuals to overcome adverse experiences (Johnson et al., 2011; White et al., 2010). When surveyed about positive coping strategies, first responders most frequently reported resilience as important to their well-being (Crowe et al., 2017).
Researchers corroborated the potential impact of resilience for the population. For example, in samples of LEOs, researchers confirmed resilience served as a protective factor for PTSD (Klimley et al., 2018) and as a mediator between social support and PTSD symptoms (McCanlies et al., 2017). In a sample of firefighters, individual resilience mediated the indirect path between traumatic events and global perceived stress of PTSD, along with the direct path between traumatic events and PTSD symptoms (Lee et al., 2014). Their model demonstrated that those with higher levels of resilience were more protected from traumatic stress. Similarly, among emergency dispatchers, resilience was positively correlated with positive affect and post-traumatic growth, and negatively correlated with job stress (Steinkopf et al., 2018). The replete associations of resilience as a protective factor led researchers to develop resilience-based interventions. For example, researchers surmised promising results from mindfulness-based resilience interventions for firefighters (Joyce et al., 2019) and LEOs (Christopher et al., 2018). Moreover, Antony and colleagues (2020) concluded that resilience training programs demonstrated potential to reduce occupational stress among first responders.
Assessment of Resilience
Recognizing the significance of resilience as a mediating factor in PTSD among first responders and as a promising basis for interventions when working with LEOs, a reliable means to measure it among first responder clients is warranted. In a methodological review of resilience assessments, Windle and colleagues (2011) identified 19 different measures of resilience. They found 15 assessments were from original development and validation studies with four subsequent validation manuscripts from their original assessment, of which none were developed with military or first responder samples.
Subsequently, Johnson et al. (2011) developed the Response to Stressful Experiences Scale (RSES-22) to assess resilience among military populations. Unlike deficit-based assessments of resilience, they proposed a multidimensional construct representing how individuals respond to stressful experiences in adaptive or healthy ways. Cognitive flexibility, meaning-making, and restoration were identified as key elements when assessing for individuals’ characteristics connected to resilience when overcoming hardships. Initially they validated a five-factor structure for the RSES-22 with military active-duty and reserve components. Later, De La Rosa et al. (2016) re-examined the RSES-22. De La Rosa and colleagues discovered a unidimensional factor structure of the RSES-22 and validated a shorter 4-item subset of the instrument, the RSES-4, again among military populations.
It is currently unknown if the performance of the RSES-4 can be generalized to first responder populations. While there are some overlapping experiences between military populations and first responders in terms of exposure to trauma and high-risk occupations, the Substance Abuse and Mental Health Services Administration (SAMHSA; 2018) suggested differences in training and types of risk. In the counseling profession, these populations are categorized together, as evidenced by the Military and Government Counseling Association ACA division. Additionally, there may also be dual identities within the populations. For example, Lewis and Pathak (2014) found that 22% of LEOs and 15% of firefighters identified as veterans. Although the similarities of the populations may be enough to theorize the use of the same resilience measure, validation of the RSES-22 and RSES-4 among first responders remains unexamined.
Purpose of the Study
First responders are repeatedly exposed to traumatic and stressful events (Greinacher et al., 2019) and this exposure may impact their mental health, including symptoms of post-traumatic stress, anxiety, depression, and suicidality (Jetelina et al., 2020; Klimley et al., 2018). Though most measures of resilience are grounded in a deficit-based approach, researchers using a strength-based approach proposed resilience may be a protective factor for this population (Crowe et al., 2017; Wild et al., 2020). Consequently, counselors need a means to assess resilience in their clinical practice from a strength-based conceptualization of clients.
Johnson et al. (2011) offered a non-deficit approach to measuring resilience in response to stressful events associated with military service. Thus far, researchers have conducted analyses of the RSES-22 and RSES-4 with military populations (De La Rosa et al., 2016; Johnson et al., 2011; Prosek & Ponder, 2021), but not yet with first responders. While there are some overlapping characteristics between the populations, there are also unique differences that warrant research with discrete sampling (SAMHSA, 2018). In light of the importance of resilience as a protective factor for mental health among first responders, the purpose of the current study was to confirm the reliability and validity of the RSES-22 and RSES-4 when utilized with this population. In the current study, we hypothesized the measures would perform similarly among first responders and if so, the RSES-4 would offer counselors a brief assessment option in clinical practice that is both reliable and valid.
Method
Participants
Participants in the current non-probability, purposive sample study were first responders (N = 238) seeking clinical treatment at an outpatient, mental health nonprofit organization in the Southwestern United States. Participants’ mean age was 37.53 years (SD = 10.66). The majority of participants identified as men (75.2%; n = 179), with women representing 24.8% (n = 59) of the sample. In terms of race and ethnicity, participants identified as White (78.6%; n = 187), Latino/a (11.8%; n = 28), African American or Black (5.5%; n = 13), Native American (1.7%; n = 4), Asian American (1.3%; n = 3), and multiple ethnicities (1.3%; n = 3). The participants identified as first responders in three main categories: LEO (34.9%; n = 83), EMT (28.2%; n = 67), and fire rescue (25.2%; n = 60). Among the first responders, 26.9% reported previous military affiliation. As part of the secondary analysis, we utilized a subsample (n = 190) that was reflective of the larger sample (see Table 1).
Procedure
The data for this study were collected between 2015–2020 as part of the routine clinical assessment procedures at a nonprofit organization serving military service members, first responders, frontline health care workers, and their families. The agency representatives conduct clinical assessments with clients at intake, Session 6, Session 12, and Session 18 or when clinical services are concluded. We consulted with the second author’s Institutional Review Board, which determined the research as exempt, given the de-identified, archival nature of the data. For inclusion in this analysis, data needed to represent first responders, ages 18 or older, with a completed RSES-22 at intake. The RSES-4 are four questions within the RSES-22 measure; therefore, the participants did not have to complete an additional measure. For the secondary analysis, data from participants who also completed other mental health measures at intake were also included (see Measures).
Table 1
Demographics of Sample
| Characteristic |
Sample 1
(N = 238) |
Sample 2
(n = 190) |
| Age (Years) |
|
|
| Mean |
37.53 |
37.12 |
| Median |
35.50 |
35.00 |
| SD |
10.66 |
10.30 |
| Range |
46 |
45 |
| Time in Service (Years) |
|
|
| Mean |
11.62 |
11.65 |
| Median |
10.00 |
10.00 |
| SD |
9.33 |
9.37 |
| Range |
41 |
39 |
|
n (%) |
| First Responder Type |
|
|
Emergency Medical
Technicians |
67 (28.2%) |
54 (28.4%) |
| Fire Rescue |
60 (25.2%) |
45 (23.7%) |
| Law Enforcement |
83 (34.9%) |
72 (37.9%) |
| Other |
9 (3.8%) |
5 (2.6%) |
| Two or more |
10 (4.2%) |
6 (3.2%) |
| Not reported |
9 (3.8%) |
8 (4.2%) |
| Gender |
|
|
| Women |
59 (24.8%) |
47 (24.7%) |
| Men |
179 (75.2%) |
143 (75.3%) |
| Ethnicity |
|
|
| African American/Black |
13 (5.5%) |
8 (4.2%) |
| Asian American |
3 (1.3%) |
3 (1.6%) |
| Latino(a)/Hispanic |
28 (11.8%) |
24 (12.6%) |
| Multiple Ethnicities |
3 (1.3%) |
3 (1.6%) |
| Native American |
4 (1.7%) |
3 (1.6%) |
| White |
187 (78.6%) |
149 (78.4%) |
Note. Sample 2 is a subset of Sample 1. Time in service for Sample 1, n = 225;
time in service for Sample 2, n = 190.
Measures
Response to Stressful Experiences Scale
The Response to Stressful Experiences Scale (RSES-22) is a 22-item measure to assess dimensions of resilience, including meaning-making, active coping, cognitive flexibility, spirituality, and self-efficacy (Johnson et al., 2011). Participants respond to the prompt “During and after life’s most stressful events, I tend to” on a 5-point Likert scale from 0 (not at all like me) to 4 (exactly like me). Total scores range from 0 to 88 in which higher scores represent greater resilience. Example items include see it as a challenge that will make me better, pray or meditate, and find strength in the meaning, purpose, or mission of my life. Johnson et al. (2011) reported the RSES-22 demonstrates good internal consistency (α = .92) and test-retest reliability (α = .87) among samples from military populations. Further, the developers confirmed convergent, discriminant, concurrent, and incremental criterion validity (see Johnson et al., 2011). In the current study, Cronbach’s alpha of the total score was .93.
Adapted Response to Stressful Experiences Scale
The adapted Response to Stressful Experiences Scale (RSES-4) is a 4-item measure to assess resilience as a unidimensional construct (De La Rosa et al., 2016). The prompt and Likert scale are consistent with the original RSES-22; however, it only includes four items: find a way to do what’s necessary to carry on, know I will bounce back, learn important and useful life lessons, and practice ways to handle it better next time. Total scores range from 0 to 16, with higher scores indicating greater resilience. De La Rosa et al. (2016) reported acceptable internal consistency (α = .76–.78), test-retest reliability, and demonstrated criterion validity among multiple military samples. In the current study, the Cronbach’s alpha of the total score was .74.
Patient Health Questionnaire-9
The Patient Health Questionnaire-9 (PHQ-9) is a 9-item measure to assess depressive symptoms in the past 2 weeks (Kroenke et al., 2001). Respondents rate the frequency of their symptoms on a 4-point Likert scale ranging from 0 (not at all) to 3 (nearly every day). Total scores range from 0 to 27, in which higher scores indicate increased severity of depressive symptoms. Example items include little interest or pleasure in doing things and feeling tired or having little energy. Kroenke et al. (2001) reported good internal consistency (α = .89) and established criterion and construct validity. In this sample, Cronbach’s alpha of the total score was .88.
PTSD Checklist-5
The PTSD Checklist-5 (PCL-5) is a 20-item measure for the presence of PTSD symptoms in the past month (Blevins et al., 2015). Participants respond on a 5-point Likert scale indicating frequency of PTSD-related symptoms from 0 (not at all) to 4 (extremely). Total scores range from 0 to 80, in which higher scores indicate more severity of PTSD-related symptoms. Example items include repeated, disturbing dreams of the stressful experience and trouble remembering important parts of the stressful experience. Blevins et al. (2015) reported good internal consistency (α = .94) and determined convergent and discriminant validity. In this sample, Cronbach’s alpha of the total score was .93.
Generalized Anxiety Disorder-7
The Generalized Anxiety Disorder-7 (GAD-7) is a 7-item measure to assess for anxiety symptoms over the past 2 weeks (Spitzer et al., 2006). Participants rate the frequency of the symptoms on a 4-point Likert scale ranging from 0 (not at all) to 3 (nearly every day). Total scores range from 0 to 21 with higher scores indicating greater severity of anxiety symptoms. Example items include not being able to stop or control worrying and becoming easily annoyed or irritable. Among patients from primary care settings, Spitzer et al. (2006) determined good internal consistency (α = .92) and established criterion, construct, and factorial validity. In this sample, Cronbach’s alpha of the total score was .91.
Suicidal Behaviors Questionnaire-Revised
The Suicidal Behaviors Questionnaire-Revised (SBQ-R) is a 4-item measure to assess suicidality (Osman et al., 2001). Each item assesses a different dimension of suicidality: lifetime ideation and attempts, frequency of ideation in the past 12 months, threat of suicidal behaviors, and likelihood of suicidal behaviors (Gutierrez et al., 2001). Total scores range from 3 to 18, with higher scores indicating more risk of suicide. Example items include How often have you thought about killing yourself in the past year? and How likely is it that you will attempt suicide someday? In a clinical sample, Osman et al. (2001) reported good internal consistency (α = .87) and established criterion validity. In this sample, Cronbach’s alpha of the total score was .85.
Data Analysis
Statistical analyses were conducted using SPSS version 26.0 and SPSS Analysis of Moment Structures (AMOS) version 26.0. We examined the dataset for missing values, replacing 0.25% (32 of 12,836 values) of data with series means. We reviewed descriptive statistics of the RSES-22 and RSES-4 scales. We determined multivariate normality as evidenced by skewness less than 2.0 and kurtosis less than 7.0 (Dimitrov, 2012). We assessed reliability for the scales by interpreting Cronbach’s alphas and inter-item correlations to confirm internal consistency.
We conducted two separate confirmatory factor analyses to determine the model fit and factorial validity of the 22-item measure and adapted 4-item measure. We used several indices to conclude model fit: minimum discrepancy per degree of freedom (CMIN/DF) and p-values, root mean residual (RMR), goodness-of-fit index (GFI), comparative fit index (CFI), Tucker-Lewis index (TLI), and the root mean square error of approximation (RMSEA). According to Dimitrov (2012), values for the CMIN/DF < 2.0,p > .05, RMR < .08, GFI > .90, CFI > .90, TLI > .90, and RMSEA < .10 provide evidence of a strong model fit. To determine criterion validity, we assessed a subsample of participants (n = 190) who had completed the RSES-22, RSES-4, and four other psychological measures (i.e., PHQ-9, PCL-5, GAD-7, and SBQ-R). We determined convergent validity by conducting bivariate correlations between the RSES-22 and RSES-4.
Results
Descriptive Analyses
We computed means, standard deviations, 95% confidence interval (CI), and score ranges for the RSES-22 and RSES-4 (Table 2). Scores on the RSES-22 ranged from 19–88. Scores on the RSES-4 ranged from 3–16. Previous researchers using the RSES-22 on military samples reported mean scores of 57.64–70.74 with standard deviations between 8.15–15.42 (Johnson et al., 2011; Prosek & Ponder, 2021). In previous research of the RSES-4 with military samples, mean scores were 9.95–11.20 with standard deviations between 3.02–3.53(De La Rosa et al., 2016; Prosek & Ponder, 2021).
Table 2
Descriptive Statistics for RSES-22 and RSES-4
| Variable |
M |
SD |
95% CI |
Score Range |
| RSES-22 scores |
60.12 |
13.76 |
58.52, 61.86 |
19–88 |
| RSES-4 scores |
11.66 |
2.62 |
11.33, 11.99 |
3–16 |
Note. N = 238. RSES-22 = Response to Stressful Experiences Scale 22-item; RSES-4 = Response
to Stressful Experiences Scale 4-item adaptation.
Reliability Analyses
To determine the internal consistency of the resiliency measures, we computed Cronbach’s alphas. For the RSES-22, we found strong evidence of inter-item reliability (α = .93), which was consistent with the developers’ estimates (α = .93; Johnson et al., 2011). For the RSES-4, we assessed acceptable inter-item reliability (α = .74), which was slightly lower than previous estimates (α = .76–.78; De La Rosa et al., 2016). We calculated the correlation between items and computed the average of all the coefficients. The average inter-item correlation for the RSES-22 was .38, which falls within the acceptable range (.15–.50). The average inter-item correlation for the RSES-4 was .51, slightly above the acceptable range. Overall, evidence of internal consistency was confirmed for each scale.
Factorial Validity Analyses
We conducted two confirmatory factor analyses to assess the factor structure of the RSES-22 and RSES-4 for our sample of first responders receiving mental health services at a community clinic (Table 3). For the RSES-22, a proper solution converged in 10 iterations. Item loadings ranged between .31–.79, with 15 of 22 items loading significantly ( > .6) on the latent variable. It did not meet statistical criteria for good model fit: χ2 (209) = 825.17, p = .000, 90% CI [0.104, 0.120]. For the RSES-4, a proper solution converged in eight iterations. Item loadings ranged between .47–.80, with three of four items loading significantly ( > .6) on the latent variable. It met statistical criteria for good model fit: χ2 (2) = 5.89, p = .053, 90% CI [0.000, 0.179]. The CMIN/DF was above the suggested < 2.0 benchmark; however, the other fit indices indicated a model fit.
Table 3
Confirmatory Factor Analysis Fit Indices for RSES-22 and RSES-4
| Variable |
df |
χ2 |
CMIN/DF |
RMR |
GFI |
CFI |
TLI |
RMSEA |
90% CI |
| RSES-22 |
209 |
825.17/.000 |
3.95 |
.093 |
.749 |
.771 |
0.747 |
.112 |
0.104, 0.120 |
| RSES-4 |
2 |
5.89/.053 |
2.94 |
.020 |
.988 |
.981 |
0.944 |
.091 |
0.000, 0.179 |
Note. N = 238. RSES-22 = Response to Stressful Experiences Scale 22-item; RSES-4 = Response to Stressful Experiences Scale 4-item adaptation; CMIN/DF = Minimum Discrepancy per Degree of Freedom; RMR = Root Mean Square Residual;
GFI = Goodness-of-Fit Index; CFI = Comparative Fit Index; TLI = Tucker-Lewis Index; RMSEA = Root Mean Squared Error of Approximation.
Criterion and Convergent Validity Analyses
To assess for criterion validity of the RSES-22 and RSES-4, we conducted correlational analyses with four established psychological measures (Table 4). We utilized a subsample of participants (n = 190) who completed the PHQ-9, PCL-5, GAD-7, and SBQ-R at intake. Normality of the data was not a concern because analyses established appropriate ranges for skewness and kurtosis (± 1.0). The internal consistency of the RSES-22 (α = .93) and RSES-4 (α = .77) of the subsample was comparable to the larger sample and previous studies. The RSES-22 and RSES-4 related to the psychological measures of distress in the expected direction, meaning measures were significantly and negatively related, indicating that higher resiliency scores were associated with lower scores of symptoms associated with diagnosable mental health disorders (i.e., post-traumatic stress, anxiety, depression, and suicidal behavior). We verified convergent validity with a correlational analysis of the RSES-22 and RSES-4, which demonstrated a significant and positive relationship.
Table 4
Criterion and Convergent Validity of RSES-22 and RSES-4
|
M (SD) |
Cronbach’s α |
RSES-22 |
PHQ-9 |
PCL-5 |
GAD-7 |
SBQ-R |
| RSES-22 |
60.16 (14.17) |
.93 |
— |
−.287* |
−.331* |
−.215* |
−.346* |
| RSES-4 |
11.65 (2.68) |
.77 |
.918 |
−.290* |
−.345* |
−.220* |
−.327* |
Note. n = 190. RSES-22 = Response to Stressful Experiences Scale 22-item; RSES-4 = Response to Stressful Experiences Scale 4-item adaptation; PHQ-9 = Patient Health Questionnaire-9;
PCL-5 = PTSD Checklist-5; GAD-7 = Generalized Anxiety Disorder-7; SBQ-R = Suicidal Behaviors Questionnaire-Revised.
*p < .01.
Discussion
The purpose of this study was to validate the factor structure of the RSES-22 and the abbreviated RSES-4 with a first responder sample. Aggregated means were similar to those in the articles that validated and normed the measures in military samples (De La Rosa et al., 2016; Johnson et al., 2011; Prosek & Ponder, 2021). Additionally, the internal consistency was similar to previous studies. In the original article, Johnson et al. (2011) proposed a five-factor structure for the RSES-22, which was later established as a unidimensional assessment after further exploratory factor analysis (De La Rosa et al., 2016). Subsequently, confirmatory factor analyses with a treatment-seeking veteran population revealed that the RSES-22 demonstrated unacceptable model fit, whereas the RSES-4 demonstrated a good model fit (Prosek & Ponder, 2021). In both samples, the RSES-4 GFI, CFI, and TLI were all .944 or higher, whereas the RSES-22 GFI, CFI, and TLI were all .771 or lower. Additionally, criterion and convergent validity as measured by the PHQ-9, PCL-5, and GAD-7 in both samples were extremely close. Similarly, in this sample of treatment-seeking first responders, confirmatory factor analyses indicated an inadequate model fit for the RSES-22 and a good model fit for the RSES-4. Lastly, convergent and criterion validity were established with correlation analyses of the RSES-22 and RSES-4 with four other standardized assessment instruments (i.e., PHQ-9, PCL-5, GAD-7, SBQ-R). We concluded that among the first responder sample, the RSES-4 demonstrated acceptable psychometric properties, as well as criterion and convergent validity with other mental health variables (i.e., post-traumatic stress, anxiety, depression, and suicidal behavior).
Implications for Clinical Practice
First responders are a unique population and are regularly exposed to trauma (Donnelly & Bennett, 2014; Jetelina et al., 2020; Klimley et al., 2018; Weiss et al., 2010). Although first responders could potentially benefit from espousing resilience, they are often hesitant to seek mental health services (Crowe et al., 2017; Jones, 2017). The RSES-22 and RSES-4 were originally normed with military populations. The results of the current study indicated initial validity and reliability among a first responder population, revealing that the RSES-4 could be useful for counselors in assessing resilience.
It is important to recognize that first responders have perceived coping with traumatic stress as an individual process (Crowe et al., 2017) and may believe that seeking mental health services is counter to the emotional and physical training expectations of the profession (Crowe et al., 2015). Therefore, when first responders seek mental health care, counselors need to be prepared to provide culturally responsive services, including population-specific assessment practices and resilience-oriented care.
Jones (2017) encouraged a comprehensive intake interview and battery of appropriate assessments be conducted with first responder clients. Counselors need to balance the number of intake questions while responsibly assessing for mental health comorbidities such as post-traumatic stress, anxiety, depression, and suicidality. The RSES-4 provides counselors a brief, yet targeted assessment of resilience.
Part of what cultural competency entails is assessing constructs (e.g., resilience) that have been shown to be a protective factor against PTSD among first responders (Klimley et al., 2018). Since the items forming the RSES-4 were developed to highlight the positive characteristics of coping (Johnson et al., 2011), rather than a deficit approach, this aligns with the grounding of the counseling profession. It is also congruent with first responders’ perceptions of resilience. Indeed, in a content analysis of focus group interviews with first responders, participants defined resilience as a positive coping strategy that involves emotional regulation, perseverance, personal competence, and physical fitness (Crowe et al., 2017).
The RSES-4 is a brief, reliable, and valid measure of resilience with initial empirical support among a treatment-seeking first responder sample. In accordance with the ACA (2014) Code of Ethics, counselors are to administer assessments normed with the client population (E.8.). Thus, the results of the current study support counselors’ use of the measure in practice. First responder communities are facing unprecedented work tasks in response to COVID-19. Subsequently, their mental health might suffer (Centers for Disease Control and Prevention, 2020) and experts have recommended promoting resilience as a protective factor for combating the negative mental health consequences of COVID-19 (Chen & Bonanno, 2020). Therefore, the relevance of assessing resilience among first responder clients in the current context is evident.
Limitations and Future Research
This study is not without limitations. The sample of first responders was homogeneous in terms of race, ethnicity, and gender. Subsamples of first responders (i.e., LEO, EMT, fire rescue) were too small to conduct within-group analyses to determine if the factor structure of the RSES-22 and RSES-4 would perform similarly. Also, our sample of first responders included two emergency dispatchers. Researchers reported that emergency dispatchers should not be overlooked, given an estimated 13% to 15% of emergency dispatchers experience post-traumatic symptomatology (Steinkopf et al., 2018). Future researchers may develop studies that further explore how, if at all, emergency dispatchers are represented in first responder research.
Furthermore, future researchers could account for first responders who have prior military service. In a study of LEOs, Jetelina et al. (2020) found that participants with military experience were 3.76 times more likely to report mental health concerns compared to LEOs without prior military affiliation. Although we reported the prevalence rate of prior military experience in our sample, the within-group sample size was not sufficient for additional analyses. Finally, our sample represented treatment-seeking first responders. Future researchers may replicate this study with non–treatment-seeking first responder populations.
Conclusion
First responders are at risk for sustaining injuries, experiencing life-threatening events, and witnessing harm to others (Lanza et al., 2018). The nature of their exposure can be repeated and cumulative over time (Donnelly & Bennett, 2014), indicating an increased risk for post-traumatic stress, anxiety, and depressive symptoms, as well as suicidal behavior (Jones et al., 2018). Resilience is a promising protective factor that promotes wellness and healthy coping among first responders (Wild et al., 2020), and counselors may choose to routinely measure for resilience among first responder clients. The current investigation concluded that among a sample of treatment-seeking first responders, the original factor structure of the RSES-22 was unstable, although it demonstrated good reliability and validity. The adapted version, RSES-4, demonstrated good factor structure while also maintaining acceptable reliability and validity, consistent with studies of military populations (De La Rosa et al., 2016; Johnson et al., 2011; Prosek & Ponder, 2021). The RSES-4 provides counselors with a brief and strength-oriented option for measuring resilience with first responder clients.
Conflict of Interest and Funding Disclosure
The authors reported no conflict of interest
or funding contributions for the development
of this manuscript.
References
American Counseling Association. (2014). ACA code of ethics.
American Psychiatric Association. (2013). Diagnostic and statistical manual of mental disorders (5th ed.).
Antony, J., Brar, R., Khan, P. A., Ghassemi, M., Nincic, V., Sharpe, J. P., Straus, S. E., & Tricco, A. C. (2020). Interventions for the prevention and management of occupational stress injury in first responders: A rapid overview of reviews. Systematic Reviews, 9(121), 1–20. https://doi.org/10.1186/s13643-020-01367-w
Blevins, C. A., Weathers, F. W., Davis, M. T., Witte, T. K., & Domino, J. L. (2015). The Posttraumatic Stress Disorder Checklist for DSM-5 (PCL-5): Development and initial psychometric evaluation. Journal of Traumatic Stress, 28(6), 489–498. https://doi.org/10.1002/jts.22059
Burnett, H. J., Jr. (2017). Revisiting the compassion fatigue, burnout, compassion satisfaction, and resilience connection among CISM responders. Journal of Police Emergency Response, 7(3), 1–10. https://doi.org/10.1177/2158244017730857
Centers for Disease Control and Prevention. (2020, June 30). Coping with stress. https://www.cdc.gov/coronavirus/2019-ncov/daily-life-coping/managing-stress-anxiety.html
Chen, S., & Bonanno, G. A. (2020). Psychological adjustment during the global outbreak of COVID-19: A resilience perspective. Psychological Trauma: Theory, Research, Practice, and Policy, 12(S1), S51–S54. https://doi.org/10.1037/tra0000685
Christopher, M. S., Hunsinger, M., Goerling, R. J., Bowen, S., Rogers, B. S., Gross, C. R., Dapolonia, E., & Pruessner, J. C. (2018). Mindfulness-based resilience training to reduce health risk, stress reactivity, and aggression among law enforcement officers: A feasibility and preliminary efficacy trial. Psychiatry Research, 264, 104–115. https://doi.org/10.1016/j.psychres.2018.03.059
Crowe, A., Glass, J. S., Lancaster, M. F., Raines, J. M., & Waggy, M. R. (2015). Mental illness stigma among first responders and the general population. Journal of Military and Government Counseling, 3(3), 132–149. http://mgcaonline.org/wp-content/uploads/2013/02/JMGC-Vol-3-Is-3.pdf
Crowe, A., Glass, J. S., Lancaster, M. F., Raines, J. M., & Waggy, M. R. (2017). A content analysis of psychological resilience among first responders. SAGE Open, 7(1), 1–9. https://doi.org/10.1177/2158244017698530
De La Rosa, G. M., Webb-Murphy, J. A., & Johnston, S. L. (2016). Development and validation of a brief measure of psychological resilience: An adaptation of the Response to Stressful Experiences Scale. Military Medicine, 181(3), 202–208. https://doi.org/10.7205/MILMED-D-15-00037
Dimitrov, D. M. (2012). Statistical methods for validation of assessment scale data in counseling and related fields. American Counseling Association.
Donnelly, E. A., & Bennett, M. (2014). Development of a critical incident stress inventory for the emergency medical services. Traumatology, 20(1), 1–8. https://doi.org/10.1177/1534765613496646
Greinacher, A., Derezza-Greeven, C., Herzog, W., & Nikendei, C. (2019). Secondary traumatization in first responders: A systematic review. European Journal of Psychotraumatology, 10(1), 1562840. https://doi.org/10.1080/20008198.2018.1562840
Gutierrez, P. M., Osman, A., Barrios, F. X., & Kopper, B. A. (2001). Development and initial validation of the Self-Harm Behavior Questionnaire. Journal of Personality Assessment, 77(3), 475–490. https://doi.org/10.1207/S15327752JPA7703_08
Jetelina, K. K., Mosberry, R. J., Gonzalez, J. R., Beauchamp, A. M., & Hall, T. (2020). Prevalence of mental illnesses and mental health care use among police officers. JAMA Network Open, 3(10), 1–12. https://doi.org/10.1001/jamanetworkopen.2020.19658
Johnson, D. C., Polusny, M. A., Erbes, C. R., King, D., King, L., Litz, B. T., Schnurr, P. P., Friedman, M., Pietrzak, R. H., & Southwick, S. M. (2011). Development and initial validation of the Response to Stressful Experiences Scale. Military Medicine, 176(2), 161–169. https://doi.org/10.7205/milmed-d-10-00258
Jones, S. (2017). Describing the mental health profile of first responders: A systematic review. Journal of the American Psychiatric Nurses Association, 23(3), 200–214. https://doi.org/10.1177/1078390317695266
Jones, S., Nagel, C., McSweeney, J., & Curran, G. (2018). Prevalence and correlates of psychiatric symptoms among first responders in a Southern state. Archives of Psychiatric Nursing, 32(6), 828–835. https://doi.org/10.1016/j.apnu.2018.06.007
Joyce, S., Tan, L., Shand, F., Bryant, R. A., & Harvey, S. B. (2019). Can resilience be measured and used to predict mental health symptomology among first responders exposed to repeated trauma? Journal of Occupational and Environmental Medicine, 61(4), 285–292. https://doi.org/10.1097/JOM.0000000000001526
Kleim, B., & Westphal, M. (2011). Mental health in first responders: A review and recommendation for prevention and intervention strategies. Traumatology, 17(4), 17–24. https://doi.org/10.1177/1534765611429079
Klimley, K. E., Van Hasselt, V. B., & Stripling, A. M. (2018). Posttraumatic stress disorder in police, firefighters, and emergency dispatchers. Aggression and Violent Behavior, 43, 33–44.
https://doi.org/10.1016/j.avb.2018.08.005
Kroenke, K., Spitzer, R. L., & Williams, J. B. W. (2001). The PHQ-9: Validity of a brief depression severity measure. Journal of General Internal Medicine, 16, 606–613. https://doi.org/10.1046/j.1525-1497.2001.016009606.x
Lanza, A., Roysircar, G., & Rodgers, S. (2018). First responder mental healthcare: Evidence-based prevention, postvention, and treatment. Professional Psychology: Research and Practice, 49(3), 193–204. https://doi.org/10.1037/pro0000192
Lee, J.-S., Ahn, Y.-S., Jeong, K.-S. Chae, J.-H., & Choi, K.-S. (2014). Resilience buffers the impact of traumatic events on the development of PTSD symptoms in firefighters. Journal of Affective Disorders, 162, 128–133. https://doi.org/10.1016/j.jad.2014.02.031
Lewis, G. B., & Pathak, R. (2014). The employment of veterans in state and local government service. State and Local Government Review, 46(2), 91–105. https://doi.org/10.1177/0160323X14537835
McCanlies, E. C., Gu, J. K., Andrew, M. E., Burchfiel, C. M., & Violanti, J. M. (2017). Resilience mediates the relationship between social support and post-traumatic stress symptoms in police officers. Journal of Emergency Management, 15(2), 107–116. https://doi.org/10.5055/jem.2017.0319
National Institute of Mental Health. (2017). Post-traumatic stress disorder. https://www.nimh.nih.gov/health/statistics/post-traumatic-stress-disorder-ptsd.shtml
Osman, A., Bagge, C. L., Gutierrez, P. M., Konick, L. C., Kopper, B. A., & Barrios, F. X. (2001). The Suicidal Behaviors Questionnaire–revised (SBQ-R): Validation with clinical and nonclinical samples. Assessment, 8(4), 443–454. https://doi.org/10.1177/107319110100800409
Prosek, E. A., & Ponder, W. N. (2021). Validation of the Adapted Response to Stressful Experiences Scale (RSES-4) among veterans [Manuscript submitted for publication].
Spitzer, R. L., Kroenke, K., Williams, J. B. W., & Löwe, B. (2006). A brief measure for assessing generalized anxiety disorder (The GAD-7). Archives of Internal Medicine, 166(10), 1092–1097.
https://doi.org/10.1001/archinte.166.10.1092
Steinkopf, B., Reddin, R. A., Black, R. A., Van Hasselt, V. B., & Couwels, J. (2018). Assessment of stress and resiliency in emergency dispatchers. Journal of Police and Criminal Psychology, 33(4), 398–411.
https://doi.org /10.1007/s11896-018-9255-3
Substance Abuse and Mental Health Services Administration. (2018, May). First responders: Behavioral health concerns, emergency response, and trauma. Disaster Technical Assistance Center Supplemental Research Bulletin. https://www.samhsa.gov/sites/default/files/dtac/supplementalresearchbulletin-firstresponders-may2018.pdf
Weiss, D. S., Brunet, A., Best, S. R., Metzler, T. J., Liberman, A., Pole, N., Fagan, J. A., & Marmar, C. R. (2010). Frequency and severity approaches to indexing exposure to trauma: The Critical Incident History Questionnaire for police officers. Journal of Traumatic Stress, 23(6), 734–743.
https://doi.org/10.1002/jts.20576
White, B., Driver, S., & Warren, A. M. (2010). Resilience and indicators of adjustment during rehabilitation from a spinal cord injury. Rehabilitation Psychology, 55(1), 23–32. https://doi.org/10.1037/a0018451
Wild, J., El-Salahi, S., Degli Esposti, M., & Thew, G. R. (2020). Evaluating the effectiveness of a group-based resilience intervention versus psychoeducation for emergency responders in England: A randomised controlled trial. PLoS ONE, 15(11), e0241704. https://doi.org/10.1371/journal.pone.0241704
Windle, G., Bennett, K. M., & Noyes, J. (2011). A methodological review of resilience measurement scales. Health and Quality of Life Outcomes, 9, Article 8, 1–18. https://doi.org/10.1186/1477-7525-9-8
Warren N. Ponder, PhD, is Director of Outcomes and Evaluation at One Tribe Foundation. Elizabeth A. Prosek, PhD, NCC, LPC, is an associate professor at Penn State University. Tempa Sherrill, MS, LPC-S, is the founder of Stay the Course and a volunteer at One Tribe Foundation. Correspondence may be addressed to Warren N. Ponder, 855 Texas St., Suite 105, Fort Worth, TX 76102, warren@1tribefoundation.org.
Nov 29, 2018 | Volume 8 - Issue 4
Michael T. Kalkbrenner, Edward S. Neukrug
The primary aim of this study was to cross-validate the Revised Fit, Stigma, & Value (FSV) Scale, a questionnaire for measuring barriers to counseling, using a stratified random sample of adults in the United States. Researchers also investigated the percentage of adults living in the United States that had previously attended counseling and examined demographic differences in participants’ sensitivity to barriers to counseling. The results of a confirmatory factor analysis supported the factorial validity of the three-dimensional FSV model. Results also revealed that close to one-third of adults in the United States have attended counseling, with women attending counseling at higher rates (35%) than men (28%). Implications for practice, including how professional counselors, counseling agencies, and counseling professional organizations can use the FSV Scale to appraise and reduce barriers to counseling among prospective clients are discussed.
Keywords: barriers to counseling, FSV Scale, confirmatory factor analysis, attendance in counseling, factorial validity
According to the World Health Organization (WHO), mental health disorders are widespread, with over 300 million people struggling with depressive disorders, 260 million living with anxiety disorders, and hundreds of millions having any of a number of other mental health disorders (WHO, 2017, 2018). The symptoms of anxiety and depressive disorders can be dire and include hopelessness, sadness, sleep disturbances, motivational impairment, relationship difficulties, and suicide in the most severe cases (American Psychiatric Association, 2013). Worldwide, one in four individuals will be impacted by a mental health disorder in their lifetime, which leads to over a trillion dollars in lost job productivity each year (WHO, 2018). In the United States, approximately one in five adults has a diagnosable mental illness each year, and about 20% of children and teens will develop a mental disorder that is disabling (Centers for Disease Control, 2018).
Substantial increases in mental health distress among the U.S. and global populations have impacted the clinical practice of counseling practitioners who work in a wide range of settings, including schools, social service agencies, and colleges (National Institute of Mental Health, 2017; Twenge, Joiner, Rogers, & Martin, 2017). Identifying the percentage of adults in the United States who attend counseling, as well as the reasons why many do not, can help counselors develop strategies that can make counseling more inviting and, ultimately, relieve struggles that people face. Although perceived stigma and not having health insurance have been associated with reticence to seek counseling (Han, Hedden, Lipari, Copello, & Kroutil, 2014; Norcross, 2010; University of Phoenix, 2013), the literature on barriers to counseling among people in the United States is sparse. Appraising barriers to counseling using a psychometrically sound instrument is the first step toward counteracting such barriers and making counseling more inviting for prospective clients. Evaluating barriers to counseling, with special attention to cultural differences, has the potential to help understand differences in attendance to counseling and can help develop mechanisms that promote counseling for all individuals. This is particularly important as research has shown that there are differences in help-seeking behavior as a function of gender identity and ethnicity (Hatzenbuehler, Keyes, Narrow, Grant, & Hasin, 2008).
Attendance in Counseling by Gender and Ethnicity
Previous investigations on attendance in counseling indicated that 15–38% of adults in the United States had sought counseling at some point in their lives (Han et al., 2014; University of Phoenix, 2013), with discrepancies in counselor-seeking behavior found as a function of gender and ethnicity (Han et al., 2014; Lindinger-Sternart, 2015). For instance, women are more likely to seek counseling compared to men (Abrams, 2014; J. Kim, 2017). In addition, individuals who identify as White tend to seek personal counseling at higher rates compared to those who identify with other ethnic backgrounds (Hatzenbuehler et al., 2008; Seidler, Rice, River, Oliffe, & Dhillon, 2017). Parent, Hammer, Bradstreet, Schwartz, and Jobe (2018) examined the intersection of gender, race, ethnicity, and poverty with help-seeking behavior and found the income-to-poverty ratio to be positively related to help-seeking for White males and negatively associated for African American males. In other words, as White males gained in income, they were more likely to seek counseling, whereas the opposite was true for males who identified as African American (Parent et al., 2018).
Barriers to Mental Health Treatment and Attendance in Counseling
Despite the fact that large numbers of individuals in the United States and worldwide will develop a mental disorder in their lifetime, two-thirds of them will avoid or do not have access to mental health treatment (WHO, 2018). In wealthier countries, there is one mental health worker per 2,000 people (WHO, 2015); however, in poorer countries, this drops to 1 in 100,000, and such disparities need to be addressed (Hinkle, 2014; WHO, 2015). Although the lack of attendance in counseling and related services in poorer countries is explained by lack of services, in the United States and other wealthy countries, the availability of mental health services is relatively high, and the lack of attendance is usually explained by other reasons (Neukrug, Kalkbrenner, & Griffith, 2017; WHO, 2015). Research on the lack of attendance in counseling by the general public shows adults in the United States might be reticent to seek counseling because of perceived stigma, financial burden, lack of health insurance, uncertainty about how to find a counselor, and suspicion that counseling will not be helpful (Han et al., 2014; Norcross, 2010; University of Phoenix, 2013).
Appraising Barriers to Counseling
The quantification and appraisal of barriers to counseling is a nuanced and complex construct to measure and has been previously assessed with populations of mental health professionals and with counseling students (Kalkbrenner & Neukrug, 2018; Kalkbrenner, Neukrug, & Griffith, in press; Neukrug et al., 2017). Knowing that personal counseling is a valuable self-care strategy for mental health professionals (Whitfield & Kanter, 2014), Neukrug et al. (2017) developed the original version of the Fit, Stigma, & Value (FSV) Scale, which is comprised of three latent variables, or subscales, of barriers to counseling for human service professionals: fit (the degree to which one trusts the process of counseling), stigma (hesitation to seek counseling because of feelings of embarrassment), and value (the extent to which a respondent thinks that attending personal counseling will be beneficial). Kalkbrenner et al. (in press) extended and validated a revised version of the FSV Scale with a sample of professional counselors, and Kalkbrenner and Neukrug (2018) validated the Revised FSV Scale with a sample of counselor trainees. Although the FSV Scale appears to have utility for appraising barriers to counseling among mental health professionals (Neukrug et al., 2017; Kalkbrenner et al., in press) the factorial validity of the measure has only been tested with helping professionals and counseling students. The appraisal of barriers to seeking counseling among adults in the United States is an essential first step in understanding why prospective clients do, or do not, seek counseling. If validated, researchers and practitioners can potentially use the results of the Revised FSV Scale to aid in the early identification of specific barriers and to inform the development of interventions geared toward reducing barriers to counseling among adults in the United States. Thus, we sought to answer the following research questions (RQs): RQ 1: Is the three-dimensional hypothesized model of the Revised FSV scale confirmed with a stratified random sample of adults in the United States? RQ 2: To what extent do adults in the United States attend counseling? RQ 3: Are there demographic differences to the FSV barriers among adults in the United States?
Method
The psychometric properties of the Revised FSV Scale were tested with a confirmatory factor analysis (CFA) based on structural equation modeling (RQ 1). Descriptive statistics were used to compute participants’ frequency of attendance in counseling (RQ 2). A factorial multivariate analysis of variance (MANOVA) was computed to investigate demographic differences in respondents’ sensitivity to the FSV barriers (RQ 3). A minimum sample size of 320 (10 participants for each estimated parameter) was determined to be sufficient for computing a CFA (Mvududu & Sink, 2013). An a priori power analysis was conducted using G*Power to determine the sample size for the factorial MANOVA (Faul, Erdfelder, Lang, & Buchner, 2007). Results revealed that a minimum sample size of 269 would provide an 80% power estimate (α = .05), with a moderate effect size, f 2 = 0.25 (Cohen, 1988).
Participants and Procedures
After obtaining IRB approval, an online sampling service (Qualtrics, 2018) was contracted to survey a stratified random sample (stratified by age, gender, and ethnicity) of the general U.S. population based on the 2016–2017 census data. A Qualtrics project management team generated a list of parameters and sample quota constraints for data collection. Once the researchers reviewed and confirmed these parameters, a project manager initiated the stratified random sampling procedure and data collection by sending an electronic link to the questionnaire to prospective participants. A pilot study was conducted using 41 participants and no formatting or imputation errors were found. Data collection for the main study was initiated and was completed in less than one week.
A total of 431 individuals responded to the survey. Of these, 21 responses were omitted because of missing data, yielding a useable sample of 410. Participants ranged in ages from 18 to 84 (M = 45,
SD = 15). The demographic profile included the following: 52% (n = 213) identified as female, 44%
(n = 181) as male, 0.5% (n = 2) as transgender, and 3.4% (n = 14) did not specify their gender. For ethnicity, 63% (n = 258) identified as White, 17% (n = 69) as Hispanic/Latinx, 12% (n = 49) as African American, 5% (n = 21) as Asian, 1% (n = 5) as American Indian or Alaska Native, 0.5% (n = 2) as Native Hawaiian or Pacific Islander, and 1.5% (n = 6) did not specify their ethnicity. For highest degree completed, 1% (n = 5) held a doctoral degree, 7% (n = 29) held a master’s degree, 24% (n = 98) held a bachelor’s degree, 16% (n = 65) had completed an associate degree, 49% (n = 199) had a high school diploma, and 3% (n = 14) did not specify their highest level of education. Eighty-four percent (n = 343) of participants had health insurance at the time of data collection. The demographic profile of our sample is consistent with those found in recent surveys of the general U.S. population (Lumina Foundation, 2017; U.S. Census Bureau, 2017).
Instrumentation
Using the Qualtrics e-survey platform (Qualtrics, 2018), participants were asked to respond to a series of demographic questions as well as the Revised FSV Scale.
Demographic questionnaire. Participants responded to a series of demographic items about their age, ethnicity, gender, highest level of education completed, and if they had health insurance. They also were asked to indicate if they had ever recommended counseling to another person and if they had ever participated in at least one session of counseling as defined by the American Counseling Association (ACA) in the 20/20: Consensus Definition of Counseling: “counseling is a professional relationship that empowers diverse individuals, families, and groups to accomplish mental health, wellness, education, and career goals” (2010, para. 2).
The FSV Scale. The original version of the FSV Scale contained 32 items that comprise three subscales (Fit, Stigma, and Value) for appraising barriers to counselor seeking behavior (Neukrug et al., 2017). Kalkbrenner et al. (in press) developed and validated the Revised FSV Scale by reducing the number of items to 14 (of the original 32) and confirmed the same 3-factor structure of the scale. The Revised FSV Scale (see Table 1) was used in the present study for temporal validity, as it is more current and because it is likely to reduce respondent fatigue, because it is shorter than the original. The Fit subscale appraises the degree to which one trusts the process of counseling (e.g., item 11: “I couldn’t find a counselor who would understand me.”). The Stigma subscale measures respondents’ hesitation to seek counseling because of feelings of embarrassment (e.g., item 1: “My friends would think negatively of me.”). The Value scale reflects the extent to which a respondent thinks that attending personal counseling will be beneficial (e.g., item 8: “It is not an effective use of my time.”). For each item, respondents were prompted with the stem, “I am less likely to attend counseling because . . . ” and asked to rate each item on a Likert-type scale: 1 (strongly disagree), 2 (disagree), 3 (neither agree or disagree), 4 (agree), or 5 (strongly agree). Higher scores designate a greater sensitivity to each barrier. Previous investigators demonstrated adequate to strong internal consistency reliability coefficients for the Revised FSV Scale: α = .82, α = .91, and α = .78, respectively (Kalkbrenner et al., in press) and α = .81, α = .87, and α = .77 (Kalkbrenner & Neukrug, 2018). Past investigators found validity evidence for the 3-dimensional factor structure of the original and revised versions of the FSV Scale through rigorous psychometric testing (factor analysis) with populations of human services professionals (Neukrug et al., 2017), professional counselors (Kalkbrenner et al., in press), and counseling students (Kalkbrenner & Neukrug, 2018).
Results
CFA
A review of skewness and kurtosis values (see Table 1) indicated that the 14 items on the revised FSV scale were largely within the acceptable range of a normal distribution (absolute value < 1; Field, 2013). Mahalanobis d2 indices showed no extreme multivariate outliers. An inter-item correlation matrix (see Table 2) was computed to investigate the suitability of the data for factor analysis. Inter-item correlations were favorable and ranged from r = 0.42 to r = 0.82 (see Table 2).
Table 1
Descriptive Statistics: The Revised Version of the FSV Scale (N = 410)
| Items |
M |
SD |
Skew |
Kurtosis |
| My friends would think negatively of me. (Stigma) |
2.27 |
1.18 |
0.63 |
-0.50 |
| It would suggest I am unstable. (Stigma) |
2.55 |
1.25 |
0.29 |
-0.97 |
| I would feel embarrassed. (Stigma) |
2.72 |
1.20 |
-0.02 |
-1.00 |
| It would damage my reputation. (Stigma) |
2.43 |
1.20 |
0.41 |
-0.78 |
| It would be of no benefit. (Value) |
2.46 |
1.20 |
0.39 |
-0.71 |
| I would feel badly about myself if I saw a counselor. (Stigma) |
2.35 |
1.13 |
0.45 |
-0.61 |
| The financial cost of participating is not worth the personal benefits. (Value) |
2.61 |
1.18 |
0.25 |
-0.68 |
| It is not an effective use of my time. (Value) |
2.40 |
1.16 |
0.45 |
-0.57 |
I couldn’t find a counselor with my theoretical orientation
(personal style of counseling). (Fit) |
2.42 |
1.12 |
0.62 |
-0.68 |
| I couldn’t find a counselor competent enough to work with me. (Fit) |
2.31 |
1.12 |
0.50 |
-0.47 |
| I couldn’t find a counselor who would understand me. (Fit) |
2.41 |
1.20 |
0.48 |
-0.66 |
| I don’t trust a counselor to keep my matters just between us. (Fit) |
2.50 |
1.21 |
0.33 |
-0.82 |
| Counseling is unnecessary because my problems will resolve naturally. (Value) |
2.56 |
1.31 |
0.22 |
-0.61 |
| I have had a bad experience with a previous counselor in the past. (Fit) |
2.34 |
1.17 |
0.44 |
-0.71 |
Table 2
Inter-Item Correlation Matrix
|
Q1 |
Q2 |
Q3 |
Q4 |
Q5 |
Q6 |
Q7 |
Q8 |
Q9 |
Q10 |
Q11 |
Q12 |
Q13 |
Q14 |
| Q1 |
1 |
0.70 |
0.64 |
0.72 |
0.54 |
0.63 |
0.53 |
0.57 |
0.57 |
0.60 |
0.60 |
0.53 |
0.47 |
0.53 |
| Q2 |
|
1 |
0.76 |
0.72 |
0.51 |
0.61 |
0.52 |
0.54 |
0.55 |
0.58 |
0.60 |
0.57 |
0.42 |
0.46 |
| Q3 |
|
|
1 |
0.68 |
0.51 |
0.64 |
0.54 |
0.53 |
0.53 |
0.55 |
0.58 |
0.57 |
0.50 |
0.43 |
| Q4 |
|
|
|
1 |
0.62 |
0.68 |
0.55 |
0.59 |
0.58 |
0.61 |
0.63 |
0.61 |
0.51 |
0.53 |
| Q5 |
|
|
|
|
1 |
0.67 |
0.58 |
0.69 |
0.52 |
0.59 |
0.59 |
0.48 |
0.57 |
0.49 |
| Q6 |
|
|
|
|
|
1 |
0.58 |
0.68 |
0.59 |
0.68 |
0.69 |
0.60 |
0.56 |
0.48 |
| Q7 |
|
|
|
|
|
|
1 |
0.72 |
0.60 |
0.60 |
0.57 |
0.58 |
0.59 |
0.53 |
| Q8 |
|
|
|
|
|
|
|
1 |
0.64 |
0.66 |
0.68 |
0.61 |
0.64 |
0.54 |
| Q9 |
|
|
|
|
|
|
|
|
1 |
0.71 |
0.71 |
0.61 |
0.56 |
0.57 |
| Q10 |
|
|
|
|
|
|
|
|
|
1 |
0.82 |
0.65 |
0.56 |
0.56 |
| Q11 |
|
|
|
|
|
|
|
|
|
|
1 |
0.65 |
0.52 |
0.58 |
| Q12 |
|
|
|
|
|
|
|
|
|
|
|
1 |
0.57 |
0.52 |
| Q13 |
|
|
|
|
|
|
|
|
|
|
|
|
1 |
0.44 |
| Q14 |
|
|
|
|
|
|
|
|
|
|
|
|
|
1 |
A CFA based on structural equation modeling was computed using IBM SPSS Amos version 25 to test the psychometric properties of the revised 14-item scale with adults in the United States (RQ1). A number of goodness-of-fit (GOF) indices recommended by Byrne (2016) were investigated to determine model fit. The Chi Square CMIN absolute fit index was statistically significant: χ2 (74) = 3.54, p < 0.001. More suitable GOF indices for large sample sizes (N > 200) were examined and revealed adequate model fit: comparative fit index (CFI = .96); root mean square error of approximation (RMSEA = .07); 90% confidence interval [.06, .08]; standardized root mean square residual (SRMR = .038); incremental fit index (IFI = .96); and normed fit index (NFI = .94). Collectively, the GOF indices above demonstrated adequate model fit based on the guidelines provided by Byrne. The path model with standardized coefficients is displayed in Figure 1. Tests of internal consistency reliability (Cronbach’s Alpha) revealed strong reliability coefficients for all three FSV subscales: α = .90, α = .91, and α = .87, respectively. An investigation of the path model coefficients (see Figure 1) revealed a moderate to strong association between the FSV barriers. Consequently, researchers computed a follow-up CFA to test if a single-factor model solution for the FSV Scale was a better fit with the data. Results revealed a poor model fit for the single-factor solution, suggesting that retaining the 3-factor model was appropriate for the data.
Figure 1. Confirmatory Factor Analysis Path Model (N = 410)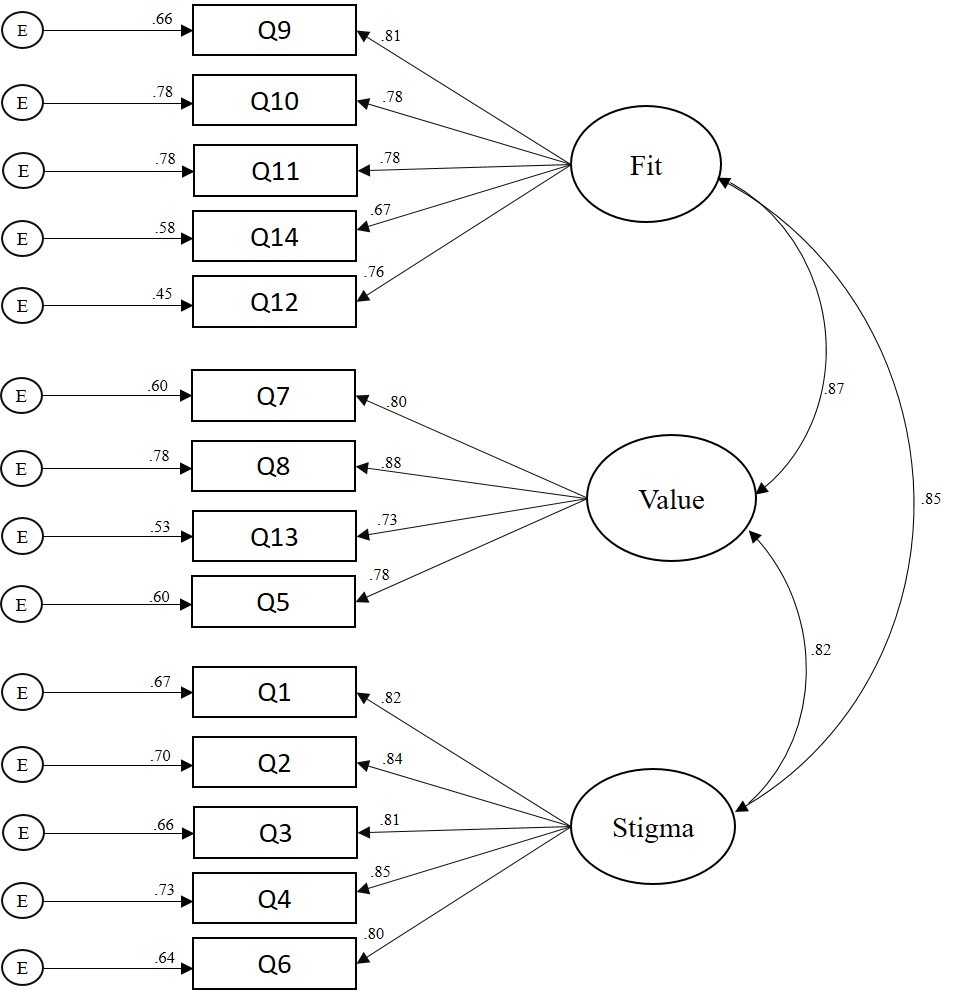
Figure 1. Confirmatory Factor Analysis Path Model (N = 410)
Frequency and Multivariate Analyses
Of the 374 participants who responded to the item regarding whether they had previously attended counseling, 32% (n = 121) indicated they had. A total of 362 participants specified both their gender and past attendance in counseling. Females’ (n = 199) rate of attendance in counseling was 35% (n = 70) and males’ (n = 163) rate of attendance in counseling was 28% (n = 45). Eleven percent
(n = 45) of participants were attending counseling at the time of data collection.
A factorial 2 (gender) X 2 (attendance in counseling) X 2 (ethnicity) MANOVA was computed to examine demographic differences in participants’ sensitivity to barriers to counseling. All three independent variables had two levels: gender (male or female), attendance in counseling (no previous attendance in counseling or previous attendance in counseling), and ethnicity (White or non-White). Based on the recommendations of Kaneshiro, Geling, Gellert, and Millar (2011), the second level of the ethnicity independent variable, non-White, was aggregated by merging all participants who did not identify as White; this ensured comparable groups for statistical analyses. The dependent variables consisted of respondents’ composite scores on each of the three FSV barriers. Because we were interested in investigating all significant main effects and interaction effects across the univariate and multivariate nature of the data, both MANOVA and follow-up univariate ANOVAs were computed (Field, 2013). Bonferroni corrections were applied to control for the familywise error rate.
A significant main effect emerged for gender: F = (7, 354) = 4.73, p = 0.003, Wilks’ Λ = 0.96, η2p = 0.04. The univariate ANOVAs (see Table 3) revealed significant main effects for all three FSV barriers:
Fit: [F = (7, 354) = 6.26, p = 0.013, η2p = 0.02]; Stigma: [F = (7, 354) = 13.71, p < 0.001, η2p = .04]; and
Value: [F = (7, 354) = 5.52, p = 0.02, η2p = .02]. Males (M = 2.56, M = 2.73, M = 2.60) scored higher than females (M = 2.25, M = 2.24, M = 2.23) on Fit, Stigma, and Value, respectively. A significant multivariate main effect also emerged for attendance in counseling: F = (7, 354) = 3.80, p = 0.01, Wilks’ Λ = 0.97, η2p = 0.031. The univariate ANOVA revealed that participants who had not attended counseling (M = 2.60) scored higher than participants who had attended counseling (M = 2.30) on the Value barrier: F = (7, 354) = 4.65, p = 0.03, η2p = 0.01. There were no other statistically significant main effects or any interaction effects (see Table 3). That is, there were no other significant group differences in respondents’ sensitivity to the FSV barriers by gender, attendance in counseling, or ethnicity.
Discussion
The primary aim of the present study was to validate the revised version of the FSV Scale with adults in the United States. Researchers also investigated the percentage of adults that have attended counseling and examined demographic differences in participants’ sensitivity to barriers to counseling. Frequency analyses revealed that 32% of our sample had attended at least one session of personal counseling, and among those who did, females reported a higher rate of attendance (35%) than males (28%). At the time of data collection, 11% of participants were seeing a counselor. Our findings are largely consistent with previous investigations that suggested 15–38% of adults in the United States had sought counseling at some point in their lives (Hann et al., 2014; University of Phoenix, 2013).
Table 3
Demographic Differences in Sensitivity to Barriers to Counseling
2 (gender) X 2 (attendance in counseling) X 2 (ethnicity) Analysis of Variance
| Independent Variable Barrier |
F |
Sig. |
Partial Eta Squared |
| Gender |
*Fit |
6.26 |
0.01 |
0.02 |
|
|
| **Stigma |
13.71 |
0.00 |
0.04 |
|
|
| *Value |
5.52 |
0.02 |
0.02 |
|
|
| Ethnicity |
Fit |
0.34 |
0.56 |
0.00 |
|
|
| Stigma |
0.00 |
0.96 |
0.00 |
|
|
| Value |
0.11 |
0.74 |
0.00 |
|
|
| Attendance in Counseling |
Fit |
0.69 |
0.41 |
0.00 |
|
|
| Stigma |
0.01 |
0.93 |
0.00 |
|
|
| *Value |
4.65 |
0.03 |
0.01 |
|
|
| Gender X Ethnicity |
Fit |
0.00 |
0.96 |
0.00 |
|
|
| Stigma |
0.12 |
0.73 |
0.00 |
|
|
| Value |
0.14 |
0.71 |
0.01 |
|
|
| Gender X Counseling |
Fit |
1.38 |
0.24 |
0.01 |
|
|
| Stigma |
3.00 |
0.08 |
0.01 |
|
|
| Value |
1.32 |
0.25 |
0.00 |
|
|
| Ethnicity X Counseling |
Fit |
0.07 |
0.79 |
0.00 |
|
|
| Stigma |
0.00 |
0.98 |
0.00 |
|
|
| Value |
0.21 |
0.65 |
0.00 |
|
|
| Gender X Ethnicity X Counseling |
Fit |
0.81 |
0.37 |
0.00 |
|
|
| Stigma |
1.19 |
0.28 |
0.00 |
|
|
| Value |
0.24 |
0.62 |
0.00 |
|
|
df = (1, 354) Note: 0.00 denotes values < 0.01. *Indicates statistical significance at the p < 0.05 level (2-tailed). ** Indicates statistical significance at the p < 0.01 level (2-tailed).
Similar to previous literature on attendance in counseling and congruent with gender theory (Levant, Wimer, & Williams, 2011; Seidler et al., 2017; Vogel, Heimerdinger-Edwards, Hammer, & Hubbard, 2011), we found that males were less likely to seek counseling and were particularly susceptible to the Stigma, Fit, and Value barriers when compared to females. Susceptibility to the Stigma barrier suggests that men might be less likely to attend counseling because of feelings of shame or embarrassment (Cheng, Kwan, & Sevig, 2013; Cheng, Wang, McDermott, Kridel, & Rislin, 2018; J. E. Kim, Saw, & Zane, 2015). Males also reported a higher sensitivity to the Fit and Value barriers as compared to women, suggesting they might place less worth on the anticipated benefits of counseling, and if they were to enter counseling, they may be particularly concerned about finding a counselor with whom they are compatible. It is possible that men’s sensitivity to all FSV barriers may simply be related to their underutilization of counseling services when compared to women, although other explanations also might be plausible.
Consistent with Kalkbrenner et al. (in press), we found that independent of gender, participants who had not attended at least one session of personal counseling placed less value on its potential benefits as compared to those who had attended counseling. This finding suggests that to some extent, attendance in personal counseling might moderate the aforementioned gender differences in participants’ sensitivity to the Value barrier. It is possible that attendance in counseling accounts for a more meaningful amount of the variance in sensitivity to the Value barrier to counseling than gender. Also, consistent with the findings of Kalkbrenner et al. (in press) and Kalkbrenner and Neukrug (2018), we found psychometric support for the factorial validity of the revised version of the FSV scale. Similar to these previous investigations (Kalkbrenner & Neukrug, 2018; Kalkbrenner et al., in press), tests of internal consistency revealed strong reliability coefficients for all three FSV scales. The findings of the present investigators add to the growing body of literature on Fit, Stigma, and Value as three primary barriers to seeking counseling among a variety of populations, including human services professionals (Neukrug et al., 2017), professional counselors (Kalkbrenner et al., in press), counselor trainees (Kalkbrenner & Neukrug, 2018), and now with members of the general U.S. population.
An investigation of the path model coefficients (see Figure 1) revealed moderate to strong associations between the FSV barriers, higher compared to past investigations (Kalkbrenner & Neukrug, 2018; Kalkbrenner et al., in press). A follow-up CFA was computed to test if a single-factor model (aggregated FSV barriers into a single scale) was a better factor solution for the data. However, the follow-up CFA revealed poor model fit for the single factor solution, suggesting that Fit, Stigma, and Value comprise three separate dimensions of a related construct. The differences in the strength of association between the FSV scales in the present study and in the studies by Kalkbrenner et al. (in press) and Kalkbrenner and Neukrug (2018) might be explained by differences between the samples. These investigators validated the FSV barriers with populations of professional counselors and counseling students. It is possible that professional counselors and counseling students were better able to discriminate between different types of barriers to counseling compared to members of the general U.S. population because of the clinical nature of their training. In addition, minor discrepancies are expected in any psychometric study in which authors are attempting to confirm the dimensionality of an attitudinal measure with a new sample (Hendrick, Fischer, Tobi, & Frewer, 2013).
To summarize, the results of internal consistency reliability and CFA indicated that the Revised FSV Scale and its dimensions were estimated adequately with a stratified random sample of adults in the United States. We found close to one-third of our sample had attended counseling, 11% were in counseling at the time of data collection, and there were demographic differences in participants’ sensitivity to barriers to counseling by gender and past attendance in counseling. A number of implications for enhancing counseling practice have emerged from these findings.
Implications for Counseling Practice
With 20% of individuals in the general U.S. population living with a mental disorder, 11% in counseling, 32% having attended counseling, and others wanting counseling but wary of attending, counselors, counseling programs, and counseling organizations can all play a part in reducing the barriers that the public faces when deciding whether or not they should attend counseling. Professional counselors can become leaders in reducing barriers to attending counseling among the general U.S. population through outreach and advocacy. The implications of the following strategies for outreach and advocacy are discussed in the subsequent sub-sections: connecting prospective clients with counselors, interprofessional communication, mobile health, and reducing stigma toward seeking counseling.
Connecting Prospective Clients With Counselors
Nationally, counseling organizations can operate campaigns aimed at reducing the stigma associated with counseling and speaking to its value. The National Board for Certified Counselors (NBCC) advocates for the development and implementation of grassroots community mental health approaches for supporting the accessibility of mental health services on both national and international levels (Hinkle, 2014). Like NBCC, other professional organizations (e.g., ACA and the American Mental Health Counselors Association) might include a directory of professional counselors on their website, along with their specialty areas, who work in a variety of geographic locations to help connect prospective clients with services. On a local level, it is recommended that professional counselors engage in outreach with members of their community to identify the potential unique mental health needs of people in their community and learn about potential barriers to counseling in their local area. Specifically, professional counselors can attend town board meetings and other public events to briefly introduce themselves and use their active listening skills to better understand the needs of the local community. The Revised FSV Scale is one potential tool that professional counselors might use when engaging in outreach with members of their community to gain a better understanding about local barriers to counseling.
We found that participants who had previously attended at least one session of personal counseling reported a higher perceived value of the benefits of counseling compared to those who did not attend counseling. It is possible that individuals’ attendance in counseling is related to their attributing a higher value to the anticipated benefits of counseling. Thus, we suggest community mental health counselors consider offering one free counseling session to promote prospective clients’ attendance in counseling. Just one free session might have the benefit of adding value to a client’s perceived worth of the counseling relationship and increase the likelihood of continued attendance in counseling. Offering one free session may be particularly important for men and minorities, who have traditionally attended counseling at lower rates (Hatzenbuehler et al., 2008; Seidler et al., 2017).
Interprofessional Communication
The flourishing of integrated behavioral health and interprofessional practice across the health care system might provide professional counselors with an opportunity to identify and reduce barriers to seeking counseling among the general U.S. population. In particular, integrated behavioral health involves infusing the delivery of physical and mental health care through interprofessional collaborations or teamwork among a variety of different professionals, thus providing a more holistic model for the patient (Johnson, Sparkman-Key, & Kalkbrenner, 2017). Professional counselors can collaborate with primary care physicians and consider the utility of administering the FSV Scale to patients while they are in the waiting room, as the FSV Scale can be accessed electronically via a tablet or smart phone. We recommend that counseling practitioners reach out to local primary care physicians to discuss the utility of integrated behavioral health and make themselves available to physicians for consultation on how to recognize and refer patients to counseling.
Mobile Health (mHealth)
mHealth refers to the delivery of interventions geared toward promoting physical or mental health by means of a cellular phone (Johnson & Kalkbrenner, 2017). Professional counselors can use mHealth to provide prospective clients with a brief overview of counseling, address prominent barriers to counseling faced by students, and provide mental health resources that are available to students. mHealth might be particularly useful for college and school counselors as academic institutions typically have access to students’ cell phone numbers, and students “appear to be open and responsive to the utilization of mHealth” (Johnson & Kalkbrenner, 2017, p. 323). The campus counseling center is underutilized on some college campuses because of stigma (Rosenthal & Wilson, 2016) and students’ unawareness of the services that are available at the counseling center (Dobmeier, Kalkbrenner, Hill, & Hernández, 2013). College counselors might consider using mHealth as a platform for both reducing stigma toward counselor-seeking behavior and for spreading students’ awareness of the services that are available to them for reduced or no fees at the counseling center.
Reducing Stigma Toward Seeking Counseling
Our results are consistent with the body of evidence indicating that when compared to women, men are less likely to attend counseling, more susceptible to barriers to attending counseling, and more likely to terminate counseling early (Levant et al., 2011; Seidler et al., 2017). Consistent with Vogel et al. (2011), we found that stigma was a predominant barrier to counseling among male participants. It is recommended that counseling practitioners focus on normalizing common presenting concerns that men are facing and find venues (e.g., barber shops, sports arenas) where they can reach out to men and lessen their concerns about attending counseling (Neukrug, Britton, & Crews, 2013).
Professional counselors can become leaders in reducing stigma toward help-seeking among men by normalizing common presenting concerns. As one example, the stress, anxiety, and depression men face when given a diagnosis of prostate cancer can potentially be reduced by counselors and their professional associations. By developing ways for the public to understand prostate cancer and its related mental health concerns, counselors and their professional associations can lessen the stigma of the disease. Promoting public awareness also can increase men’s likelihood of talking about a diagnosis of prostate cancer with friends, loved ones, and counselors, in a similar way that a diagnosis of breast cancer has been destigmatized over the past few decades. Professional counselors should consider other strategies that can be utilized to enhance the likelihood for men to attend counseling, such as group counseling or an informal setting.
Limitations and Future Research
Because causal attributions cannot be inferred from a cross-sectional survey research design, future researchers can extend the line of research on the FSV barriers using an experimental design by administering the scale to clients prior to and following attendance in counseling. Results might provide evidence of how counseling lessens one’s sensitivity to some barriers. Consistent with the U.S. Census Bureau (2017), the ethnic identity of the majority of participants in our sample was White. Thus, future research should replicate the present study using a more ethnically diverse sample, especially because individuals who identify with ethnicities other than White tend to seek counseling at lower rates (Hatzenbuehler et al., 2008; Vogel et al., 2011). In addition, despite having used a rigorous stratified random sampling procedure, it is possible that because of the sample size, this sample is not representative of adults in the United States. In addition, self-report bias is a limitation of the present study.
Our findings, coupled with existing findings in the literature (Kalkbrenner & Neukrug, 2018; Kalkbrenner et al., in press), suggest that the psychometric properties of the revised version of the FSV Scale are adequate for appraising barriers to seeking counseling among mental health professionals and adults in the United States. The next step in this line of research is to confirm the 3-factor structure of the FSV Scale with populations that are susceptible to mental health disorders and who might be reticent to seek counseling (e.g., veterans, high school students, non-White populations, and the older adult population; Akanwa, 2015; American Public Health Association, 2014; Bartels et al., 2003). Because we did not place any restrictions on sampling based on prospective participants’ history of mental illness, it is possible that the mean differences between participants’ sensitivity to the FSV barriers were influenced by the extent to which they were living with clinical problems at the time of data collection. Thus, future researchers should validate the FSV barriers with participants who are living with psychiatric conditions. Future researchers might also investigate the extent to which there might be differences in participants’ sensitivity to the FSV barriers based on the amount of time they have been in counseling (e.g., the number of sessions).
Because of the global increase in mental distress (WHO, 2018), future researchers should consider confirming the psychometric properties of the FSV Scale with international populations. In addition, we found that when gender, ethnicity, and previous attendance in counseling were entered into the MANOVA as independent variables, significant differences in the Value barrier only emerged for attendance in counseling. Therefore, previous attendance in counseling might account for a more substantial portion of the variance in barriers to counseling than gender and ethnicity. Future researchers can test this hypothesis using a path analysis.
Summary and Conclusion
Attendance in counseling among members of the general U.S. population has become increasingly important because of the frequency and complexity of mental disorders within the U.S. and global populations (WHO, 2017). The primary aim of the present study was to test the psychometric properties of the Revised FSV Scale, a questionnaire for measuring barriers to counseling using a stratified random sample of U.S. adults. The results of a CFA indicated that the Revised FSV Scale and its dimensions were estimated adequately with a stratified random sample of adults in the United States. The appraisal of barriers to seeking counseling is an essential first step in understanding why prospective clients do or do not seek counseling. At this stage of development, the Revised FSV Scale appears to have utility for screening sensitivity to three primary barriers (Fit, Stigma, and Value) to seeking counseling among mental health professionals and adults in the United States. Further, the Revised FSV Scale can be used tentatively by counseling practitioners who work in a variety of settings as one way to measure and potentially reduce barriers associated with counseling among prospective clients.
Conflict of Interest and Funding Disclosure
The authors reported no conflict of interest or funding contributions for the development of this manuscript.
References
Abrams, A. (2014). Women more likely than men to seek mental health help, study finds. TIME Health. Retrieved from
http://time.com/2928046/mental-health-services-women/
Akanwa, E. E. (2015). International students in Western developed countries: History, challenges, and
prospects. Journal of International Students, 5, 271–284.
American Counseling Association. (2010). 20/20: Consensus definition of counseling. Retrieved from https://www.counseling.org/knowledge-center/20-20-a-vision-for-the-future-of-counseling/consensus-definition-of-counseling
American Psychiatric Association. (2013). Diagnostic and statistical manual of mental disorders (5th ed.). Washington, DC: Author.
American Public Health Association. (2014). Removing barriers to mental health services for veterans. Retrieved from https://www.apha.org/policies-and-advocacy/public-health-policy-statements/policy-database/2015/01/28/14/51/removing-barriers-to-mental-health-services-for-veterans
Bartels, S. J., Dums, A. R., Oxman, T. E., Schneider, L. S., Areán, P. A., Alexopoulos, G. S., & Jeste, D. V. (2003). Evidence-based practices in geriatric mental health care: An overview of systematic reviews and meta-analyses. Psychiatric Clinics of North America, 26, 971–990, x–xi. doi:10.1016/S0193-953X(03)00072-8
Byrne, B. M. (2016). Structural equation modeling with AMOS: Basic concepts, applications, and programming (3rd ed.). New York, NY: Routledge.
Centers for Disease Control and Prevention. (2018). Learn about mental health. Retrieved from https://www.cdc.gov/mentalhealth/learn/index.htm
Cheng, H.-L., Kwan, K.-L. K., & Sevig, T. (2013). Racial and ethnic minority college students’ stigma associated with seeking psychological help: Examining psychocultural correlates. Journal of Counseling Psychology, 60, 98–111. doi:10.1037/a0031169
Cheng, H.-L., Wang, C., McDermott, R. C., Kridel, M., & Rislin, J. L. (2018). Self-stigma, mental health literacy, and attitudes toward seeking psychological help. Journal of Counseling & Development, 96, 64–74. doi:10.1002/jcad.12178
Cohen, J. E. (1988). Statistical power analysis for the behavioral sciences. Hillsdale, NJ: Lawrence Erlbaum Associates, Inc.
Dobmeier, R. A., Kalkbrenner, M. T., Hill, T. L., & Hernández, T. J. (2013). Residential community college student awareness of mental health problems and resources. New York Journal of Student Affairs, 13(2), 15–28.
Faul, F., Erdfelder, E., Lang, A.-G., & Buchner, A. (2007). G*Power 3: A flexible statistical power analysis program for the social, behavioral, and biomedical sciences. Behavior Research Methods, 39, 175–191.
Field, A. (2013). Discovering statistics using IBM SPSS Statistics (4th ed.). Thousand Oaks, CA: Sage.
Han, B., Hedden, S. L., Lipari, R., Copello, E. A. P., & Kroutil, L. A. (2014). Receipt of services for behavioral health problems: Results from the 2014 National Survey on Drug Use and Health. Retrieved from https://www.samh sa.gov/data/sites/default/files/NSDUH-DR-FRR3-2014/NSDUH-DR-FRR3-2014/NSDUH-DR-FRR3-2014.htm
Hatzenbuehler, M. L., Keyes, K. M., Narrow, W. E., Grant, B. F., &, Hasin, D. S. (2008). Racial/ethnic disparities in service utilization for individuals with co-occurring mental health and substance use disorders in the general population: Results from the National Epidemiologic Survey on Alcohol and Related Conditions. The Journal of Clinical Psychiatry, 69, 1112–1121.
Hendrick, T. A. M., Fischer, A. R. H., Tobi, H., & Frewer, L. J. (2013). Self-reported attitude scales: Current practice in adequate assessment of reliability, validity, and dimensionality. Journal of Applied Social Psychology, 43, 1538–1552. doi:10.1111/jasp.12147
Hinkle, J. S. (2014). Population-based mental health facilitation (MHF): A grassroots strategy that works. The Professional Counselor, 4, 1–18. doi:10.15241/jsh.4.1.1
Johnson, K. F., & Kalkbrenner, M. T. (2017). The utilization of technological innovations to support college student mental health: Mobile health communication. Journal of Technology in Human Services, 35(4), 1–26. doi:10.1080/15228835.2017.1368428
Johnson, K. F., Sparkman-Key, N., & Kalkbrenner, M. T. (2017). Human service students’ and professionals’ knowledge and experiences of interprofessionalism: Implications for education. Journal of Human Services, 37, 5–13.
Kalkbrenner, M. T., & Neukrug, E. S. (2018). A confirmatory factor analysis of the Revised FSV Scale with counselor trainees. Manuscript submitted for publication.
Kalkbrenner, M. T., Neukrug, E. S., & Griffith, S. A. (in press). Barriers to counselors seeking counseling: Cross validation and predictive validity of the Fit, Stigma, & Value (FSV) Scale. Journal of Mental Health Counseling.
Kaneshiro, B., Geling, O., Gellert, K., & Millar, L. (2011). The challenges of collecting data on race and ethnicity in a diverse, multiethnic state. Hawai’i Medical Journal, 70(8), 168–171.
Kim, J. (2017, January 30). Why I think all men need therapy: A good read for women too. Psychology Today. Retrieved from https://www.psychologytoday.com/us/blog/the-angry-therapist/201701/why-i-think-all-men-need-therapy
Kim, J. E., Saw, A., & Zane, N. (2015). The influence of psychological symptoms on mental health literacy of college students. American Journal of Orthopsychiatry, 85, 620–630. doi:10.1037/ort0000074
Levant, R. F., Wimer, D. J., & Williams, C. M. (2011). An evaluation of the Health Behavior Inventory-20 (HBI-20) and its relationship to masculinity and attitudes towards seeking psychological help among college men. Psychology of Men & Masculinity, 12, 26–41. doi:10.1037/a0021014
Lindinger-Sternart, S. (2015). Help-seeking behaviors of men for mental health and the impact of diverse cultural backgrounds. International Journal of Social Science Studies, 3, 1–6. doi:10.11114/ijsss.v3i1.519
Lumina Foundation. (2017). A stronger nation: Learning beyond high schools builds American talent. Retrieved from http://strongernation.luminafoundation.org/report/2018/#nation
Mvududu, N. H., & Sink, C. A. (2013). Factor analysis in counseling research and practice. Counseling Outcome Research and Evaluation, 4(2), 75–98. doi:10.1177/2150137813494766
National Institute of Mental Health. (2017). Mental Illnesses. Retrieved from https://www.nimh.nih.gov/health/statistics/mental-illness.shtml#part_154787
Neukrug, E., Britton, B. S., & Crews, R. C. (2013). Common health-related concerns of men: Implications for counselors. Journal of Counseling & Development, 91, 390–397. doi:10.1002/j.1556-6676.2013.00109
Neukrug, E., Kalkbrenner, M. T., & Griffith, S. A. (2017). Barriers to counseling among human service professionals: The development and validation of the Fit, Stigma, & Value Scale. Journal of Human Services, 37, 27–40.
Norcross, A. E. (2010). A case for personal therapy in counselor education. Counseling Today, 53(2), 40–42.
Parent, M. C., Hammer, J. H., Bradstreet, T. C., Schwartz, E. N., & Jobe, T. (2018). Men’s mental health help-seeking behaviors: An intersectional analysis. American Journal of Men’s Health, 12, 64–73. doi:10.1177/1557988315625776
Qualtrics [Online survey platform software]. (2018). Provo, UT. Retrieved from https://www.qualtrics.com/
Qualtrics Sample Services [Online sampling service service]. (2018). Provo, UT. Retrieved from https://www.qualtrics.com/online-sample/
Rosenthal, B. S., & Wilson, W. C. (2016). Psychosocial dynamics of college students’ use of mental health services. Journal of College Counseling, 19(3), 194–204. doi:10.1002/jocc.12043
Seidler, Z. E., Rice, S. M., River, J., Oliffe, J. L., & Dhillon, H. M. (2017). Men’s mental health services: The case for a masculinities model. Journal of Men’s Studies, 25, 92–104. doi:10.1177/1060826517729406
Twenge, J. M., Joiner, T. E., Rogers, M. L., & Martin, G. N. (2017). Increases in depressive symptoms, suicide-related outcomes, and suicide rates among U.S. adolescents after 2010 and links to increased new media screen time. Clinical Psychological Science, Advanced online publication. doi:10.1177/2167702617723376
University of Phoenix. (2013). University of Phoenix survey reveals 38 percent of individuals who seek mental health counseling experience barriers. Retrieved from http://www.phoenix.edu/news/releases/2013/05/university-of-phoenix-survey-reveals-38-percent-of-individuals-who-seek-mental-health-counseling-experience-barriers.html
U.S. Census Bureau. (2017). Population estimates, July 1, 2017. Retrieved from https://www.census.gov/quick facts/fact/table/US/PST045216
Vogel, D. L., Heimerdinger-Edwards, S. R., Hammer, J. H., & Hubbard, A. (2011). “Boys don’t cry”: Examination of the links between endorsement of masculine norms, self-stigma, and help-seeking attitudes for men from diverse backgrounds. Journal of Counseling Psychology, 58, 368–382.
doi:10.1037/a0023688
Whitfield, N., & Kanter, D. (2014). Helpers in distress: Preventing secondary trauma. Reclaiming Children and Youth, 22(4), 59–61.
World Health Organization. (2015). Global health workforce, finances remain low for mental health. Retrieved from http://www.who.int/mediacentre/news/notes/2015/finances-mental-health/en/
World Health Organization. (2017). World mental health day, 2017: Mental health in the workplace. Retrieved from http://www.who.int/mental_health/world-mental-health-day/2017/en/
World Health Organization. (2018). World health report: Mental disorders affect one in four people. Retrieved from http://www.who.int/whr/2001/media_centre/press_release/en/
Jun 28, 2018 | Volume 8 - Issue 2
Michael T. Kalkbrenner, Christopher A. Sink
College counselors provide training to their campus constituents on various mental health issues, including the identification of warning signs and the referral of students to appropriate resources. Though extensive information on these topics is available in the counseling literature, college counselors lack a psychometrically sound screening instrument to support some of these educational efforts. To meet this need, the present researchers developed and validated the College Mental Health Perceived Competency Scale (CMHPCS). Based largely on self-determination theory, the measure appraises college student and faculty members’ perceived competence for supporting student mental health. Reliability and construct validity of the CMHPCS are demonstrated through exploratory and confirmatory factor analyses. Hierarchical logistic regression procedures yielded sufficient evidence of the CMHPCS’s predictive validity. Specific applications to assist college counselors with outreach and consultation are discussed.
Keywords: College Mental Health Perceived Competency Scale, college counselors, confirmatory factor analysis, hierarchical logistic regression, screening instrument
The prevalence and complexity of mental health disorders remain a serious concern for mental health professionals working in university and college settings in the United States and internationally (Lee, Ju, & Park, 2017). Another distressing trend is the incongruity between the relatively high frequency of students living with mental health disorders and the small number of students who receive needed treatment (Eisenberg, Hunt, Speer, & Zivin, 2011). Preliminary evidence shows that faculty members, staff, and college student peers might serve as helpful counseling referral agents for individuals at risk for mental health disorders (Kalkbrenner, 2016; White, Park, Israel, & Cordero, 2009). Identifying and training counseling referral agents (e.g., student peers and faculty members) to recognize and refer students to the counseling center is a key role of college counselors (Brunner, Wallace, Reymann, Sellers, & McCabe, 2014; Sharkin, 2012).
The purpose of the present study was to develop and validate a scale for appraising student and faculty members’ perceived competence for supporting college student mental health. Throughout the present study, “perceived competence for supporting college student mental health” refers to the extent to which university community members are confident in their ability to promote a campus climate that is supportive, accepting, and facilitative toward mental wellness. The College Mental Health Perceived Competency Scale (CMHPCS) has potential to aid college counselors with identifying and training university community members (e.g., student peers and faculty) to recognize issues and refer their peers and students to campus counseling services. In the following section, we provide an overview of the pertinent literature.
Undergraduates in Western countries are typically in late adolescence, a period when mental disorders are most likely to emerge, and college students report more frequent mental health concerns than other age groups (de Lijster et al., 2017; Eisenberg et al., 2011). Despite this reality, Eisenberg et al. (2011) indicated that only 20% of college students with mental health disorders were actively seeking treatment. Research suggests that there are common factors contributing to students’ underutilization of counseling services, including: stigma, gender, culture, experience and knowledge (mental health literacy), fear, and accessibility (Brunner et al., 2014; Marsh & Wilcoxon, 2015). For example, many undergraduates are simply unaware of the campus counseling services provided by their universities (Dobmeier, Kalkbrenner, Hill, & Hernández, 2013). Relatedly, college students’ general knowledge of mental health issues varies substantially. Kalkbrenner, James, and Pérez-Rojas (2018) found that students who attended at least one session of personal counseling reported a significantly higher awareness of warning signs for mental distress when compared to students who had not attended counseling. Other evidence suggests that the perceived stigma associated with obtaining mental health support can be a barrier to treatment (Rosenthal & Wilson, 2016) for college students.
Demographic differences exist in college students’ counselor-seeking behavior, with female students reporting a greater willingness to pursue counseling and to refer peers to resources for mental distress when compared to male students (Kalkbrenner & Hernández, 2017; Yorgason, Linville, & Zitzman, 2008). Students from ethnic minority groups also underutilize counseling centers’ mental health services (Han & Pong, 2015; Li, Marbley, Bradley, & Lan, 2016). In addition, Eisenberg, Goldrick-Rabe, Lipson, and Broton (2016) identified differences in college students’ utilization of resources for mental distress by age, with younger students (under 25) being particularly vulnerable to living with untreated mental issues. To enhance access and usage of counseling services by all college students, these variables must be seriously considered by campus policymakers and mental health practitioners.
Given this situation, college counselors must not only address the increased demand for counseling services, they may need to enhance prevention services as well. These latter activities include outreach, consultation, and education of university community members (e.g., student peers and faculty members). For instance, counselors educate students and faculty members on recognizing the warning signs of mental health distress in themselves and others (Brunner et al., 2014). Training also is commonly provided to campus members on the referral process. Participants learn the skills needed to guide others (e.g., students at risk for mental health disorders) to appropriate counseling and related services (Brunner et al., 2014; Sharkin, 2012). Preliminary investigations support these efforts, and faculty members, staff, and college student peers have been found to be helpful referral agents (Kalkbrenner, 2016; White et al., 2009).
Although research shows that students and faculty members are viable referral sources (Kalkbrenner, 2016; White et al., 2009), Albright and Schwartz’s (2017) national survey of these groups found that approximately half of their respondents felt unprepared to recognize the warning signs of mental distress in others. Based on these findings, as suggested above, college counselors may need to revise the content and delivery of their mental health–related training. Moreover, the literature appears to be lacking a psychometrically sound screening tool to assist with this effort. To help fill this instrumentation gap, the authors developed a brief questionnaire for college counselors to appraise student and faculty members’ perceived competence for supporting college student mental health.
Theoretical Foundation for Measurement Instrument
The first step in designing a measurement instrument involves the use of theory to guide the item development process (DeVellis, 2016). In recent years, self-determination theory (SDT), a psychological orientation to human motivation, is increasingly deployed by counseling researchers as an orienting conceptual framework (Adams, Little, & Ryan, 2017; Ryan & Deci, 2000; Ryan, Lynch, Vansteenkiste, & Deci, 2011). Aligned with this trend, SDT guided the item development for the CMHPCS. This perspective conceptualizes motivation in terms of the extent to which one’s behaviors are autonomous (self-motivated) contrasted with the extent to which behaviors are coerced or pressured (Patrick & Williams, 2012). Leading SDT proponents contend that the satisfaction of people’s needs is essential to foster their intrinsic motivation (i.e., a person’s autonomous or self-generated behaviors; Patrick & Williams, 2012; Ryan & Deci, 2000). Key elements of this approach include one’s perceptions of self-competence, autonomy, and relatedness to others (Ryan & Deci, 2000). Evidence suggests that increases in the extent to which individuals feel competent that they can perform an action or behavior are associated with increases in their motivation to participate in that action or behavior (Adams et al., 2017; Jeno & Diseth, 2014).
Elements of SDT are utilized in various helping professions, including psychiatry (Piltch, 2016), medicine (Mancini, 2008), and college counseling (A. E. Williams & Greene, 2016). Research suggests that SDT is a valuable framework for various mental health practices. For instance, Patrick and Williams (2012) demonstrated that perceived competence, a key dimension of SDT, was a significant predictor of clients’ medication adherence. Other investigators demonstrated the utility of SDT for promoting college student mental health (Emery, Heath, & Mills, 2016; A. E. Williams & Green, 2016). In one study, college students’ level of motivation and perceived competence were found to be important factors associated with their mental and physical well-being (Adams et al., 2017). Jeno and Diseth (2014) indicated that a college student’s sense of autonomy and perceived competence were significant predictors of improved academic performance. Another investigation found that group therapy based on SDT and motivational interviewing reduced college women’s susceptibility to high-risk alcohol use (A. E. Williams & Green, 2016). Moreover, university students’ sense of perceived competence and emotional regulation were associated with reductions in non-suicidal self-injury (Emery et al., 2016). Emery et al. (2016) concluded that SDT and college students’ need for perceived competence were salient notions for conceptualizing non-suicidal self-injury and supporting college student mental health.
Self-Determination Theory and Psychometric Instruments
SDT is a widely used theoretical framework to develop measurement instruments in the social sciences. Multiple educational scales have been founded on constructs aligned with SDT, including the Learning Climate Questionnaire (G. C. Williams & Deci, 1996), the Basic Psychological Need Scale (Ntoumanis, 2005), the Academic Self-Regulation Questionnaire (Ryan & Connell, 1989), and the Perceived Competence scale (G. C. Williams & Deci, 1996). Each instrument appraises latent variables related to students’ level of perceived competence and intrinsic motivation toward academic success (Jeno & Diseth, 2014). Given the promising implications of SDT for informing the development of clinical and educational interventions and appraisal instruments, college counselors might benefit from a scale that assesses student and faculty members’ perceived competence related to supporting college student mental health. Such a measure has potential to aid in the early identification of college students at risk for mental health issues and support general campus mental health services. Research indicates that effective screening generally leads to more college students seeking meaningful treatment and support (Hill, Yaroslavsky, & Pettit, 2015).
In an extensive review of the measurement literature with no restrictions on participants or locations, Wei, McGrath, Hayden, and Kutcher (2015) identified 215 measurement instruments for appraising three major components of mental health literacy, including help-seeking, knowledge, and stigma. While these instruments have utility within the screening process, a measure designed to appraise one’s sense of perceived competence toward promoting mental health support on college campuses is absent. The characteristic of perceived competency has potential to act as a protective factor against mental distress (A. E. Williams & Green, 2016). Therefore, the authors incorporated the perceived self-competence dimension of SDT to formulate CMHPCS items.
To summarize, the purpose of the present study was to develop and validate a measurement instrument for appraising student and faculty members’ perceived competence for supporting college student mental health through recognizing and referring student peers to resources for mental wellness. The following research questions were posed: (1) What is the underlying factor structure of the CMHPCS using a large sample of college faculty and are the emergent scales reliable? (2) Is the emergent factor structure from the CMHPCS confirmed in a new sample of undergraduate students? and (3) To what extent do participants’ CMHPCS scores have predictive validity for whether or not they have made a student referral to the counseling center?
Method
Participants and Procedures
Data were collected from students and faculty members at a large mid-Atlantic public university. G*Power was used to conduct a priori power analysis for the hierarchical logistic regression analyses described below (Faul, Erdfelder, Lang, & Buchner, 2007). A minimum sample size of 264 (132 in each sample) would provide a 95% power estimate, α = .05 (two tailed), with an odds ratio of 2.0. Based on the recommendations of Mvududu and Sink (2013), the researchers ensured that the ratio of respondents to each estimated parameter for the student sample (26:1) and for the faculty sample (11:1) was sufficient for factor analysis. The CMHPCS was administered to 513 university community members, including a sample of 201 faculty members and 312 undergraduate students. The sampling procedures and demographic profiles of the two samples are described in the following subsections.
Faculty. Potential faculty participants (N = 1,000) were solicited via an email list provided by the university’s Office of Institutional Research. The measure was administered to this sample using a well-known e-survey platform, Qualtrics (2017). Overall, the response rate was 21%, consistent with the response rates of previous survey research with faculty members (e.g., Brockelman & Scheyett, 2015). Of faculty respondents, 59% (n = 118) identified as female, 40% (n = 81) identified as male, 0.5% (n = 1) identified as “other gender,” and 0.5% (n = 1) did not specify their gender. The majority of participants, 81% (n = 162), identified as Caucasian or White, followed by African American, 4% (n = 8); Hispanic or Latinx, 4% (n = 8); Asian, 3% (n = 6); and multiethnic, 2% (n = 3); while 8% (n = 14) did not specify their ethnic background. Faculty members comprised a variety of different ranks, including adjunct instructor (29%, n = 59), lecturer (19%, n = 39), assistant professor (17%, n = 35), associate professor (18%, n = 37), and full professor (8%, n = 16), while 7.5% (n = 15) did not specify their rank.
Students. Data were collected from 312 undergraduate college students using a nonprobability sampling procedure. Over 34 days (four data collection sessions lasting 2.5 hours), the questionnaire was administered to students in the student union. These respondents ranged in ages from 18–51 (M = 21, SD = 5), with 95% of participants under the age of 29 at the time of data collection. Furthermore, 64% (n = 201) were females, 34% (n = 107) were males, 1% (n = 3) identified as “other gender,” and 0.3% (n = 1) did not specify their gender. The college generational status of these respondents was 37% (n = 116) first, 40% (n = 124) second, and 23% (n = 72) third and beyond. Ethnicities were distributed as follows: 48% (n = 150) African American, 30% (n = 95) Caucasian or White, 10% (n = 30) multiethnic, 6% (n = 19) Hispanic or Latinx, 4% (n = 12) Asian, 1% (n = 3) Native Hawaiian or Pacific Islander, and 0.3% (n = 1) American Indian or Alaska Native, while 0.6% (n = 2) did not report their ethnic identity.
Instrumentation and Procedures
The authors followed the instrument development guidelines discussed by experts in psychometrics and questionnaire design (DeVellis, 2016; Fowler, 2014). An initial set of 18 items was created on a Likert-type scale, ranging from 1 (strongly disagree) to 5 (strongly agree). As discussed above, the original theoretical framework of SDT (Ryan & Deci, 2000) and its contemporary extensions (Adams et al., 2017) guided the development of item content. Item content was also derived from major themes identified in the literature review (comfort, stigma, referrals, prevalence, and complexity), particularly those related to student and faculty members’ connection to college student mental health support (Bishop, 2016; Eisenberg et al., 2011; Lee et al., 2017). The following CMHPCS items, for example, reflect SDT (the positive association between one’s sense of competency and action) and the research findings that one’s sense of comfort with mental health disorders is associated with increased referrals to resources for mental health disorders: “I am comfortable talking to students about mental health”; “I am comfortable referring college students with mental health issues to the health center on campus”; “I am aware of the university resources for mental health”; and “Mental health issues are increasing among college students.” Negatively worded items were recoded so that higher scores would indicate higher perceived competence.
To obtain background information on the respondents, 11 demographic items were added to the questionnaire. These were developed in light of previous college counseling research that showed group differences (e.g., gender, ethnicity, previous attendance in counseling) on various mental health–related variables (Eisenberg et al., 2016; Kalkbrenner & Hernández, 2017). Sample items included the following: (1) Please select your gender; (2) Please specify your age (in years); and
(3) Indicate your ethnic identity.
The initial item pool was subjected to expert review and pilot testing to establish content validity. The items were sent to three expert reviewers with advanced training in clinical psychology, mental health counseling, and psychometrics. Their recommendations informed slight modifications to 15 items, improving their clarity and readability. A few additional items and formatting revisions were made based on pertinent feedback from pilot study participants (22 graduate students). For example, we clarified the meaning of “referred another student to counseling services” to “referred (recommended) that another student seek counseling services.”
Statistical Analyses
A series of statistical analyses were computed to answer the research questions, including exploratory factor analysis (EFA), confirmatory factor analysis (CFA), and hierarchical logistic regression (HLR). During phase 1 of the study using the faculty sample, a principal factor analysis (PFA) was conducted to determine the underlying latent factor structure of the CMHPCS (Mvududu & Sink, 2013). Given that the constructs related to SDT are generally correlated (Adams et al., 2017), the researchers used an oblique rotation (direct oblimin, ∆ = 0). The Kaiser criterion (eigenvalues [Λ] > 1), meaningful variance accounted for by each factor (≥ 5%), a review of the scree plot, and parallel analysis results guided the factor extraction process. Factor retention criteria were used based on the recommendations of Mvududu and Sink (2013): factor loadings > .40, commonalities (h2) > .30, and cross-loadings < .30. The content of items that loaded on each factor were reviewed for redundancy, as it is an accepted practice to remove an item that is highly correlated and conceptually similar to at least one other item (Byrne, 2016).
To cross-validate these initial factor analytic results, a CFA using a maximum likelihood estimation method was conducted to test the validity of the factor solution that emerged in the EFA with a sample of undergraduate students (research question 2). Using the recommendations of Byrne (2016), the following goodness-of-fit indices were reported: chi-square absolute fit index (CMIN), comparative fit index (CFI), root mean square error of approximation (RMSEA), standardized root mean square residual (SRMR), goodness-of-fit-index (GFI), and normed fit index (NFI).
Two HLR analyses were computed to examine the predictive validity of the CMHPCS for both faculty member and student participants (research question 3). Previous investigators found group demographic differences in college students’ willingness to utilize mental health services by age (Eisenberg et al., 2016) and their willingness to make peer-to-peer referrals to resources by gender (Kalkbrenner & Hernández, 2017). Based on these findings, gender and age were entered into the first regression model as predictor variables. Participants’ composite scores on the knowledge, fear, and engagement scales of the CMHPCS were entered into the second regression model as predictor variables. The criterion variable was participants’ referrals to the counseling center (1 = has not made a referral to the counseling center, or 2 = has made referrals to the counseling center).
Results
After screening the data, descriptive statistics were computed on the faculty and student samples to examine unusual or problematic response patterns, missing data, and the parametric nature of the item distributions. Missing values analyses revealed that less than 2% of data was absent from faculty participants and less than 1% of data was absent from student participants. Both data sets were winsorized and missing values were replaced with the series mean (Field, 2018). Skewness and kurtosis values for items were largely within the acceptable range of a normal distribution (absolute value < 1) for the sample of faculty members and the sample of students (see Table 1). The findings are presented in three phases of analyses that correspond to the three research questions, respectively.
Phase 1: Exploratory Factor Analysis
A PFA was conducted using the sample of faculty members to establish the initial dimensionality of the CMHPCS (research question 1). The inter-item correlation matrix revealed low-to-moderate correlations among items (r = .17 to r = .69). The Kaiser-Meyer-Olkin Measure of Sampling Adequacy (KMO = .81) and Bartlett’s Test of Sphericity (B [153] = 1375.91, p < 0.001) provided further evidence that the data set was factorable. The oblique rotated PFA (direct oblimin, ∆ = 0) revealed a 5-factor solution based on the Kaiser criterion (Λ > 1.00). Seventy percent of the total variance in the correlation matrix was explained by these five factors. The scree plot, parallel analysis, and meaningful variance explained (at least 5% for each factor) that a 3-factor solution was the most parsimonious with the least evidence of cross-loadings (see Table 2). Five items displayed commonalities < .30 and were consequently removed from the analysis. The first factor accounted for 31.6% of the variance (Λ = 4.74), the second factor comprised 12.5% of the variance (Λ = 1.89), and the third factor accounted for 11.8% of the variance (Λ = 1.78).
Redundant items that were highly correlated, and thus conceptually interrelated, were deleted. The inter-item correlation matrix was reproduced and indicated that item 8 (“I am aware of resources in the community for mental health”) and item 15 (“I am aware of the university resources for mental health”) were statistically and conceptually similar, suggesting that these items were measuring the same construct. Item 8 was subsequently removed, as the content of item 15 was more closely related to mental health services on campus. The PFA was recomputed and a final 3-factor solution (see Table 2) comprised of 12 items was retained. These 12 items were renumbered in chronological order.
Table 1
Descriptive Statistics for Final Items
|
Faculty (N = 201) |
Student (N = 312) |
| Truncated Item Content |
M |
SD |
Skew |
Kurtosis |
M |
SD |
Skew |
Kurtosis |
|
|
|
|
|
|
|
|
|
| 1. Severity of mental health issues |
.03 |
.95 |
-.86 |
.09 |
.08 |
.85 |
-1.02 |
.95 |
| 2. Complexity of mental health issues |
.03 |
.96 |
.17 |
-.07 |
.05 |
.94 |
-.54 |
-.48 |
3. Comfortable making referrals to
counseling |
.01 |
.97 |
-.86 |
-.64 |
.06 |
.94 |
-.79 |
-.14 |
| 4. Fear of students with mental health issues |
.01 |
1.00 |
-.13 |
-.35 |
.00 |
1.00 |
-.56 |
-.38 |
| 5. Negative academic impact of mental distress |
.02 |
.99 |
.17 |
.63 |
.04 |
.93 |
-.87 |
.18 |
| 6. Increasing prevalence of mental health issues |
.02 |
.97 |
-.14 |
-.53 |
.03 |
.96 |
-.43 |
-.58 |
| 7. Comfortable making student referrals to the health center |
.01 |
.96 |
-.95 |
.29 |
.05 |
.95 |
-.97 |
.34 |
| 8. Interacting with students living with mental distress |
.01 |
.99 |
-.57 |
-.37 |
.05 |
.93 |
-.93 |
.24 |
| 9. Fear of students with mental disorders |
.00 |
1.00 |
-.26 |
-.47 |
.00 |
1.00 |
-.69 |
-.25 |
| 10. University resources for mental distress |
.00 |
.99 |
-.71 |
-.13 |
.02 |
.97 |
-.89 |
.02 |
| 11. Negative impact of mental distress on well-being |
.04 |
.95 |
-.82 |
.16 |
.03 |
.97 |
-.90 |
.19 |
12. Comfortable making referrals to
community counselors |
.01 |
1.00 |
-.59 |
-.42 |
.05 |
.95 |
-.83 |
-.12 |
Note. Windsorized values (z-scores) are reported; faculty: SEKurtosis = 0.34, SESkewness = 0.17; students: SEKurtosis = 0.13, SESkewness = 0.20. Spinets of item content are provided based on the guidelines from the Publication Manual of the American Psychological Association, 6th edition. To access the full version of the scale, please contact the corresponding author.
The three emergent factors were named engagement, fear, and knowledge, respectively (see Table 2). The first factor, engagement, was comprised of items 3, 7, 8, 10 and 12. It estimates the degree to which a faculty member is involved with interacting, supporting, and working with students who are struggling with mental health disorders (e.g., item 7 [“I am comfortable referring college students with mental health issues to the health center on campus”] and item 8 [“I am comfortable talking to students about mental health”]). The second factor, fear, was comprised of items 4 and 9 and appraises one’s anxiety or concern surrounding mental health issues on college campuses (e.g., item 4 [“Students with mental health issues are dangerous”]). The last factor, knowledge, was marked by items 1, 2, 5, 6, and 11. These items reflect the extent to which the respondent was familiar with mental health issues on college campuses (e.g., item 4 [“Mental health issues are becoming more complex among college students”] and item 10 [“Mental health issues are increasing among college students”]).
Table 2
Principal Factor Analysis Results Using Oblique Rotation: Faculty Members (N = 201)
|
Factor 1 (E) |
Factor 2 (F) |
Factor 3 (K) |
|
| Items |
Loadings |
h2 |
| Item #3 |
0.75 |
|
|
0.58 |
| Item #8 |
0.68 |
|
|
0.57 |
| Item #10 |
0.68 |
|
|
0.58 |
| Item #7 |
0.65 |
-0.13 |
|
0.51 |
| Item #12 |
0.63 |
|
|
0.38 |
| Item #4 |
|
0.86 |
|
0.55 |
| Item #9 |
|
0.81 |
|
0.53 |
| Item #6 |
|
0.12 |
0.67 |
0.56 |
| Item #2 |
|
0.12 |
0.66 |
0.57 |
| Item #11 |
|
|
0.65 |
0.45 |
| Item #1 |
|
0.18 |
0.53 |
0.33 |
| Item #5 |
|
-0.18 |
0.51 |
0.38 |
| Eigenvalues |
4.74 |
1.89 |
1.78 |
|
| % of variance |
32.0 |
12.5 |
11.9 |
|
| Alpha coefficient |
0.84 |
0.83 |
0.75 |
|
Note. Factor loadings over 0.40 appear in bold and mark the particular factor. Blank cells indicate factor loadings ≤ 0.10.
E = Engagement; F = Fear; K = Knowledge.
Item and internal consistency reliability analyses were computed for the three derived factors to partially answer research question 1. Adequate reliability coefficients were found for the overall measure (α = .81) and for each dimension: engagement (α = .84), fear (α = .83), and knowledge (α = .75). The low correlations between factors (engagement and fear, r = 0.09; engagement and knowledge,
r = 0.37; and fear and knowledge, r = 0.11) supported the discriminant validity of the measure.
Phase 2: Confirmatory Factor Analysis
To cross-validate the CMHPCS with a sample of undergraduate students, a CFA was computed (research question 2). The assumptions necessary for conducting a CFA were met (Byrne, 2016). Multicollinearity was not present, as bivariate correlations did not exceed an absolute value of 0.36. In addition, Mahalanobis d2 indices revealed no extreme multivariate outliers. The standardized path model is depicted in Figure 1. It was not surprising that the CMIN absolute fit index was statistically significant due to the large sample size: χ2(51) = 1.97, p = .007. However, fit indices that are more appropriate for sample sizes larger than 200 revealed an adequate model fit. For example, the CFI = .96, RMSEA = .05, 90% CI [.04, .07], SRMR = .04, and GFI = .95. The path coefficients (see Figure 1) between the engagement and knowledge scales (.48) indicated a stronger relationship than the engagement and fear (.05) or fear and knowledge scales (.07). (These path coefficients are interpreted in the discussion section). Taken together, the CFA results produced a moderate-to-strong fit based on the guidelines from structural equation modeling researchers (Byrne, 2016). Reliability of the dimensions was re-examined with the student sample, yielding similar estimates to those found with faculty respondents. Internal consistency indices for the overall measure (α = .78) as well as for the three scales (engagement, α = .82; knowledge, α = .75; fear scale, α = .74) were adequate for an attitudinal questionnaire.
Phase 3: Hierarchical Logistic Regression Analyses
The guidelines for HLR assumption checking were followed (Field, 2018). Items were winsorized to remove extreme outliers. Skewness and kurtosis values (see Table 1) were largely within the acceptable range (± 1.00) for both samples. Pearson product correlations were computed between the independent variable scores, revealing no multicollinearity. Box and Tidwell’s (1962) procedure revealed that the assumption of linearity was met for both samples (i.e., the logit of the criterion variable was linearly related to all continuous predictor variables).
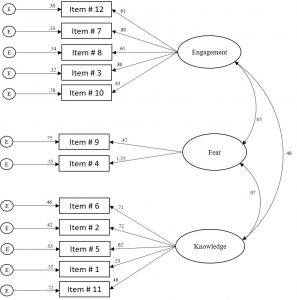
Figure 1. Confirmatory Factor Analysis Path Model for Undergraduate Student Sample (N = 312)
Faculty members. HLR analyses were computed to investigate the predictive validity of the CMHPCS (research question 3). Specifically, researchers aimed to determine the extent to which respondents’ scores on the CMHPCS predicted if they had made a referral to the counseling center. Among the sample of faculty members, the correct classification rate of the null model was 56%. The first model of gender and age was significant (χ2 = 15.80, p < 0.001) and explained 11% (Nagelkerke R2) of the variance in participants’ referrals to the counseling center. There was a statistically significant increase in the odds (Exp(B) = 1.30) of female faculty members making a student referral to the counseling center. The second LR model revealed that adding the knowledge, fear, and engagement scales significantly improved the predictability of model (χ2 = 46.61, p < 0.001) and explained 30% (Nagelkerke R2) of the variance in participants’ referrals to the counseling center. The engagement scale was a significant predictor of referrals to the counseling center. The odds ratio, Exp(B), revealed that an increase in one unit on the engagement scale was associated with an increase in the odds of making a referral to the counseling center by a factor of 3.47. The correct classification rate of this model was 71.2%.
Undergraduate students. For the sample of undergraduate students, the correct classification rate of the null model was 58%. Gender and age were entered as predictor variables in the first regression block and revealed statistical significance (χ2(1) = 9.35, p = 0.01) and explained 4.2% (Nagelkerke R2) of the variance in participants’ referrals to the counseling center. A statistically significant increase in the odds emerged (Exp(B) = 1.78) for female students having made a peer-referral to the counseling center. In the second block, the knowledge, fear, and engagement subscales of the CMHPCS were added to the regression model. The addition of the CMHPCS scales as predictor variables significantly improved the model (χ2(1) = 29.82, p < 0.001) and explained 13% (Nagelkerke R2) of the variance in participants’ referrals to the counseling center. Similar to faculty members, the engagement scale was a significant predictor of students’ referrals to the counseling center. The odds ratio, Exp(B), revealed that an increase in one unit on the engagement scale was associated with an increase in the odds of having made a referral to the counseling center by a factor of 2.10.
Discussion
The results of three major analyses provided evidence that the construct—perceived competence for promoting college student mental health—and its dimensions were estimated adequately by the CMHPCS. Feedback from expert reviewers and pilot study participants showed initial support for the content validity of the measure. The findings from the PFA and CFA provided evidence for the factorial validity of the measure. The low correlations between factors provided further support for the relative distinctiveness (discriminant validity) of each dimension. Tests of internal consistency revealed adequate support for the reliability of the measure with college students and with faculty members.
The results of the HLR models demonstrated a moderate level of predictive validity of the CMHPCS. Similar to previous investigations (e.g., Kalkbrenner & Hernández, 2017), female students in the present study were more likely to make peer-to-peer referrals to the counseling center when compared to male students. Extending previous findings, the addition of participants’ scores on the CMHPCS scale as predictor variables significantly improved the logistic regression model’s capacity to predict the odds of making a referral to the counseling center. The CMHPCS appears to be measuring a construct that is associated with greater odds of both students and faculty members supporting college student mental health (i.e., making a referral to the counseling center). In particular, higher scores on the engagement scale emerged as a significant predictor of an increase in the odds of having made a student referral to the counseling center among both faculty members and undergraduate students.
This study introduced a new theoretical dimension, perceived competence for promoting college student mental health, to the growing body of literature on the utility of SDT for supporting college student mental health. The emergent factor structure of the CMHPCS was largely consistent with key elements of SDT (Adams et al., 2017). According to the theory, individuals’ motivation for engaging in an action or behavior will be enhanced when they feel a sense of competence or self-efficacy for the activity (Adams et al., 2017; Ryan & Deci, 2000). Similarly, the emergent factor of knowledge on the CMHPCS (i.e., the extent to which one is familiar or knowledgeable with mental health issues on campus) is consistent with research on the personal competency component of SDT. Weber and Koehler (2017), for example, found a moderate, positive association between respondents’ knowledge and perceived competence. Similarly, in the present study, knowledge emerged as a factor of perceived competence (i.e., one who is more knowledgeable about college student mental health has a higher level of perceived competence for supporting college student mental health). Autonomy and relatedness also are central components of SDT, as individuals’ intrinsic motivation is enhanced when their behaviors are active and self-determined (Adams et al., 2017; Jeno & Diseth, 2014). Finally, the engagement scale on the CMHPCS reflects the extent to which one is actively involved with supporting college student mental health. One who is more engaged with supporting college student mental health has a higher level of perceived competence for supporting college student mental health.
The relationship between the path coefficients (see Figure 1) provided further support that the CMHPCS is largely consistent with SDT. The path coefficients were stronger between the engagement and knowledge scales (0.48) than they were with the fear scale—0.05 and 0.07, respectively. According to the theory, intrinsic motivation toward wellness generally increases when individuals are competent (knowledgeable) and related (engaged) to a person or activity (Patrick & Williams, 2012). Thus, it was not surprising that the strongest association between the three factors (knowledge, fear, and engagement) emerged between the knowledge and engagement subscales. There are complex associations between fear and one’s level of motivation (Halkjelsvik & Rise, 2015). Some researchers demonstrated that higher levels of respondent fear were associated with higher levels of motivation (e.g., motivation for smoking cessation; Farrelly et al., 2012). However, in other investigations, anxiety elicited the opposite response in participants, substantially decreasing their motivation (Halkjelsvik & Rise, 2015). Considering the complex connection between motivation and fear, it is possible in the present study that participants’ fear of mental health issues on college campuses was associated with ambivalence in their engagement. Fear may motivate students to support a peer experiencing mental distress. In other situations, fear might lead to students avoiding a peer in mental distress. While future research is needed to investigate these issues, there is sufficient statistical (EFA and CFA) and conceptual evidence to retain the fear scale.
To summarize, the theoretical construct underlying CMHPCS, which was designed to measure perceived competence toward promoting college student mental health, reflects aspects of SDT. Individuals with high levels of perceived competence for promoting college student mental health appear to be knowledgeable about, unfearful of, and engaged with supporting students who are living with mental health issues. At this stage of development, the CMHPCS has potential to enhance the practice of college counseling.
Implications for the Profession
Considering the rise in college counselors’ roles and responsibilities with outreach and consultation (Brunner et al., 2014; Sharkin, 2012), the CMHPCS can assist college counselors with these activities. Specifically, the CMHPCS can be used by college counselors to provide a baseline measure of perceived competence for promoting mental health on campus among students and faculty members. The questionnaire can be administered and scored as a holistic measure (total score), as an overall measure, or as three separate dimensions (subscales) of students and/or faculty members’ perceived competence for promoting mental health on campus. On a practical level, the CMHPCS has utility for college counselors when participating in new student and new faculty orientations due to the brevity (12 items) and versatility (use with faculty and student populations) of the measure. The results might provide college counselors with valuable baseline information on new students and faculty members’ perceived competence toward supporting college student mental health and aid in structuring the content of educational sessions for recognizing and referring students to the counseling center.
Brunner et al. (2014) identified supporting referral agents through consultation as another key aspect in the practice of college counseling. The findings presented above demonstrated that higher scores on the engagement scale predicted a greater likelihood in the odds of student referrals to the counseling center among both students and faculty members. This outcome can inform college counselors’ outreach and consultation efforts. Specifically, it is recommended that college counselors focus on increasing university community members’ knowledge and engagement with supporting college student mental health. Advocacy efforts can be directed toward implementing training sessions for faculty members and students for recognizing warning signs of mental health disorders in college students and connecting trainees to resources for mental health disorders. The CMHPCS can be used as a pretest/posttest measure to provide information about the extent to which trainings and mental health support resources are useful for promoting perceived competence for supporting college student mental health. For example, the REDFLAGS Model, an acronym of common warning signs of mental health disorders in college students (Kalkbrenner, 2016), and the National Suicide Prevention Lifeline’s wallet cards (National Suicide Prevention Lifeline, 2008) are resources for increasing university community members’ awareness of warning signs of mental health disorders in college students. The CMHPCS could be implemented to assess the value of these resources.
Limitations and Future Research
Although results of the current study were promising, the research caveats should be considered. First, self-report measures can sometimes generate response biases influenced by the respondent’s need for social desirability. Second, the 2-item fear scale is not ideal. Although dimensions composed of few items often generate lower reliability coefficients, there is no absolute threshold for the minimum number of items necessary to comprise a scale (Fowler, 2014). Given the CMHPCS’s stage of development, the researchers chose to retain the dimension. The strong reliability coefficient of the fear subscale (α = .83, student sample and α = .80, faculty sample) exceeded the threshold for acceptable internal consistency reliability. The overall scale is also stronger with the fear scale items included. Finally, it should be noted that other validated instruments in social sciences research have scales comprised of two items (Luecht, Madsen, Taugher, & Petterson, 1990), suggesting that the fear scale may be useful.
The demographic profile of faculty in our sample was consistent with the ethnic identities of the larger university and with a national sample of faculty members (Myers, 2016). However, the homogeneity of ethnicity among faculty participants still might have affected the generalizability of our findings. Most faculty participants (81%, n = 162) identified as Caucasian or White. It is recommended that future researchers confirm the factor structure of the CMHPCS with an ethnically diverse sample of faculty members. Subsequent investigation should examine the goodness-of-fit of the CMHPCS with different populations of college students and faculty members. Specifically, the following sub-groups of college students appear to be especially susceptible to mental health disorders: first-generation college students, community college students, students enrolled in Greek life organizations, international students, and male students (Dobmeier et al., 2013; Eisenberg et al., 2011).
Conclusion
The professional identity of college counselors has grown to include outreach and consultation with counseling referral agents as key components in the contemporary practice of college counseling (Brunner et al., 2014; Sharkin, 2012). The multidimensional aim of the present study was to establish the validity and reliability of the CMHPCS, a newly developed questionnaire designed to measure college student and faculty members’ perceived competence for promoting college student mental health. To do so, the measure was subjected to rigorous psychometric testing (EFA and CFA). A 3-factor model (knowledge, fear, and engagement) emerged from the data. Initial support for the reliability and factorial validity of the instrument was reported. A series of two HLR analyses reinforced, in part, the predictive validity of the measure. The brief nature of the CMHPCS coupled with its adequate reliability and coherent factor structure suggests the measure might have utility for supporting and enhancing the consultation and outreach activities of college counseling practitioners. For instance, the CMHPCS can be carefully utilized as a screening measure for students to enhance the practice (outreach, education, and consultation) of college counselors. The instrument also is perhaps useful as a pretest/posttest measure in outcome research aimed at assessing mental health support interventions among college students.
Conflict of Interest and Funding Disclosure
The authors reported no conflict of interest or funding contributions for the development of this manuscript.
References
Adams, N., Little T. D., & Ryan, R. M. (2017). Self-determination theory. In M. L. Wehmeyer, K. A. Shogren, T. D. Little, & S. J. Lopez (Eds.), Development of self-determination through the life-course (pp. 47–54). Dordrecht, Netherlands: Springer.
Albright, G., & Schwartz, V. (2017). Are campuses ready to support students in distress? Retrieved from https://www.jedfoundation.org/wp-content/uploads/2017/10/Kognito-JED-Are-Campuses-Ready-to-Support-Students-in-Distress.pdf
Bishop, K. K. (2016). The relationship between retention and college counseling for high-risk students. Journal of College Counseling, 19, 205–217. doi:10.1002/jocc.12044
Box, G. E. P., & Tidwell, P. W. (1962). Transformation of the independent variables. Technometrics, 4, 531–550. doi:10.2307/1266288
Brockelman, K. F., & Scheyett, A. M. (2015). Faculty perceptions of accommodations, strategies, and psychiatric advance directives for university students with mental illnesses. Psychiatric Rehabilitation Journal, 38, 342–348. doi:10.1037/prj0000143
Brunner, J. L., Wallace, D. L., Reymann, L. S., Sellers, J.-J., & McCabe, A. G. (2014). College counseling today: Contemporary students and how counseling centers meet their needs. Journal of College Student Psychotherapy, 28, 257–324. doi:10.1080/87568225.2014.948770
Byrne, B. M. (2016). Structural equation modeling with AMOS: Basic concepts, applications, and programming (3rd ed.). New York, NY: Routledge.
de Lijster, J. M., Dierckx, B., Utens, E. M. W. J., Verhulst, F. C., Zieldorff, C., Dieleman, G. C., & Legerstee,
J. S. (2017). The age of onset of anxiety disorders: A meta-analysis. The Canadian Journal of Psychiatry / La Revue Canadienne De Psychiatrie, 62, 237–246. doi:10.1177/0706743716640757
DeVellis, R. F. (2016). Scale development: Theory and applications (4th ed.). Thousand Oaks, CA: Sage.
Dobmeier, R. A., Kalkbrenner, M. T., Hill, T. T., & Hernández, T. J. (2013). Residential community college student awareness of mental health problems and resources. CSPA-NYS Journal, 13(2), 15–28. Retrieved from http://journals.canisius.edu/index.php/CSPANY/article/viewFile/331/500
Emery, A. A., Heath, N. L., & Mills, D. J. (2016). Basic psychological need satisfaction, emotion dysregulation, and non-suicidal self-injury engagement in young adults: An application of self-determination theory. Journal of Youth & Adolescence, 45, 612–623. doi:10.1007/s10964-015-0405
Eisenberg, D., Goldrick-Rabe, S., Lipson, S. K., & Broton, K. (2016). Too distressed to learn? Mental health among community college students. Retrieved from http://www.wihopelab.com/publications/Wisconsin_HOPE_Lab-Too_Distressed_To_Learn.pdf
Eisenberg, D., Hunt, J., Speer, N., & Zivin, K. (2011). Mental health service utilization among college students in the United States. Journal of Nervous and Mental Disease, 199, 301–308.
doi:10.1097/NMD.0b013e318217512
Farrelly, M. C., Duke, J. C., Davis, K. C., Nonnemaker, J. M., Kamyab, K., Willett, J. G., & Juster, H. R. (2012). Promotion of smoking cessation with emotional and/or graphic antismoking advertising. American Journal of Preventive Medicine, 43, 475–482. doi:10.1016/j.amepre.2012.07.023
Faul, F., Erdfelder, E., Lang, A.-G., & Buchner, A. (2007). G*Power 3: A flexible statistical power analysis program for the social, behavioral, and biomedical sciences. Behavior Research Methods, 39, 175–191. doi:10.3758/BF03193146
Field, A. P. (2018). Discovering statistics using IBM SPSS Statistics (5th ed.). Thousand Oaks, CA: Sage.
Fowler, F. J. (2014). Survey research methods (5th ed.). Thousand Oaks, CA: Sage.
Halkjelsvik, T., & Rise, J. (2015). Disgust in fear appeal anti-smoking advertisements: The effects on attitudes and abstinence motivation. Drugs: Education, Prevention and Policy, 22, 362–369.
doi:10.3109/09687637.2015.1015491
Han, M., & Pong, H. (2015). Mental health help-seeking behaviors among Asian American community college
students: The effect of stigma, cultural barriers, and acculturation. Journal of College Student
Development, 56, 1–14. doi:10.1353/csd.2015.0001
Hill, R. M., Yaroslavsky, I., & Pettit, J. W. (2015). Enhancing depression screening to identify college students at
risk for persistent depressive symptoms. Journal of Affective Disorders, 174, 1–6.
doi:10.1016/j.jad.2014.11.025
Jeno, L. M., & Diseth, Å. (2014). A self-determination theory perspective on autonomy support, autonomous self-regulation, and perceived school performance. Reflecting Education, 9, 1–20.
Kalkbrenner, M. T. (2016). Recognizing and supporting students with mental disorders: The REDFLAGS
Model. Journal of Education and Training, 3, 1–13. doi:10.5296/jet.v3i1.8141
Kalkbrenner, M. T., & Hernández, T. J. (2017). Community college students’ awareness of risk factors for
mental health problems and referrals to facilitative and debilitative resources. The Community College
Journal of Research and Practice, 41, 56–64. doi:10.1080/10668926.2016.1179603
Kalkbrenner, M. T., James, C., & Pérez-Rojas, A. E. (2018). College students’ awareness of mental disorders and counselor seeking behaviors: Comparison across academic disciplines. Journal of College Student Psychotherapy. Manuscript submitted for publication.
Lee, H. J., Ju, Y. J., & Park, E.-C. (2017). Utilization of professional mental health services according to recognition rate of mental health centers. Psychiatry Research, 250, 204–209.
doi:10.1016/j.psychres.2017.01.051
Li, J., Marbley, A. F., Bradley, L. J., & Lan, W. (2016). Attitudes toward seeking professional counseling services among Chinese international students: Acculturation, ethnic identity, and English proficiency. Journal of Multicultural Counseling and Development, 44, 65–76. doi:10.1002/jmcd.12037
Luecht, R. M., Madsen, M. K., Taugher, M. P., & Petterson, B. J. (1990). Assessing professional perceptions: Design and validation of an interdisciplinary education perception scale. Journal of Allied Health, 19(2), 181–191.
Mancini, A. D. (2008). Self-determination theory: A framework for the recovery paradigm. Advances in Psychiatric Treatment, 14, 358–365. doi:10.1192/apt.bp.107.004036
Marsh, C. N., & Wilcoxon, S. A. (2015). Underutilization of mental health services among college students: An examination of system-related barriers. Journal of College Student Psychotherapy, 29, 227–243.
doi:10.1080/87568225.2015.1045783
Myers, B. (2016). Where are the minority professors? The Chronical of Higher Education. Retrieved from https://www.chronicle.com/interactives/where-are-the-minority-professors
Mvududu, N. H., & Sink, C. A. (2013). Factor analysis in counseling research and practice. Counseling Outcome Research and Evaluation, 4(2), 75–98. doi:10.1177/2150137813494766
National Suicide Prevention Lifeline. (2008). Having trouble coping? With help comes hope. Retrieved from https://store.samhsa.gov/product/National-Suicide-Prevention-Lifeline-Wallet-Card-Having-Trouble-Coping-With-Help-Comes-Hope-/SVP13-0155R
Ntoumanis, N. (2005). A prospective study of participation in optional school physical education using a self-determination theory framework. Journal of Educational Psychology, 97, 444–453.
doi:10.1037/0022-0663.97.3.444
Patrick, H., & Williams, G. C. (2012). Self-determination theory: Its application to health behavior and complementarity with motivational interviewing. The International Journal of Behavioral Nutrition and Physical Activity, 9, 1–12. doi:10.1186/1479-5868-9-18
Piltch, C. A. (2016). The role of self-determination in mental health recovery. Psychiatric Rehabilitation Journal, 39, 77–80. doi:10.1037/prj0000176
Qualtrics [Online survey platform software]. (2017). Provo, UT, USA. Retrieved from https://www.qualtrics.com/
Rosenthal, B. S., & Wilson, W. C. (2016). Psychosocial dynamics of college students’ use of mental health services. Journal of College Counseling, 19, 194–204. doi:10.1002/jocc.12043
Ryan, R. M., & Connell, J. P. (1989). Perceived locus of causality and internalization: Examining reasons for acting in two domains. Journal of Personality and Social Psychology, 57, 749–761.
Ryan, R. M., & Deci, E. L. (2000). Self-determination theory and the facilitation of intrinsic motivation, social development, and well-being. American Psychologist, 55, 68–78. doi:10.1037/0003-066X.55.1.68
Ryan, R. M., Lynch, M. F., Vansteenkiste, M., & Deci, E. L. (2011). Motivation and autonomy in counseling, psychotherapy, and behavior change: A look at theory and practice. The Counseling Psychologist, 39(2), 193–260. doi: 10.1177/0011000009359313
Sharkin, B. S. (2012). Being a college counselor on today’s campus: Roles, contributions, and special challenges. New York, NY: Routledge Taylor & Francis Group.
Weber, M., & Koehler, C. (2017). Illusions of knowledge: Media exposure and citizens’ perceived political competence. International Journal of Communication, 11(2017), 2387–2410.
Wei, Y., McGrath, P. J., Hayden, J., & Kutcher, S. (2015). Mental health literacy measures evaluating knowledge, attitudes and help-seeking: A scoping review. BMC Psychiatry, 15, 1–20. doi:10.1186/s12888-015-0681-9
White, S., Park, Y. S., Israel, T., & Cordero, E. D. (2009). Longitudinal evaluation of peer health education on a college campus: Impact on health behaviors. Journal of American College Health, 57, 497–505.
doi:10.3200/JACH.57.5.497-506
Williams, A. E., & Greene, C. A. (2016). Creating change through connections: A group for college women experiencing alcohol-related consequences. Journal of Creativity in Mental Health, 11, 90–104.
doi:10.1080/15401383.2015.1110509
Williams, G. C., & Deci, E. L. (1996). Internalization of biopsychosocial values by medical students: A test of self-determination theory. Journal of Personality and Social Psychology, 70, 767–779.
Yorgason, J. B., Linville, D., & Zitzman, B. (2008). Mental health among college students: Do those who need services know about and use them? Journal of American College Health, 57(2), 173–182.
doi:10.3200/JACH.57.2.173-182
Michael T. Kalkbrenner, NCC, is an assistant professor at New Mexico State University. Christopher A. Sink, NCC, is a professor and Batten Chair at Old Dominion University. Correspondence can be addressed to Michael Kalkbrenner, 1780 E. University Ave., Las Cruces, NM 88003, mkalk001@nmsu.edu.