Aug 20, 2021 | Volume 11 - Issue 3
Michael T. Kalkbrenner
Assessment literacy is an essential competency area for professional counselors who administer tests and interpret the results of participants’ scores. Using factor analysis to demonstrate internal structure validity of test scores is a key element of assessment literacy. The underuse of psychometrically sound instrumentation in professional counseling is alarming, as a careful review and critique of the internal structure of test scores is vital for ensuring the integrity of clients’ results. A professional counselor’s utilization of instrumentation without evidence of the internal structure validity of scores can have a number of negative consequences for their clients, including misdiagnoses and inappropriate treatment planning. The extant literature includes a series of articles on the major types and extensions of factor analysis, including exploratory factor analysis, confirmatory factor analysis (CFA), higher-order CFA, and multiple-group CFA. However, reading multiple psychometric articles can be overwhelming for professional counselors who are looking for comparative guidelines to evaluate the validity evidence of scores on instruments before administering them to clients. This article provides an overview for the layperson of the major types and extensions of factor analysis and can serve as reference for professional counselors who work in clinical, research, and educational settings.
Keywords: Factor analysis, overview, professional counseling, internal structure, validity
Professional counselors have a duty to ensure the veracity of tests before interpreting the results of clients’ scores because clients rely on their counselors to administer and interpret the results of tests that accurately represent their lived experience (American Educational Research Association [AERA] et al., 2014; National Board for Certified Counselors [NBCC], 2016). Internal structure validity of test scores is a key assessment literacy area and involves the extent to which the test items cluster together and represent the intended construct of measurement.
Factor analysis is a method for testing the internal structure of scores on instruments in professional counseling (Kalkbrenner, 2021b; Mvududu & Sink, 2013). The rigor of quantitative research, including psychometrics, has been identified as a weakness of the discipline, and instrumentation with sound psychometric evidence is underutilized by professional counselors (Castillo, 2020; C.-C. Chen et al., 2020; Mvududu & Sink, 2013; Tate et al., 2014). As a result, there is an imperative need for assessment literacy resources in the professional counseling literature, as assessment literacy is a critical competency for professional counselors who work in clinical, research, and educational settings alike.
Assessment Literacy in Professional Counseling
Assessment literacy is a crucial proficiency area for professional counselors, as counselors in a variety of the specialty areas of the Council for Accreditation of Counseling and Related Educational Programs (2015), such as clinical rehabilitation (5.D.1.g. & 5.D.3.a.), clinical mental health (5.C.1.e. & 5.C.3.a.), and addiction (5.A.1.f. & 5.A.3.a.), select and administer tests to clients and use the results to inform diagnosis and treatment planning, and to evaluate the utility of clinical interventions (Mvududu & Sink, 2013; NBCC, 2016; Neukrug & Fawcett, 2015). The extant literature includes a series of articles on factor analysis, including exploratory factor analysis (EFA; Watson, 2017), confirmatory factor analysis (CFA; Lewis, 2017), higher-order CFA (Credé & Harms, 2015), and multiple-group CFA (Dimitrov, 2010). However, reading several articles on factor analysis is likely to overwhelm professional counselors who are looking for a desk reference and/or comparative guidelines to evaluate the validity evidence of scores on instruments before administering them to clients. To these ends, professional counselors need a single resource (“one-stop shop”) that provides a brief and practical overview of factor analysis. The primary purpose of this manuscript is to provide an overview for the layperson of the major types and extensions of factor analysis that counselors can use as a desk reference.
Construct Validity and Internal Structure
Construct validity, the degree to which a test measures its intended theoretical trait, is a foundation of assessment literacy for demonstrating validity evidence of test scores (Bandalos & Finney, 2019). Internal structure validity, more specifically, is an essential aspect of construct validity and assessment literacy. Internal structure validity is vital for determining the extent to which items on a test combine to represent the construct of measurement (Bandalos & Finney, 2019). Factor analysis is a key method for testing the internal structure of scores on instruments in professional counseling as well as in social sciences research in general (Bandalos & Finney, 2019; Kalkbrenner, 2021b; Mvududu & Sink, 2013). In the following sections, I will provide a practical overview of the two primary methodologies of factor analysis (EFA and CFA) as well as the two main extensions of CFA (higher-order CFA and multiple-group CFA). These factor analytic techniques are particularly important elements of assessment literacy for professional counselors, as they are among the most common psychometric analyses used to validate scores on psychological screening tools (Kalkbrenner, 2021b). Readers might find it helpful to refer to Figure 1 before reading further to become familiar with some common psychometric terms that are discussed in this article and terms that also tend to appear in the measurement literature.
Figure 1
Technical and Layperson’s Definitions of Common Psychometric Terms
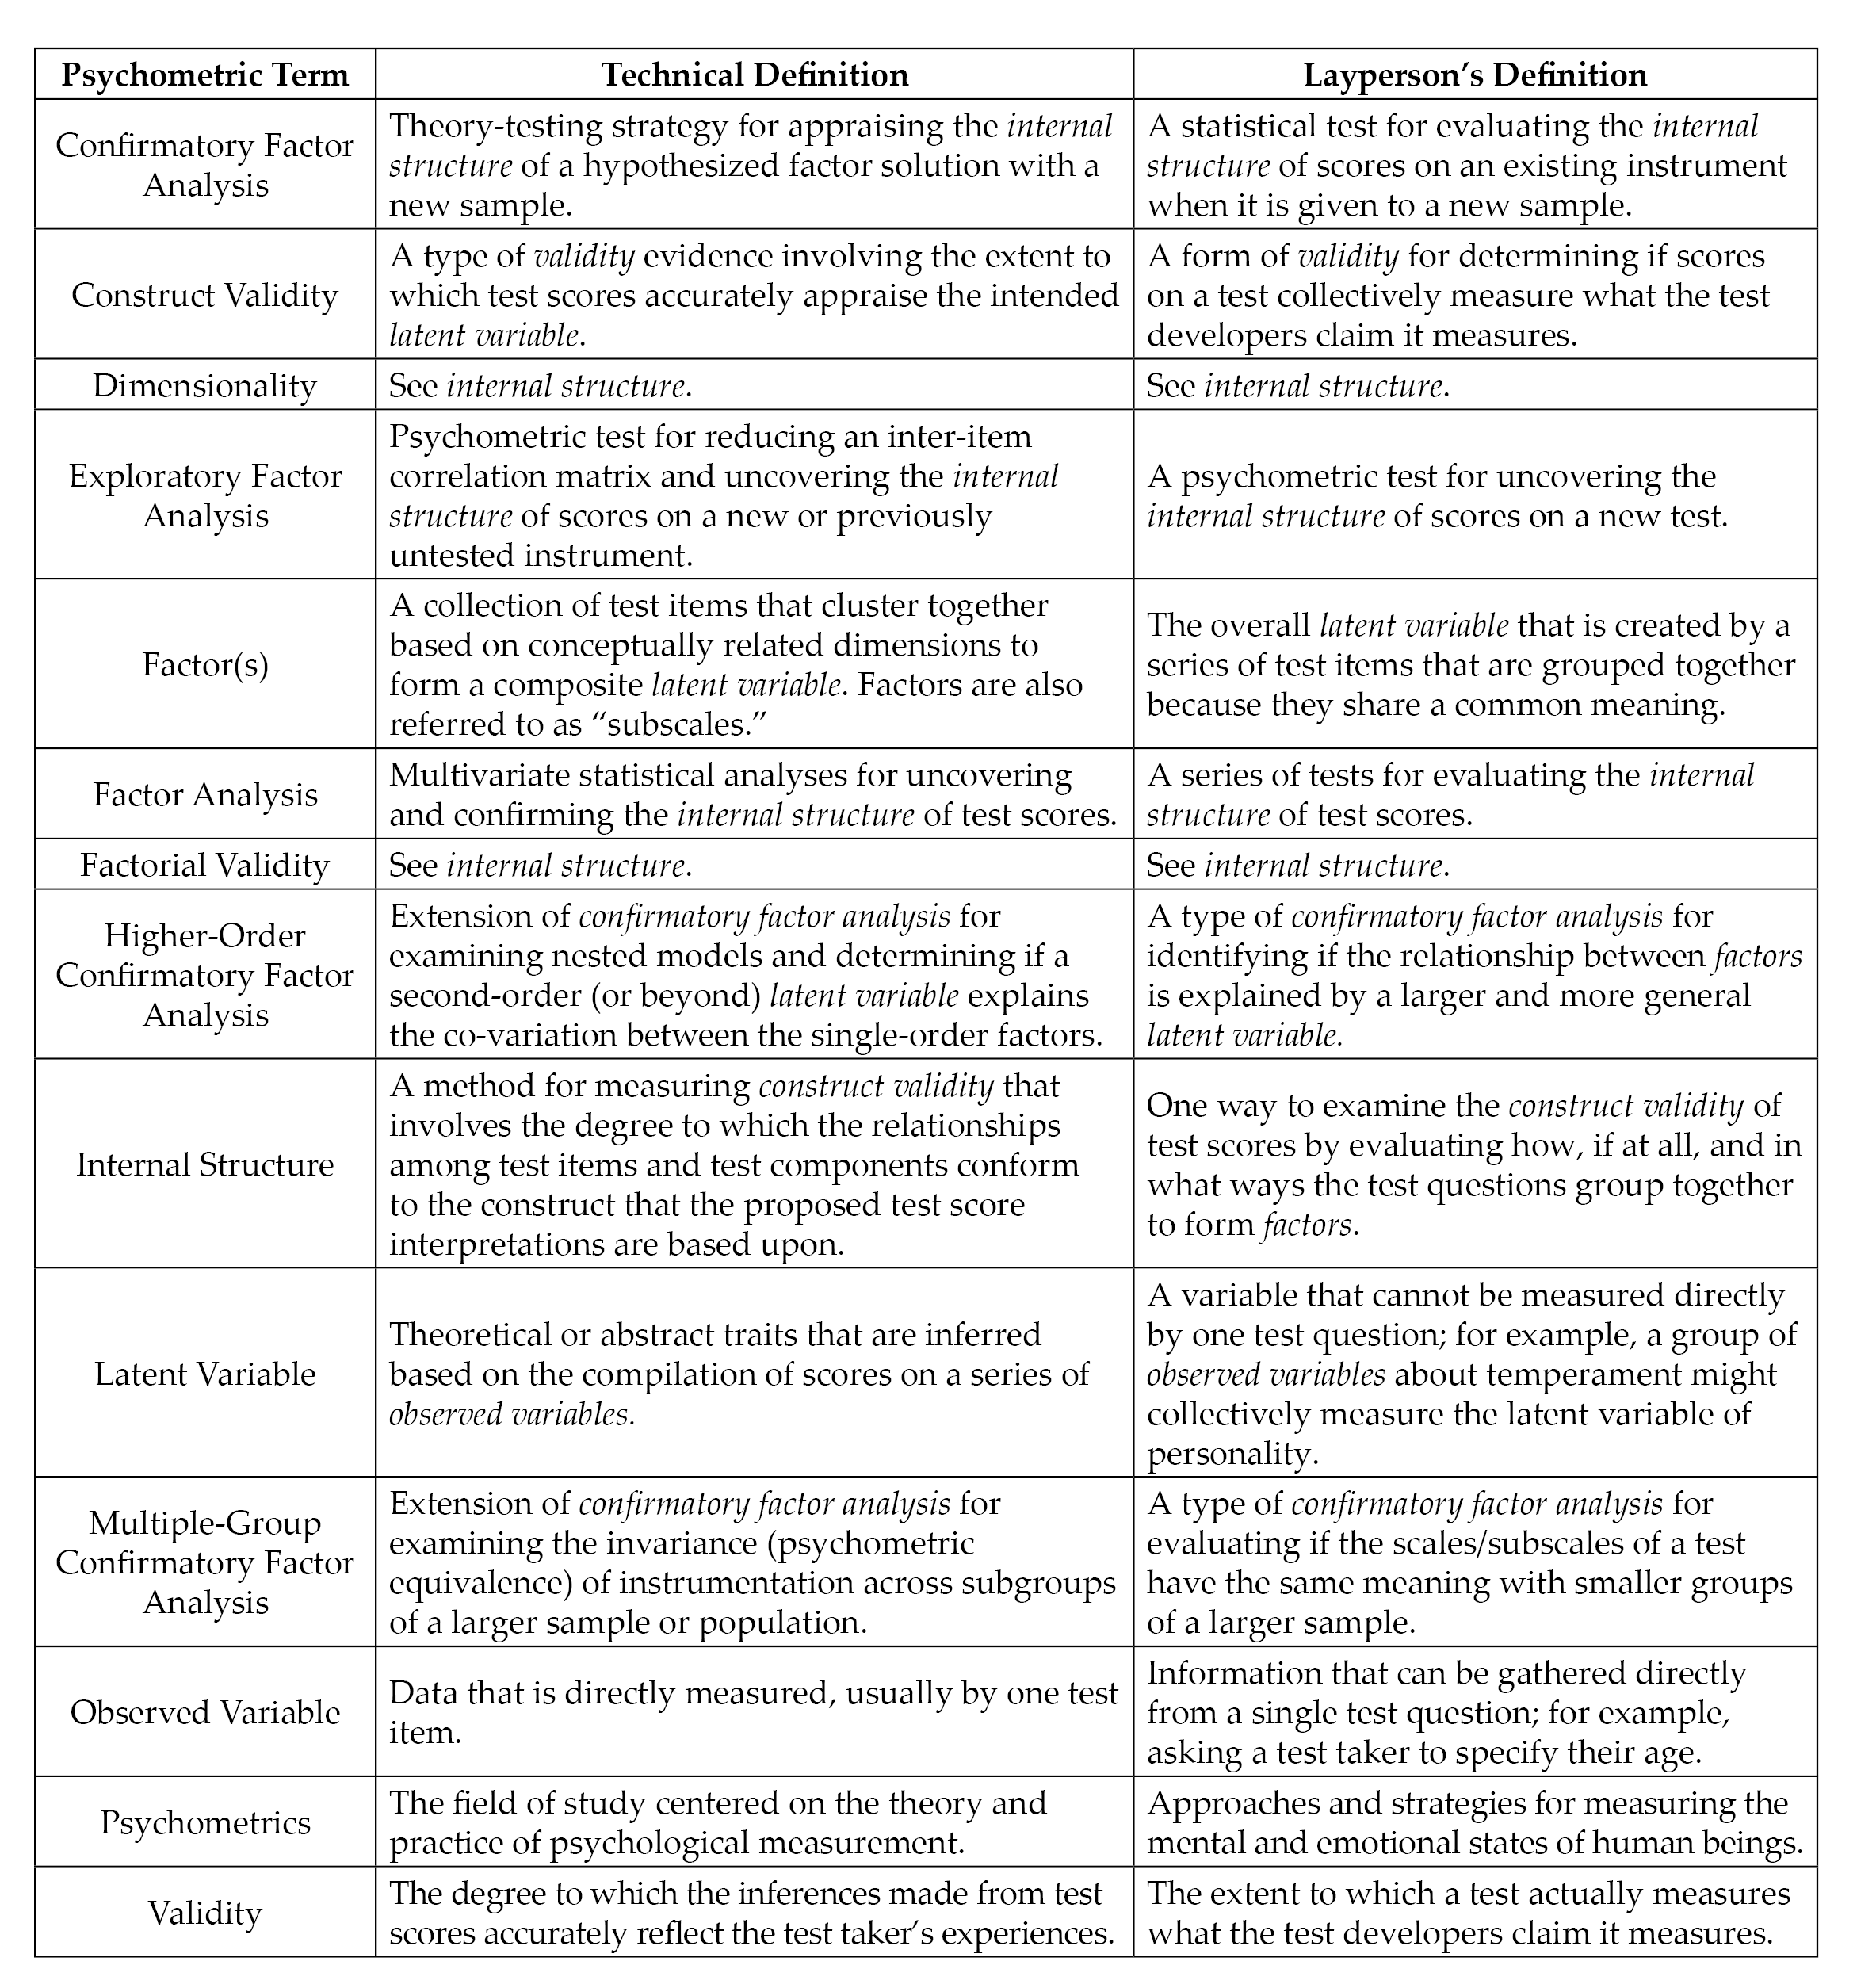 Note. Italicized terms are defined in this figure.
Exploratory Factor Analysis
EFA is “exploratory” in that the analysis reveals how, if at all, test items band together to form factors or subscales (Mvududu & Sink, 2013; Watson, 2017). EFA has utility for testing the factor structure (i.e., how the test items group together to form one or more scales) for newly developed or untested instruments. When evaluating the rigor of EFA in an existing psychometric study or conducting an EFA firsthand, counselors should consider sample size, assumption checking, preliminary testing, factor extraction, factor retention, factor rotation, and naming rotated factors (see Figure 2).
EFA: Sample Size, Assumption Checking, and Preliminary Testing
Researchers should carefully select the minimum sample size for EFA before initiating data collection (Mvududu & Sink, 2013). My 2021 study (Kalkbrenner, 2021b) recommended that the minimal a priori sample size for EFA include either a subjects-to-variables ratio (STV) of 10:1 (at least 10 participants for each test item) or 200 participants, whichever produces a larger sample. EFA tends to be robust to moderate violations of normality; however, results are enriched if data are normally distributed (Mvududu & Sink, 2013). A review of skewness and kurtosis values is one way to test for univariate normality; according to Dimitrov (2012), extreme deviations from normality include skewness values > ±2 and kurtosis > ±7; however, ideally these values are ≤ ±1 (Mvududu & Sink, 2013). The Shapiro-Wilk and Kolmogorov-Smirnov tests can also be computed to test for normality, with non-significant p-values indicating that the parametric properties of the data are not statistically different from a normal distribution (Field, 2018); however, the Shapiro-Wilk and Kolmogorov-Smirnov tests are sensitive to large sample sizes and should be interpreted cautiously. In addition, the data should be tested for linearity (Mvududu & Sink, 2013). Furthermore, extreme univariate and multivariate outliers must be identified and dealt with (i.e., removed, transformed, or winsorized; see Field, 2018) before a researcher can proceed with factor analysis. Univariate outliers can be identified via z-scores (> 3.29), box plots, or scatter plots, and multivariate outliers can be discovered by computing Mahalanobis distance (see Field, 2018).
Figure 2
Flow Chart for Reviewing Exploratory Factor Analysis
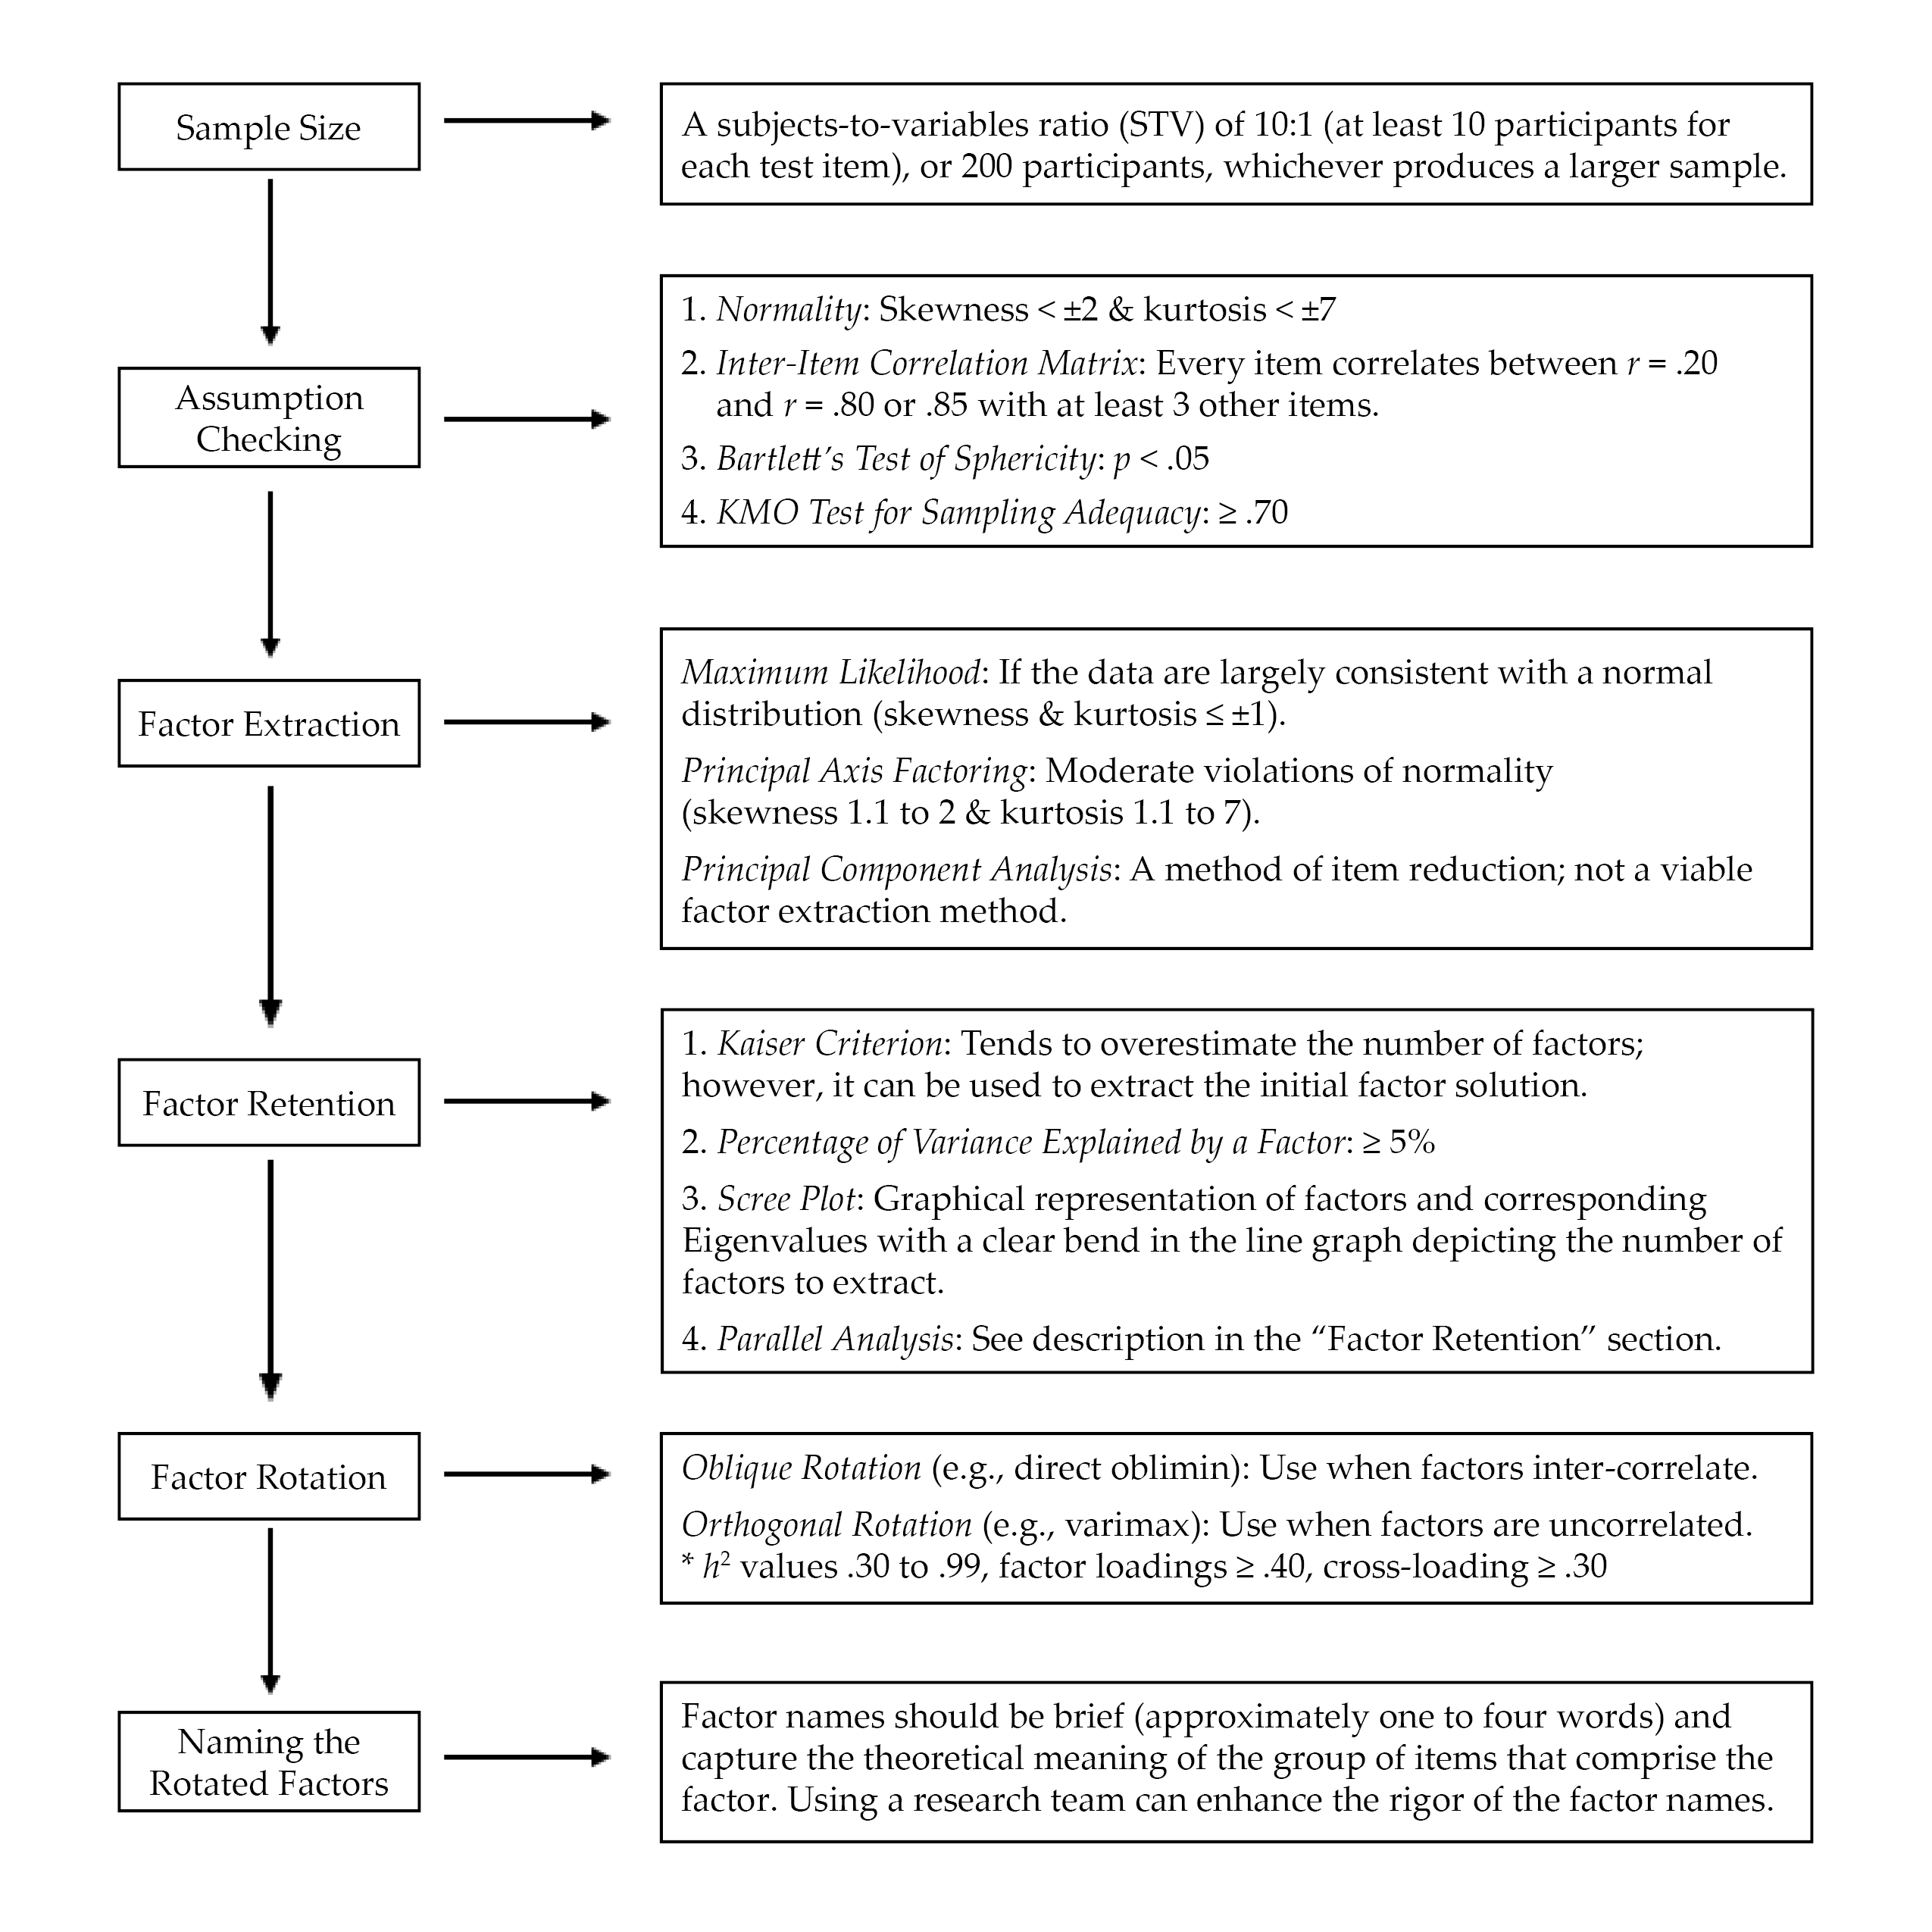
Three preliminary tests are necessary to determine if data are factorable, including (a) an inter-item correlation matrix, (b) the Kaiser–Meyer–Olkin (KMO) test for sampling adequacy, and (c) Bartlett’s test of sphericity (Beavers et al., 2013; Mvududu & Sink, 2013; Watson, 2017). The purpose of computing an inter-item correlation matrix is to identify redundant items (highly correlated) and individual items that do not fit with any of the other items (weakly correlated). An inter-item correlation matrix is factorable if a number of correlation coefficients for each item are between approximately r = .20 and r = .80 or .85 (Mvududu & Sink, 2013; Watson, 2017). Generally, a factor or subscale should be composed of at least three items (Mvududu & Sink, 2013); thus, an item should display intercorrelations between r = .20 and r = .80/.85 with at least three other items. However, inter-item correlations in this range with five to 10+ items are desirable (depending on the total number of items in the inter-item correlation matrix).
Bartlett’s test of sphericity is computed to test if the inter-item correlation matrix is an identity matrix, in which the correlations between the items is zero (Mvududu & Sink, 2013). An identity matrix is completely unfactorable (Mvududu & Sink, 2013); thus, desirable findings are a significant p-value, indicating that the correlation matrix is significantly different from an identity matrix. Finally, before proceeding with EFA, researchers should compute the KMO test for sampling adequacy, which is a measure of the shared variance among the items in the correlation matrix (Watson, 2017). Kaiser (1974) suggested the following guidelines for interpreting KMO values: “in the .90s – marvelous, in the .80s – meritorious, in the .70s – middling, in the .60s – mediocre, in the .50s – miserable, below .50 – unacceptable” (p. 35).
Factor Extraction Methods
Factor extraction produces a factor solution by dividing up shared variance (also known as common variance) between each test item from its unique variance, or variance that is not shared with any other variables, and error variance, or variation in an item that cannot be accounted for by the factor solution (Mvududu & Sink, 2013). Historically, principal component analysis (PCA) was the dominant factor extraction method used in social sciences research. PCA, however, is now considered a method of data reduction rather than an approach to factor analysis because PCA extracts all of the variance (shared, unique, and error) in the model. Thus, although PCA can reduce the number of items in an inter-item correlation matrix, one cannot be sure if the factor solution is held together by shared variance (a potential theoretical model) or just by random error variance.
More contemporary factor extraction methods that only extract shared variance—for example, principal axis factoring (PAF) and maximum likelihood (ML) estimation methods—are generally recommended for EFA (Mvududu & Sink, 2013). PAF has utility if the data violate the assumption of normality, as PAF is robust to modest violations of normality (Mvududu & Sink, 2013). If, however, data are largely consistent with a normal distribution (skewness and kurtosis values ≤ ±1), researchers should consider using the ML extraction method. ML is advantageous, as it computes the likelihood that the inter-item correlation matrix was acquired from a population in which the extracted factor solution is a derivative of the scores on the items (Watson, 2017).
Factor Retention. Once a factor extraction method is deployed, psychometric researchers are tasked with retaining the most parsimonious (simple) factor solution (Watson, 2017), as the purpose of factor analysis is to account for the maximum proportion of variance (ideally, 50%–75%+) in an inter-item correlation matrix while retaining the fewest possible number of items and factors (Mvududu & Sink, 2013). Four of the most commonly used criteria for determining the appropriate number of factors to retain in social sciences research include the (a) Kaiser criterion, (b) percentage of variance among items explained by each factor, (c) scree plot, and (d) parallel analysis (Mvududu & Sink, 2013; Watson, 2017). Kaiser’s criterion is a standard for retaining factors with Eigenvalues (EV) ≥ 1. An EV represents the proportion of variance that is explained by each factor in relation to the total amount of variance in the factor matrix.
The Kaiser criterion tends to overestimate the number of retainable factors; however, this criterion can be used to extract an initial factor solution (i.e., when computing the EFA for the first time). Interpreting the percentage of variance among items explained by each factor is another factor retention criterion based on the notion that a factor must account for a large enough percentage of variance to be considered meaningful (Mvududu & Sink, 2013). Typically, a factor should account for at least 5% of the variance in the total model. A scree plot is a graphical representation or a line graph that depicts the number of factors on the X-axis and the corresponding EVs on the Y-axis (see Figure 6 in Mvududu & Sink, 2013, p. 87, for a sample scree plot). The cutoff for the number of factors to retain is portrayed by a clear bend in the line graph, indicating the point at which additional factors fail to contribute a substantive amount of variance to the total model. Finally, in a parallel analysis, EVs are generated from a random data set based on the number of items and the sample size of the real (sample) data. The factors from the sample data with EVs larger than the EVs from the randomly generated data are retained based on the notion that these factors explain more variance than would be expected by random chance. In some instances, these four criteria will reveal different factor solutions. In such cases, researchers should retain the simplest factor solution that makes both statistical and substantive sense.
Factor Rotation. After determining the number of factors to retain, researchers seek to uncover the association between the items and the factors or subscales (i.e., determining which items load on which factors) and strive to find simple structure or items with high factor loadings (close to ±1) on one factor and low factor loadings (near zero) on the other factors (Watson, 2017). The factors are rotated on vectors to enhance the readability or detection of simple structure (Mvududu & Sink, 2013). Orthogonal rotation methods (e.g., varimax, equamax, and quartimax) are appropriate when a researcher is measuring distinct or uncorrelated constructs of measurement. However, orthogonal rotation methods are rarely appropriate for use in counseling research, as counselors almost exclusively appraise variables that display some degree of inter-correlation (Mvududu & Sink, 2013). Oblique rotation methods (e.g., direct oblimin and promax) are generally more appropriate in counseling research, as they allow factors to inter-correlate by rotating the data on vectors at angles less than 90○. The nature of oblique rotations allows the total variance accounted for by each factor to overlap; thus, the total variance explained in a post–oblique rotated factor solution can be misleading (Bandalos & Finney, 2019). For example, the total variance accounted for in a post–oblique rotated factor solution might add up to more than 100%. To this end, counselors should report the total variance explained by the factor solution before rotation as well as the sum of each factor’s squared structure coefficient following an oblique factor rotation.
Following factor rotation, researchers examine a number of factor retention criteria to determine the items that load on each factor (Watson, 2017). Commonality values (h2) represent the proportion of variance that the extracted factor solution explains for each item. Items with h2 values that range between .30 and .99 should be retained, as they share an adequate amount of shared variance with the other items and factors (Watson, 2017). Items with small h2 values (< .30) should be considered for removal. However, commonality values should not be too high (≥ 1), as this suggests one’s sample size was insufficient or too many factors were extracted (Watson, 2017). Items with problematic h2 values should be removed one at a time, and the EFA should be re-computed after each removal because these values will fluctuate following each deletion. Oblique factor rotation methods produce two matrices, including the pattern matrix, which displays the relationship between the items and a factor while controlling for the items’ association with the other factors, and the structure matrix, which depicts the correlation between the items and all of the factors (Mvududu & Sink, 2013). Researchers should examine both the pattern and the structure matrices and interpret the one that displays the clearest evidence of simple structure with the least evidence of cross-loadings.
Items should display a factor loading of at least ≥ .40 (≥ .50 is desirable) to mark a factor. Items that fail to meet a minimum factor loading of ≥ .40 should be deleted. Cross-loading is evident when an item displays factor loadings ≥ .30 to .35 on two or more factors (Beavers et al., 2013; Mvududu & Sink, 2013; Watson, 2017). Researchers may elect to assign a variable to one factor if that item’s loading is .10 higher than the next highest loading. Items that cross-load might also be deleted. Once again, items should be deleted one at a time and the EFA should be re-computed after each removal.
Naming the Rotated Factors
The final step in EFA is naming the rotated factors; factor names should be brief (approximately one to four words) and capture the theoretical meaning of the group of items that comprise the factor (Mvududu & Sink, 2013). This is a subjective process, and the literature is lacking consistent guidelines for the process of naming factors. A research team can be incorporated into the process of naming their factors. Test developers can separately name each factor and then meet with their research team to discuss and eventually come to an agreement about the most appropriate name for each factor.
Confirmatory Factor Analysis
CFA is an application of structural equation modeling for testing the extent to which a hypothesized factor solution (e.g., the factor solution that emerged in the EFA or another existing factor solution) demonstrates an adequate fit with a different sample (Kahn, 2006; Lewis, 2017). When validating scores on a new test, investigators should compute both EFA and CFA with two different samples from the same population, as the emergent internal structure in EFA can vary substantially. Researchers can collect two sequential samples or they may elect to collect one large sample and divide it into two smaller samples, one for EFA and the second for CFA.
Evaluating model fit in CFA is a complex task that is typically determined by examining the collective implications of multiple goodness-of-fit (GOF) indices, which include absolute, incremental, and parsimonious (Lewis, 2017). Absolute fit indices evaluate the extent to which the hypothesized model or the dimensionality of the existing measure fits with the data collected from a new sample. Incremental fit indices compare the improvement in fit between the hypothesized model and a null model (also referred to as an independence model) in which there is no correlation between observed variables. Parsimonious fit indices take the model’s complexity into account by testing the extent to which model fit is improved by estimating fewer pathways (i.e., creating a more parsimonious or simple model). Psychometric researchers generally report a combination of absolute, incremental, and parsimonious fit indices to demonstrate acceptable model fit (Mvududu & Sink, 2013). Table 1 includes tentative guidelines for interpreting model fit based on the synthesized recommendations of leading psychometric researchers from a comprehensive search of the measurement literature (Byrne, 2016; Dimitrov, 2012; Fabrigar et al., 1999; Hooper et al., 2008; Hu & Bentler, 1999; Kahn, 2006; Lewis, 2017; Mvududu & Sink, 2013; Schreiber et al., 2006; Worthington & Whittaker, 2006).
Table 1
Fit Indices and Tentative Thresholds for Evaluating Model Fit
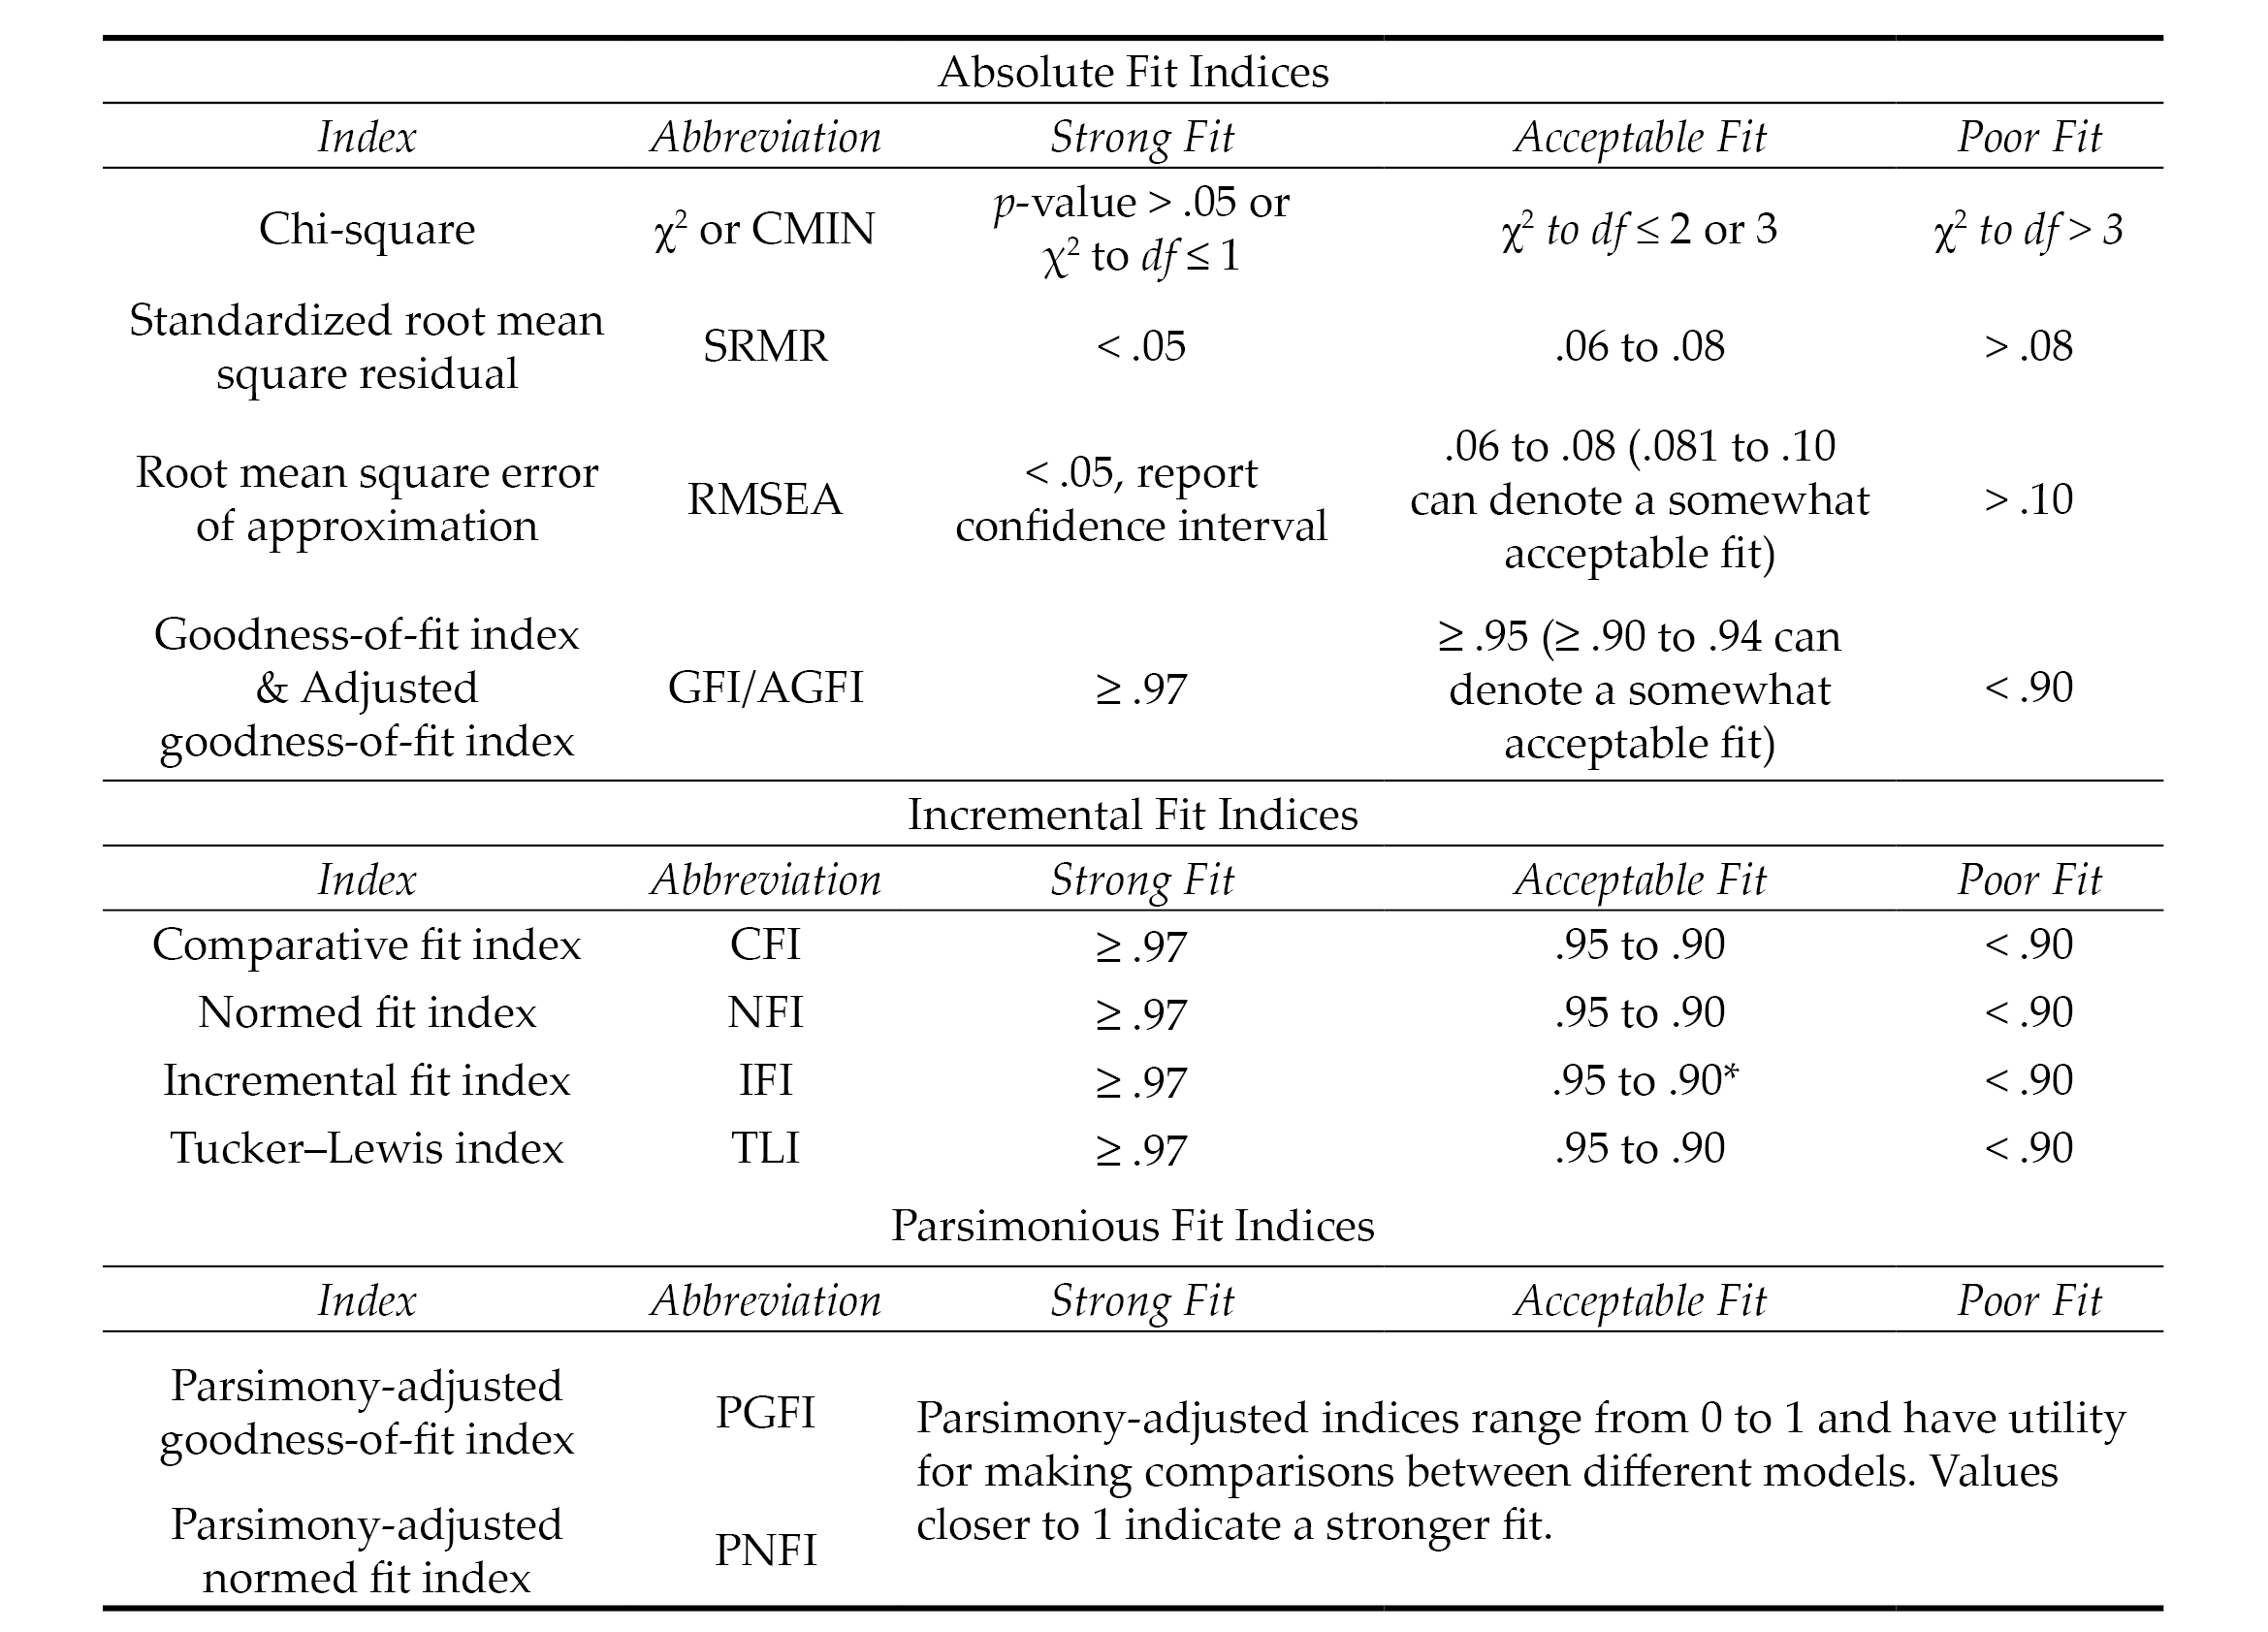
Note. The fit indices and benchmarks to estimate the degree of model fit in this table are offered as tentative guidelines for scores on attitudinal measures based on the synthesized recommendations of numerous psychometric researchers (see citations in the “Confirmatory Factor Analysis” section of this article). The list of fit indices in this table are not all-inclusive (i.e., not all of them are typically reported). There is no universal approach for determining which fit indices to investigate nor are there any absolute thresholds for determining the degree of model fit. No single fix index is sufficient for determining model fit. Researchers are tasked with selecting and interpreting fit indices holistically (i.e., collectively), in ways that make both statistical and substantive sense based on their construct of measurement and goals of the study.
*.90 to .94 can denote an acceptable model fit for incremental fix indices; however, the majority of values should be ≥ .95.
Model Respecification
The results of a CFA might reveal a poor or unacceptable model fit (see Table 1), indicating that the dimensionality of the hypothesized model that emerged from the EFA was not replicated or confirmed with a second sample (Mvududu & Sink, 2013). CFA is a rigorous model-fitting procedure and poor model fit in a CFA might indicate that the EFA-derived factor solution is insufficient for appraising the construct of measurement. CFA, however, is a more stringent test of structural validity than EFA, and psychometric researchers sometimes refer to the modification indices (also referred to as Lagrange multiplier statistics), which denote the expected decrease in the X2 value (i.e., degree of improvement in model fit) if the parameter is freely estimated (Dimitrov, 2012). In these instances, correlating the error terms between items or removing problematic items will improve model fit; however, when considering model respecification, psychometric researchers should proceed cautiously, if at all, as a strong theoretical justification is necessary to defend model respecification (Byrne, 2016; Lewis, 2017; Schreiber et al., 2006). Researchers should also be clear that model respecification causes the CFA to become an EFA because they are investigating the dimensionality of a different or modified model rather than confirming the structure of an existing, hypothesized model.
Higher-Order CFA
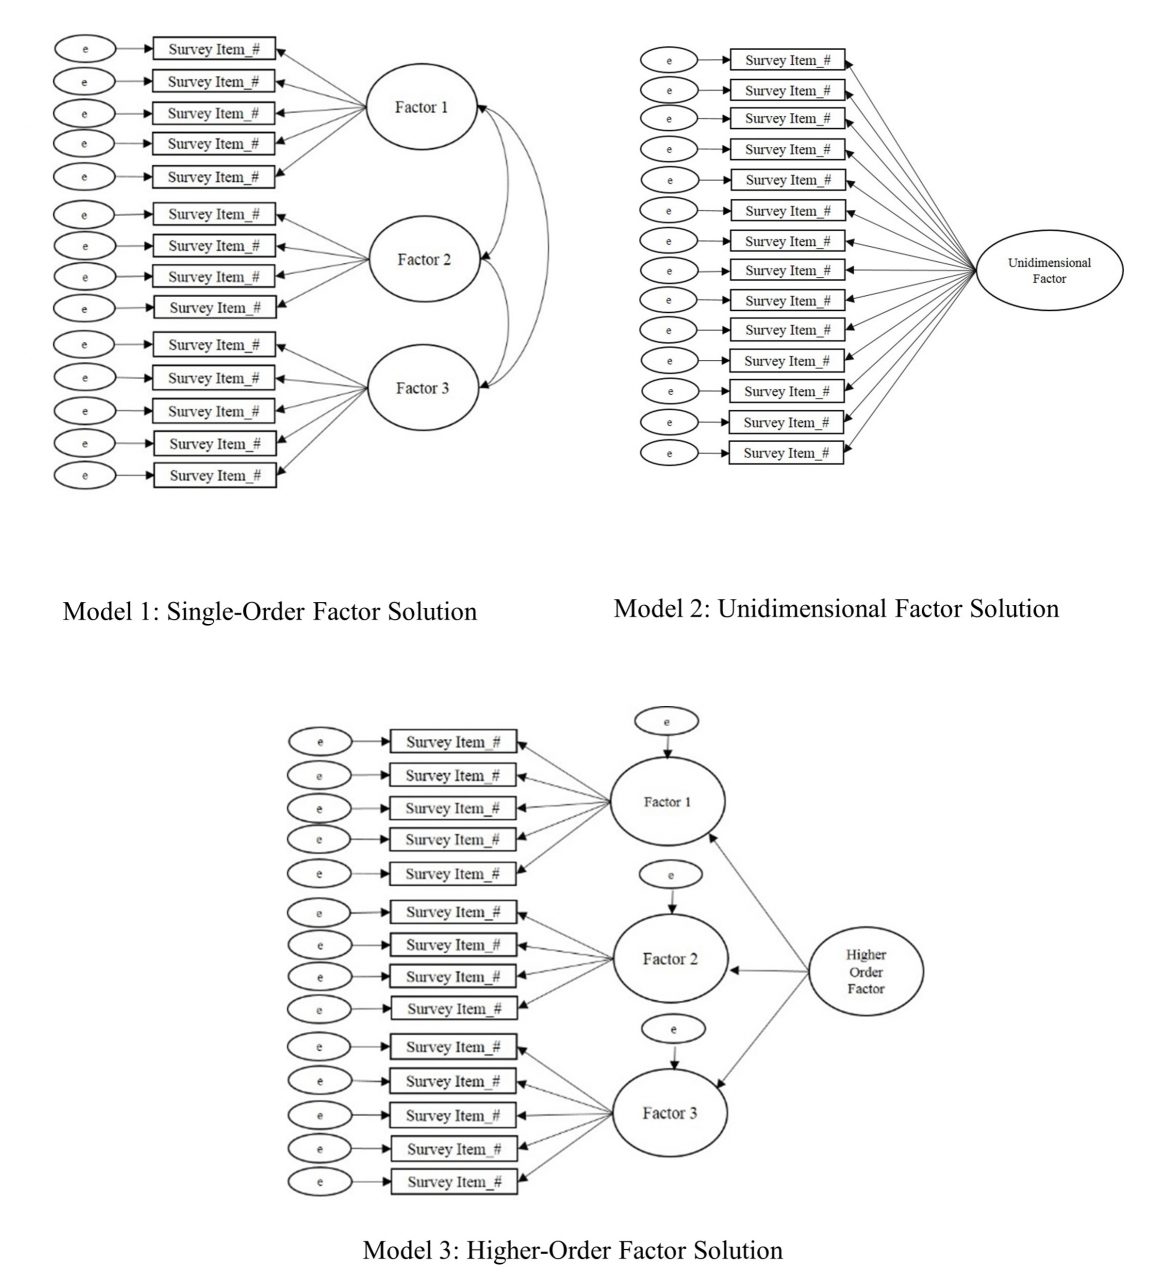
Higher-order CFA is an extension of CFA that allows researchers to test nested models and determine if a second-order latent variable (factor) explains the associations between the factors in a single-order CFA (Credé & Harms, 2015). Similar to single-order CFA (see Figure 3, Model 1) in which the test items cluster together to form the factors or subscales, higher-order CFA reveals if the factors are related to one another strongly enough to suggest the presence of a global factor (see Figure 3, Model 3). Suppose, for example, the test developer of a scale for measuring dimensions of the therapeutic alliance confirmed the three following subscales via single-order CFA (see Figure 3, Model 1): Empathy, Unconditional Positive Regard, and Congruence. Computing a higher-order CFA would reveal if a higher-order construct, which the research team might name Therapeutic Climate, is present in the data. In other words, higher-order CFA reveals if Empathy, Unconditional Positive Regard, and Congruence, collectively, comprise the second-order factor of Therapeutic Climate.
Determining if a higher-order factor explains the co-variation (association) between single-order factors is a complex undertaking. Thus, researchers should consider a number of criteria when deciding if their data are appropriate for higher-order CFA (Credé & Harms, 2015). First, moderate-to-strong associations (co-variance) should exist between first-order factors. Second, the unidimensional factor solution (see Figure 3, Model 2) should display a poor model fit (see Table 1) with the data. Third, theoretical support should exist for the presence of a higher-order factor. Referring to the example in the previous paragraph, person-centered therapy provides a theory-based explanation for the presence of a second-order or global factor (Therapeutic Climate) based on the integration of the single-order factors (Empathy, Unconditional Positive Regard, and Congruence). In other words, the presence of a second-order factor suggests that Therapeutic Climate explains the strong association between Empathy, Unconditional Positive Regard, and Congruence.
Finally, the single-order factors should display strong factor loadings (approximately ≥ .70) on the higher-order factor. However, there is not an absolute consensus among psychometric researchers regarding the criteria for higher-order CFA and the criteria summarized in this section are not a dualistic decision rule for retaining or rejecting a higher-order model. Thus, researchers are tasked with presenting that their data meet a number of criteria to justify the presence of a higher-order factor. If the results of a higher-order CFA reveal an acceptable model fit (see Table 1), researchers should directly compare (e.g., chi-squared test of difference) the single-order and higher-order models to determine if one model demonstrates a superior fit with the data at a statistically significant level.
Figure 3
Single-Order, Unidimensional, and Higher-Order Factor Solutions
Multiple-Group Confirmatory Factor Analysis
Multiple-group confirmatory factor analysis (MCFA) is an extension of CFA for testing the factorial invariance (psychometric equivalence) of a scale across subgroups of a sample or population (C.-C. Chen et al., 2020; Dimitrov, 2010). In other words, MCFA has utility for testing the extent to which a particular construct has the same meaning across different groups of a larger sample or population. Suppose, for example, the developer of the Therapeutic Climate scale (see example in the previous section) validated scores on their scale with undergraduate college students. Invariance testing has potential to provide further support for the internal structure validity of the scale by testing whether Empathy, Unconditional Positive Regard, and Congruence have the same meaning across different subgroups of undergraduate college students (e.g., between different gender identities, ethnic identities, age groups, and other subgroups of the larger sample).
Levels of Invariance. Factorial invariance can be tested in a number of different ways and includes the following primary levels or aspects: (a) configural invariance, (b) measurement (metric, scalar, and strict) invariance, and (c) structural invariance (Dimitrov, 2010, 2012). Configural invariance (also referred to as pattern invariance) serves as the baseline mode (typically the best fitting model with the data), which is used as the point of comparison when testing for metric, scalar, and structural invariance. In layperson’s terms, configural invariance is a test of whether the scales are approximately similar across groups.
Measurement invariance includes testing for metric and scalar invariance. Metric invariance is a test of whether each test item makes an approximately equal contribution (i.e., approximately equal factor loadings) to the latent variable (composite scale score). In layperson’s terms, metric invariance evaluates if the scale reasonably captures the same construct. Scalar invariance adds a layer of rigor to metric invariance by testing if the differences between the average scores on the items are attributed to differences in the latent variable means. In layperson’s terms, scalar invariance indicates that if the scores change over time, they change in the same way.
Strict invariance is the most stringent level of measurement invariance testing and tests if the sum total of the items’ unique variance (item variation that is not in common with the factor) is comparable to the error variance across groups. In layperson’s terms, the presence of strict invariance demonstrates that score differences between groups are exclusively due to differences in the common latent variables. Strict invariance, however, is typically not examined in social sciences research because the latent factors are not composed of residuals. Thus, residuals are negligible when evaluating mean differences in latent scores (Putnick & Bornstein, 2016).
Finally, structural invariance is a test of whether the latent factor variances are equivalent to the factor covariances (Dimitrov, 2010, 2012). Structural invariance tests the null hypothesis that there are no statistically significant differences between the unconstrained and constrained models (i.e., determines if the unconstrained model is equivalent to the constrained model). Establishing structural invariance indicates that when the structural pathways are allowed to vary across the two groups, they naturally produce equal results, which supports the notion that the structure of the model is invariant across both groups. In layperson’s terms, the presence of structural invariance indicates that the pathways (directionality) between variables behave in the same way across both groups. It is necessary to establish configural and metric invariance prior to testing for structural invariance.
Sample Size and Criteria for Evaluating Invariance. Researchers should check their sample size before computing invariance testing, as small samples (approximately < 200) can overestimate model fit (Dimitrov, 2010). Similar to single-order CFA, no absolute sample size guidelines exist in the literature for invariance testing. Generally, a minimum sample of at least 200 participants per group is recommended for invariance testing (although < 200 to 300+ is advantageous). Referring back to the Therapeutic Climate scale example (see the previous section), investigators would need a minimum sample of 400 if they were seeking to test the invariance of the scale by generational status (200 first generation + 200 non-first generation = 400). The minimum sample size would increase as more levels are added. For example, a minimum sample of 600 would be recommended if investigators quantified generational status on three levels (200 first generation + 200 second generation + 200 third generation and beyond = 600).
Factorial invariance is investigated through a computation of the change in model fit at each level of invariance testing (F. F. Chen, 2007). Historically, the Satorra and Bentler chi-square difference test was the sole criteria for testing factorial invariance, with a non-significant p-value indicating factorial invariance (Putnick & Bornstein, 2016). The chi-square difference test is still commonly reported by contemporary psychometric researchers; however, it is rarely used as the sole criteria for determining invariance, as the test is sensitive to large samples. The combined recommendations of F. F. Chen (2007) and Putnick and Bornstein (2016) include the following thresholds for investigating invariance: ≤ ∆ 0.010 in CFI, ≤ ∆ 0.015 in RMSEA, and ≤ ∆ 0.030 in SRMR for metric invariance or ≤ ∆ 0.015 in SRMR for scalar invariance. In a simulation study, Kang et al. (2016) found that McDonald’s NCI (MNCI) outperformed the CFI in terms of stability. Kang et al. (2016) recommend < ∆ 0.007 in MNCI for the 5th percentile and ≤ ∆ 0.007 in MNCI for the 1st percentile as cutoff values for measurement quality. Strong measurement invariance is achieved when both metric and scalar invariance are met, and weak invariance is accomplished when only metric invariance is present (Dimitrov, 2010).
Exemplar Review of a Psychometric Study
The following section will include a review of an exemplar psychometric study based on the recommendations for EFA (see Figure 2) and CFA (see Table 1) that are provided in this manuscript. In 2020, I collaborated with Ryan Flinn on the development and validation of scores on the Mental Distress Response Scale (MDRS) for appraising how college students are likely to respond when encountering a peer in mental distress (Kalkbrenner & Flinn, 2020). A total of 13 items were entered into an EFA. Following the steps for EFA (see Figure 1), the sample size (N = 569) exceeded the guidelines for sample size that I published in my 2021 article (Kalkbrenner, 2021b), including an STV of 10:1 or 200 participants, whichever produces a larger sample. Flinn and I (2020) ensured that our 2020 study’s data were consistent with a normal distribution (skewness & kurtosis values ≤ ±1) and computed preliminary assumption checking, including inter-item correlation matrix, KMO (.73), and Bartlett’s test of sphericity (p < .001).
An ML factor extraction method was employed, as the data were largely consistent (skewness & kurtosis values ≤ ±1) with a normal distribution. We used the three most rigorous factor retention criteria—percentage of variance accounted for, scree test, and parallel analysis—to extract a two-factor solution. An oblique factor rotation method (direct oblimin) was employed, as the two factors were correlated. We referred to the recommended factor retention criteria, including h2 values .30 to .99, factor loadings ≥ .40, and cross-loading ≥ .30, to eliminate one item with low commonalities and two cross-loading items. Using a research team, we named the first factor Diminish/Avoid, as each item that marked this factor reflected a dismissive or evasive response to encountering a peer in mental distress. The second factor was named Approach/Encourage because each item that marked this factor included a response to a peer in mental distress that was active and likely to help connect their peer to mental health support services.
Our next step was to compute a CFA by administering the MDRS to a second sample of undergraduate college students to confirm the two-dimensional factor solution that emerged in the EFA. The sample size (N = 247) was sufficient for CFA (STV > 10:1 and > 200 participants). The MDRS items were entered into a CFA and the following GOF indices emerged: CMIN = χ2 (34) = 61.34, p = .003, CMIN/DF = 1.80, CFI = .96, IFI = .96, RMSEA = .06, 90% CI [0.03, 0.08], and SRMR = .04. A comparison between our GOF indices from the 2020 study with the thresholds for evaluating model fit in Table 1 reveal an acceptable-to-strong fit between the MDRS model and the data. Collectively, our 2020 procedures for EFA and CFA were consistent with the recommendations in this manuscript.
Implications for the Profession
Implications for Counseling Practitioners
Assessment literacy is a vital component of professional counseling practice, as counselors who practice in a variety of specialty areas select and administer tests to clients and use the results to inform diagnosis and treatment planning (C.-C. Chen et al., 2020; Mvududu & Sink, 2013; NBCC, 2016; Neukrug & Fawcett, 2015). It is important to note that test results alone should not be used to make diagnoses, as tests are not inherently valid (Kalkbrenner, 2021b). In fact, the authors of the Diagnostic and Statistical Manual of Mental Disorders stated that “scores from standardized measures and interview sources must be interpreted using clinical judgment” (American Psychiatric Association, 2013, p. 37). Professional counselors can use test results to inform their diagnoses; however, diagnostic decision making should ultimately come down to a counselor’s clinical judgment.
Counseling practitioners can refer to this manuscript as a reference for evaluating the internal structure validity of scores on a test to help determine the extent to which, if any at all, the test in question is appropriate for use with clients. When evaluating the rigor of an EFA for example, professional counselors can refer to this manuscript to evaluate the extent to which test developers followed the appropriate procedures (e.g., preliminary assumption checking, factor extraction, retention, and rotation [see Figure 2]). Professional counselors are encouraged to pay particular attention to the factor extraction method that the test developers employed, as PCA is sometimes used in lieu of more appropriate methods (e.g., PAF/ML). Relatedly, professional counselors should be vigilant when evaluating the factor rotation method employed by test developers because oblique rotation methods are typically more appropriate than orthogonal (e.g., varimax) for counseling tests.
CFA is one of the most commonly used tests of the internal structure validity of scores on psychological assessments (Kalkbrenner, 2021b). Professional counselors can compare the CFA fit indices in a test manual or journal article to the benchmarks in Table 1 and come to their own conclusion about the internal structure validity of scores on a test before using it with clients. Relatedly, the layperson’s definitions of common psychometric terms in Figure 1 might have utility for increasing professional counselors’ assessment literacy by helping them decipher some of the psychometric jargon that commonly appears in psychometric studies and test manuals.
Implications for Counselor Education
Assessment literacy begins in one’s counselor education program and it is imperative that counselor educators teach their students to be proficient in recognizing and evaluating internal structure validity evidence of test scores. Teaching internal structure validity evidence can be an especially challenging pursuit because counseling students tend to fear learning about psychometrics and statistics (Castillo, 2020; Steele & Rawls, 2015), which can contribute to their reticence and uncertainty when encountering psychometric research. This reticence can lead one to read the methodology section of a psychometric study briefly, if at all. Counselor educators might suggest the present article as a resource for students taking classes in research methods and assessment as well as for students who are completing their practicum, internship, or dissertation who are evaluating the rigor of existing measures for use with clients or research participants.
Counselor educators should urge their students not to skip over the methodology section of a psychometric study. When selecting instrumentation for use with clients or research participants, counseling students and professionals should begin by reviewing the methodology sections of journal articles and test manuals to ensure that test developers employed rigorous and empirically supported procedures for test development and score validation. Professional counselors and their students can compare the empirical steps and guidelines for structural validation of scores that are presented in this manuscript with the information in test manuals and journal articles of existing instrumentation to evaluate its internal structure. Counselor educators who teach classes in assessment or psychometrics might integrate an instrument evaluation assignment into the course in which students select a psychological instrument and critique its psychometric properties. Another way that counselor educators who teach classes in current issues, research methods, assessment, or ethics can facilitate their students’ assessment literacy development is by creating an assignment that requires students to interview a psychometric researcher. Students can find psychometric researchers by reviewing the editorial board members and authors of articles published in the two peer-reviewed journals of the Association for Assessment and Research in Counseling, Measurement and Evaluation in Counseling and Development and Counseling Outcome Research and Evaluation. Students might increase their interest and understanding about the necessity of assessment literacy by talking to researchers who are passionate about psychometrics.
Assessment Literacy: Additional Considerations
Internal structure validity of scores is a crucial component of assessment literacy for evaluating the construct validity of test scores (Bandalos & Finney, 2019). Assessment literacy, however, is a vast construct and professional counselors should consider a number of additional aspects of test worthiness when evaluating the potential utility of instrumentation for use with clients. Reviewing these additional considerations is beyond the scope of this manuscript; however, readers can refer to the following features of assessment literacy and corresponding resources: reliability (Kalkbrenner, 2021a), practicality (Neukrug & Fawcett, 2015), steps in the instrument development process (Kalkbrenner, 2021b), and convergent and divergent validity evidence of scores (Swank & Mullen, 2017). Moreover, the discussion of internal structure validity evidence of scores in this manuscript is based on Classical Test Theory (CTT), which tends to be an appropriate platform for attitudinal measures. However, Item Response Theory (see Amarnani, 2009) is an alternative to CTT with particular utility for achievement and aptitude testing.
Cross-Cultural Considerations in Assessment Literacy
Professional counselors have an ethical obligation to consider the cross-cultural fairness of a test before use with clients, as the validity of test scores are culturally dependent (American Counseling Association [ACA], 2014; Kane, 2010; Neukrug & Fawcett, 2015; Swanepoel & Kruger, 2011). Cross-cultural fairness (also known as test fairness) in testing and assessment “refers to the comparability of score meanings across individuals, groups or settings” (Swanepoel & Kruger, 2011, p. 10). There exists some overlap between internal structure validity and cross-cultural fairness; however, some distinct differences exist as well.
Using CFA to confirm the factor structure of an established test with participants from a different culture is one way to investigate the cross-cultural fairness of scores. Suppose, for example, an investigator found acceptable internal structure validity evidence (see Table 1) for scores on an anxiety inventory that was normed in America with participants in Eastern Europe who identify with a collectivist cultural background. Such findings would suggest that the dimensionality of the anxiety inventory extends to the sample of Eastern European participants. However, internal structure validity testing alone might not be sufficient for testing the cross-cultural fairness of scores, as factor analysis does not test for content validity. In other words, although the CFA confirmed the dimensionality of an American model with a sample of Eastern European participants, the analysis did not take potential qualitative differences about the construct of measurement (anxiety severity) into account. It is possible (and perhaps likely) that the lived experience of anxiety differs between those living in two different cultures. Accordingly, a systems-level approach to test development and score validation can have utility for enhancing the cross-cultural fairness of scores (Swanepoel & Kruger, 2011).
A Systems-Level Approach to Test Development and Score Validation
Swanepoel and Kruger (2011) outlined a systemic approach to test development that involves circularity, which includes incorporating qualitative inquiry into the test development process, as qualitative inquiry has utility for uncovering the nuances of participants’ lived experiences that quantitative data fail to capture. For example, an exploratory-sequential mixed-methods design in which qualitative findings are used to guide the quantitative analyses is a particularly good fit with systemic approaches to test development and score validation. Referring to the example in the previous section, test developers might conduct qualitative interviews to develop a grounded theory of anxiety severity in the context of the collectivist culture. The grounded theory findings could then be used as the theoretical framework (see Kalkbrenner, 2021b) for a psychometric study aimed at testing the generalizability of the qualitative findings. Thus, in addition to evaluating the rigor of factor analytic results, professional counselors should also review the cultural context in which test items were developed before administering a test to clients.
Language adaptions of instrumentation are another relevant cross-cultural fairness consideration in counseling research and practice. Word-for-word translations alone are insufficient for capturing cross-cultural fairness of instrumentation, as culture extends beyond just language (Lenz et al., 2017; Swanepoel & Kruger, 2011). Pure word-for-word translations can also cause semantic errors. For example, feeling “fed up” might translate to feeling angry in one language and to feeling full after a meal in another language. Accordingly, professional counselors should ensure that a translated instrument was subjected to rigorous procedures for maintaining cross-cultural fairness. Reviewing such procedures is beyond the scope of this manuscript; however, Lenz et al. (2017) outlined a 6-step process for language translation and cross-cultural adaptation of instruments.
Conclusion
Gaining a deeper understanding of the major approaches to factor analysis for demonstrating internal structure validity in counseling research has potential to increase assessment literacy among professional counselors who work in a variety of specialty areas. It should be noted that the thresholds for interpreting the strength of internal structure validity coefficients that are provided throughout this manuscript should be used as tentative guidelines, not unconditional standards. Ultimately, internal structure validity is a function of test scores and the construct of measurement. The stakes or consequences of test results should be considered when making final decisions about the strength of validity coefficients. As professional counselors increase their familiarity with factor analysis, they will most likely become more cognizant of the strengths and limitations of counseling-related tests to determine their utility for use with clients. The practical overview of factor analysis presented in this manuscript can serve as a one-stop shop or resource that professional counselors can refer to as a reference for selecting tests with validated scores for use with clients, a primer for teaching courses, and a resource for conducting their own research.
Conflict of Interest and Funding Disclosure
The author reported no conflict of interest
or funding contributions for the development
of this manuscript.
References
Amarnani, R. (2009). Two theories, one theta: A gentle introduction to item response theory as an alternative to classical test theory. The International Journal of Educational and Psychological Assessment, 3, 104–109.
American Counseling Association. (2014). ACA code of ethics. https://www.counseling.org/resources/aca-code-of-ethics.pdf
American Educational Research Association, American Psychological Association, National Council on Measurement in Education. (2014). Standards for educational and psychological testing. https://www.apa.org/science/programs/testing/standards
American Psychiatric Association. (2013). Diagnostic and statistical manual of mental disorders (5th ed.).
https://doi.org/10.1176/appi.books.9780890425596
Bandalos, D. L., & Finney, S. J. (2019). Factor analysis: Exploratory and confirmatory. In G. R. Hancock, L. M. Stapleton, & R. O. Mueller (Eds.), The reviewer’s guide to quantitative methods in the social sciences (2nd ed., pp. 98–122). Routledge.
Beavers, A. S., Lounsbury, J. W., Richards, J. K., Huck, S. W., Skolits, G. J., & Esquivel, S. L. (2013). Practical considerations for using exploratory factor analysis in educational research. Practical Assessment, Research and Evaluation, 18(5/6), 1–13. https://doi.org/10.7275/qv2q-rk76
Byrne, B. M. (2016). Structural equation modeling with AMOS: Basic concepts, applications, and programming (3rd ed.). Routledge.
Castillo, J. H. (2020). Teaching counseling students the science of research. In M. O. Adekson (Ed.), Beginning your counseling career: Graduate preparation and beyond (pp. 122–130). Routledge.
Chen, C.-C., Lau, J. M., Richardson, G. B., & Dai, C.-L. (2020). Measurement invariance testing in counseling. Journal of Professional Counseling: Practice, Theory & Research, 47(2), 89–104.
https://doi.org/10.1080/15566382.2020.1795806
Chen, F. F. (2007). Sensitivity of goodness of fit indexes to lack of measurement invariance. Structural Equation Modeling, 14(3), 464–504. https://doi.org/10.1080/10705510701301834
Council for Accreditation of Counseling and Related Educational Programs. (2015). 2016 CACREP standards. http://www.cacrep.org/wp-content/uploads/2017/08/2016-Standards-with-citations.pdf
Credé, M., & Harms, P. D. (2015). 25 years of higher-order confirmatory factor analysis in the organizational sciences: A critical review and development of reporting recommendations. Journal of Organizational
Behavior, 36(6), 845–872. https://doi.org/10.1002/job.2008
Dimitrov, D. M. (2010). Testing for factorial invariance in the context of construct validation. Measurement and Evaluation in Counseling and Development, 43(2), 121–149. https://doi.org/10.1177/0748175610373459
Dimitrov, D. M. (2012). Statistical methods for validation of assessment scale data in counseling and related fields. American Counseling Association.
Fabrigar, L. R., Wegener, D. T., MacCallum, R. C., & Strahan, E. J. (1999). Evaluating the use of exploratory factor analysis in psychological research. Psychological Methods, 4(3), 272–299.
https://doi.org/10.1037/1082-989X.4.3.272
Field, A. (2018). Discovering statistics using IBM SPSS statistics (5th ed.). SAGE.
Hooper, D., Coughlan, J., & Mullen, M. R. (2008). Structural equation modelling: Guidelines for determining model fit. The Electronic Journal of Business Research Methods, 6(1), 53–60.
Hu, L., & Bentler, P. M. (1999). Cutoff criteria for fit indexes in covariance structure analysis: Conventional criteria versus new alternatives. Structural Equation Modeling: A Multidisciplinary Journal, 6(1), 1–55. https://doi.org/10.1080/10705519909540118
Kahn, J. H. (2006). Factor analysis in counseling psychology research, training, and practice: Principles, advances, and applications. The Counseling Psychologist, 34(5), 684–718. https://doi.org/10.1177/0011000006286347
Kaiser, H. F. (1974). An index of factorial simplicity. Psychometrika, 39(1), 31–36. https://doi.org/10.1007/BF02291575
Kalkbrenner, M. T. (2021a). Alpha, omega, and H internal consistency reliability estimates: Reviewing these options and when to use them. Counseling Outcome Research and Evaluation. Advance online publication. https://doi.org/10.1080/21501378.2021.1940118
Kalkbrenner, M. T. (2021b). A practical guide to instrument development and score validation in the social sciences: The MEASURE Approach. Practical Assessment, Research, and Evaluation, 26, Article 1. https://scholarworks.umass.edu/pare/vol26/iss1/1
Kalkbrenner, M. T., & Flinn, R. E. (2020). The Mental Distress Response Scale and promoting peer-to-peer mental health support: Implications for college counselors and student affairs officials. Journal of College Student Development, 61(2), 246–251. https://doi.org/10.1353/csd.2020.0021
Kane, M. (2010). Validity and fairness. Language Testing, 27(2), 177–182. https://doi.org/10.1177/0265532209349467
Kang, Y., McNeish, D. M., & Hancock, G. R. (2016). The role of measurement quality on practical guidelines for assessing measurement and structural invariance. Educational and Psychological Measurement, 76(4), 533–561. https://doi.org/10.1177/0013164415603764
Lenz, A. S., Gómez Soler, I., Dell’Aquilla, J., & Uribe, P. M. (2017). Translation and cross-cultural adaptation of assessments for use in counseling research. Measurement and Evaluation in Counseling and Development, 50(4), 224–231. https://doi.org/10.1080/07481756.2017.1320947
Lewis, T. F. (2017). Evidence regarding the internal structure: Confirmatory factor analysis. Measurement and Evaluation in Counseling and Development, 50(4), 239–247. https://doi.org/10.1080/07481756.2017.1336929
Mvududu, N. H., & Sink, C. A. (2013). Factor analysis in counseling research and practice. Counseling Outcome Research and Evaluation, 4(2), 75–98. https://doi.org/10.1177/2150137813494766
National Board for Certified Counselors. (2016). NBCC code of ethics. https://www.nbcc.org/Assets/Ethics/NBCCCodeofEthics.pdf
Neukrug, E. S., & Fawcett, R. C. (2015). Essentials of testing and assessment: A practical guide for counselors, social workers, and psychologists (3rd ed.). Cengage.
Putnick, D. L., & Bornstein, M. H. (2016). Measurement invariance conventions and reporting: The state of the art and future directions for psychological research. Developmental Review, 41, 71–90. https://doi.org/10.1016/j.dr.2016.06.004
Schreiber, J. B., Nora, A., Stage, F. K., Barlow, E. A., & King, J. (2006). Reporting structural equation modeling and confirmatory factor analysis results: A review. Journal of Educational Research, 99(6), 323–338.
https://doi:10.3200/JOER.99.6.323-338
Steele, J. M., & Rawls, G. J. (2015). Quantitative research attitudes and research training perceptions among master’s-level students. Counselor Education and Supervision, 54(2), 134–146. https://doi.org/10.1002/ceas.12010
Swanepoel, I., & Kruger, C. (2011). Revisiting validity in cross-cultural psychometric-test development: A systems-informed shift towards qualitative research designs. South African Journal of Psychiatry, 17(1), 10–15. https://doi.org/10.4102/sajpsychiatry.v17i1.250
Swank, J. M., & Mullen, P. R. (2017). Evaluating evidence for conceptually related constructs using bivariate correlations. Measurement and Evaluation in Counseling and Development, 50(4), 270–274.
https://doi.org/10.1080/07481756.2017.1339562
Tate, K. A., Bloom, M. L., Tassara, M. H., & Caperton, W. (2014). Counselor competence, performance assessment, and program evaluation: Using psychometric instruments. Measurement and Evaluation in Counseling and Development, 47(4), 291–306. https://doi.org/10.1177/0748175614538063
Watson, J. C. (2017). Establishing evidence for internal structure using exploratory factor analysis. Measurement and Evaluation in Counseling and Development, 50(4), 232–238. https://doi.org/10.1080/07481756.2017.1336931
Worthington, R. L., & Whittaker, T. A. (2006). Scale development research: A content analysis and recommendations for best practices. The Counseling Psychologist, 34(6), 806–838. https://doi.org/10.1177/0011000006288127
Michael T. Kalkbrenner, PhD, NCC, is an associate professor at New Mexico State University. Correspondence may be addressed to Michael T. Kalkbrenner, Department of Counseling and Educational Psychology, New Mexico State University, Las Cruces, NM 88003, mkalk001@nmsu.edu.
Aug 18, 2020 | Volume 10 - Issue 3
Jacob Olsen, Sejal Parikh Foxx, Claudia Flowers
Researchers analyzed data from a national sample of American School Counselor Association (ASCA) members practicing in elementary, middle, secondary, or K–12 school settings (N = 4,066) to test the underlying structure of the School Counselor Knowledge and Skills Survey for Multi-Tiered Systems of Support (SCKSS). Using both exploratory and confirmatory factor analyses, results suggested that a second-order four-factor model had the best fit for the data. The SCKSS provides counselor educators, state and district leaders, and practicing school counselors with a psychometrically sound measure of school counselors’ knowledge and skills related to MTSS, which is aligned with the ASCA National Model and best practices related to MTSS. The SCKSS can be used to assess pre-service and in-service school counselors’ knowledge and skills for MTSS, identify strengths and areas in need of improvement, and support targeted school counselor training and professional development focused on school counseling program and MTSS alignment.
Keywords: school counselor knowledge and skills, survey, multi-tiered systems of support, factor analysis, school counseling
The role of the school counselor has evolved significantly since the days of “vocational guidance” in the early 1900s (Gysbers, 2010, p. 1). School counselors are now called to base their programs on the American School Counselor Association (ASCA) National Model for school counseling programs (ASCA, 2019a). The ASCA National Model consists of four components: Define (i.e., professional and student standards), Manage (i.e., program focus and planning), Deliver (i.e., direct and indirect services), and Assess (i.e., program assessment and school counselor assessment and appraisal; ASCA, 2019a). Within the ASCA National Model framework, school counselors lead and contribute to schoolwide efforts aimed at supporting the academic, career, and social/emotional development and success of all students (ASCA, 2019b). In addition, school counselors are uniquely trained to provide small-group counseling and psychoeducational groups, and to collect and analyze data to show the impact of these services (ASCA, 2014; Gruman & Hoelzen, 2011; Martens & Andreen, 2013; Olsen, 2019; Rose & Steen, 2015; Sink et al., 2012; Smith et al., 2015). School counselors also support students with the most intensive needs by providing referrals to community resources, collaborating with intervention teams, and consulting with key stakeholders involved in student support plans (Grothaus, 2013; Pearce, 2009; Ziomek-Daigle et al., 2019).
This model for meeting the needs of all students aligns with a multi-tiered systems of support (MTSS) framework, one of the most widely implemented and researched approaches to “providing high-quality instruction and interventions matched to student need across domains and monitoring progress frequently to make decisions about changes in instruction or goals” (McIntosh & Goodman, 2016, p. 6). In an MTSS framework, there are typically three progressive tiers with increasing intensity of supports based on student responses to core instruction and interventions (J. Freeman et al., 2017). Schoolwide universal systems (i.e., Tier 1), including high-quality research-based instruction, are put in place to support all students academically, socially, and behaviorally; targeted interventions (i.e., Tier 2) are put in place for students not responding positively to schoolwide universal supports; and intensive team-based systems (i.e., Tier 3) are put in place for individual students needing function-based intensive interventions beyond what is received at Tier 1 and Tier 2 (Sugai et al., 2000).
Strategies for aligning school counseling programs and MTSS have been thoroughly documented in the literature (Belser et al., 2016; Goodman-Scott et al., 2015; Goodman-Scott & Grothaus, 2017a; Ockerman et al., 2012). There is also a growing body of research documenting the impact of this alignment on important student outcomes (Betters-Bubon & Donohue, 2016; Campbell et al., 2013; Goodman-Scott et al., 2014) and the role of school counselors (Betters-Bubon et al., 2016; Goodman-Scott, 2013). In addition, ASCA recognizes the significance of school counselors’ roles in MTSS implementation, highlighting that “school counselors are stakeholders in the development and implementation of a Multi-Tiered System of Supports (MTSS)” and “align their work with MTSS through the implementation of a comprehensive school counseling program” (ASCA, 2018, p. 47).
The benefits of school counseling program and MTSS alignment are clear; however, effective alignment depends on school counselors having knowledge and skills for MTSS (Sink & Ockerman, 2016). Despite consensus in the literature about the knowledge and skills for MTSS that school counselors need to align their programs, there is a lack of psychometrically sound surveys that measure school counselors’ knowledge and skills for MTSS. Therefore, the validation of such a survey is a critical component to advancing the process of school counselors developing the knowledge and skills needed to contribute to MTSS implementation and align their programs with existing MTSS frameworks.
Knowledge and Skills for MTSS
The core features of MTSS include (a) universal screening, (b) data-based decision-making, (c) a continuum of evidence-based practices, (d) a focus on fidelity of implementation, and (e) staff training on evidence-based practices (Berkeley et al., 2009; Center on Positive Behavioral Interventions and Supports, 2015; Chard et al., 2008; Hughes & Dexter, 2011; Michigan’s Integrated Behavior & Learning Support Initiative, 2015; Sugai & Simonsen, 2012). For effective MTSS implementation, school staff need the knowledge and skills to plan for and assess the systems and practices embedded in each of the core features (Eagle et al., 2015; Leko et al., 2015). Despite this need, researchers have found that school staff, including school counselors, often lack knowledge and skills of key components for MTSS (Bambara et al., 2009; Patrikakou et al., 2016; Prasse et al., 2012). For example, Patrikakou et al. (2016) conducted a national survey and found that school counselors understood the MTSS framework and felt prepared to deliver Tier 1 counseling supports. However, school counselors felt least prepared to use data management systems for decision-making and assessing the impact of MTSS interventions (Patrikakou et al., 2016).
As a result of the gap in knowledge and skills for MTSS, the need to more effectively prepare pre-service educators to implement MTSS has become an increasingly urgent issue across many disciplines within education (Briere et al., 2015; Harvey et al., 2015; Kuo, 2014; Leko et al., 2015; Prasse et al., 2012; Sullivan et al., 2011). This urgency is the result of the widespread use of MTSS and the measurable impact MTSS has on student behavior (Barrett et al., 2008; Bradshaw et al., 2010), academic engagement (Benner et al., 2013; Lassen et al., 2006), attendance (J. Freeman et al., 2016; Pas & Bradshaw, 2012), school safety (Horner et al., 2009), and school climate (Bradshaw et al., 2009). This urgency has been especially emphasized in recent calls for MTSS knowledge and skills to be included in school counselor preparation programs (Goodman-Scott & Grothaus, 2017b; Olsen, Parikh-Foxx, et al., 2016; Sink, 2016).
Given that many pre-service preparation programs have only recently begun integrating MTSS into their training, the opportunity for school staff to gain the knowledge and skills for MTSS continues to be through in-service professional development opportunities at the state, district, or school level (Brendle, 2015; R. Freeman et al., 2015; Hollenbeck & Patrikakou, 2014; Swindlehurst et al., 2015). For in-service school counselors, research shows that MTSS-focused professional development is related to increased knowledge and skills for MTSS (Olsen, Parikh-Foxx, et al., 2016). Further, when school counselors participate in professional development focused on MTSS, the knowledge and skills gained contribute to increased participation in MTSS leadership roles (Betters-Bubon & Donohue, 2016), increased data-based decision-making (Harrington et al., 2016), and decreases in student problem behaviors (Cressey et al., 2014; Curtis et al., 2010).
The knowledge and skills required to implement MTSS effectively have been established in the literature (Bambara et al., 2009; Bastable et al., 2020; Handler et al., 2007; Harlacher & Siler, 2011; Prasse et al., 2012; Scheuermann et al., 2013). In addition, it is evident that school counselors and school counselor educators have begun to address the need to increase knowledge and skills for MTSS so school counselors can better align their programs with MTSS and ultimately provide multiple tiers of support for all students (Belser et al., 2016; Ockerman et al., 2015; Patrikakou et al., 2016). Despite this encouraging movement in the profession, little attention has been given to the measurement of school counselors’ knowledge and skills for MTSS. Thus, the development of a survey that yields valid and reliable inferences about pre-service and in-service efforts to increase school counselors’ knowledge and skills for MTSS will be critical to assessing the development of knowledge and skills over time (e.g., before, during, and after MTSS-focused professional development).
Measuring Knowledge and Skills for MTSS
A critical aspect of effective MTSS implementation is evaluation (Algozzine et al., 2010; Elfner-Childs et al., 2010). Along with student outcome data, MTSS evaluation typically includes measuring the extent to which school staff use knowledge and skills to apply core components of MTSS (i.e., fidelity of implementation), and there are multiple measurement tools that have been developed and validated to aid external evaluators and school teams in this process (Algozzine et al., 2019; Kittelman et al., 2018; McIntosh & Lane, 2019). Despite agreement that school staff need knowledge and skills for MTSS to effectively apply core components (Eagle et al., 2015; Leko et al., 2015; McIntosh et al., 2013), little attention has been given to measuring individual school staff members’ knowledge and skills for MTSS, particularly those of school counselors. Therefore, efficient and reliable ways to measure inferences about school counselor knowledge and skills for MTSS are needed to provide a baseline of understanding and determine gaps that need to be addressed in pre-service and in-service training (Olsen, Parikh-Foxx, et al., 2016; Patrikakou et al., 2016). In addition, the validation of an instrument that measures school counselors’ knowledge and skills for MTSS is timely given that school counselors have been identified as potential key leaders in MTSS implementation given their unique skill set (Ryan et al., 2011; Ziomek-Daigle et al., 2016).
The purpose of this study was to examine the latent structure of the School Counselor Knowledge and Skills Survey for Multi-Tiered Systems of Support (SCKSS). Using confirmatory factor analysis, the number of underlying factors of the survey and the pattern of item–factor relationships were examined to address the research question: What is the factor structure of the SCKSS? Results of this study provide information on possible uses and scoring procedures of the SCKSS for examining MTSS knowledge and skills.
Method
Participants
The potential participants in this study were a sample of the 15,106 ASCA members who were practicing in K–12 settings at the time of this study. In all, 4,598 school counselors responded to the survey (30% response rate). In addition, 532 only responded to a few survey items (i.e., one or two) and were therefore excluded from the analyses. The final sample size for the analyses was 4,066. The sample used for this study mirrors school counselor demographics nationwide (ASCA, 2020; Bruce & Bridgeland, 2012). Overall, 87% of participants identified as female, 84% as Caucasian, and 74% as being between the ages of 31 and 60. Most of the school counselors in the sample reported being certified for 1–8 years (59%), working in schools with 500–1,000 students (40%) in various regions across the nation, and having student caseloads ranging from 251–500 students (54%). In addition, 25%–50% of their students were eligible for free and reduced lunch, and 54% reported that their students were racially or ethnically diverse. Lastly, most participants worked in suburban (45%) high school (37%) settings.
Sampling Procedures
Prior to conducting the research, a pilot study was conducted to assess 1) the clarity and conciseness of the directions and items on the demographic questionnaire and SCKSS, and 2) the amount of time it takes to complete the demographic questionnaire and survey (Andrews et al., 2003; Dillman et al., 2014). Four school counselors completed the demographic questionnaire and survey. Following completion, the school counselors were asked to provide feedback on the clarity and conciseness of the directions and items on the demographic questionnaire and survey as well as how much time it took to complete both measures. All pilot study participants reported that the directions were clear and easy to follow. Based on the feedback from the pilot study, the demographic questionnaire and survey were expected to take participants approximately 10–15 minutes to complete.
After obtaining approval from the IRB, SurveyShare was used to distribute an introductory email and survey link to ASCA members practicing in K–12 settings. After following the link, potential participants were given an informed consent form on the SurveyShare website. Participants who completed the survey were given the opportunity to participate in a random drawing using disassociated email addresses to increase participation (Dillman et al., 2014). Following informed consent, participants were directed to the demographic questionnaire and SCKSS. A follow-up email was sent to potential participants who did not complete the survey 7 days after the original email was sent. After 3 weeks, the link was closed.
Survey and Data Analyses
School Counselor Knowledge and Skills Survey for Multi-Tiered Systems of Support
The SCKSS was developed based on the work of Blum and Cheney (2009; 2012). The Teacher Knowledge and Skills Survey for Positive Behavior Support (TKSS) has 33 self-report items using a 5-point Likert scale to measure teachers’ knowledge and skills for Positive Behavior Supports (PBS; Blum & Cheney, 2012). Items incorporate evidence-based knowledge and skills consistent with PBS. Conceptually, items of the TKSS were developed based on five factors: (a) Specialized Behavior Supports and Practices, (b) Targeted Intervention Supports and Practices, (c) Schoolwide Positive Behavior Support Practices, (d) Individualized Curriculum Supports and Practices, and (e) Positive Classroom Supports and Practices. A confirmatory factor analysis (CFA) conducted by Blum and Cheney (2009) indicated reliability coefficients for the five factors as follows: 0.86 for Specialized Behavior Supports and Practices, 0.87 for Targeted Intervention Supports and Practices, 0.86 for Schoolwide Positive Behavior Support Practices, 0.84 for Individualized Curriculum Supports and Practices, and 0.82 for Positive Classroom Supports and Practices.
Table 1
Items, Means, and Standard Deviation for the SCKSS
| Rate the following regarding your knowledge on the item: |
M |
SD |
| 1. I know our school’s policies and programs regarding the prevention of behavior problems. |
3.66 |
0.95 |
| 2. I understand the role and function of our schoolwide behavior team. |
3.58 |
1.12 |
| 3. I know our annual goals and objectives for the schoolwide behavior program. |
3.33 |
1.19 |
| 4. I know our school’s system for screening with students with behavior problems. |
3.35 |
1.20 |
| 5. I know how to access and use our school’s pre-referral teacher assistance team. |
3.23 |
1.43 |
| 6. I know how to provide access and implement our school’s counseling programs. |
4.20 |
0.84 |
| 7. I know the influence of cultural/ethnic variables on student’s school behavior. |
3.83 |
0.87 |
8. I know the programs our school uses to help students with their social and emotional development
(schoolwide expectations, conflict resolution, etc.). |
3.92 |
0.95 |
| 9. I know a range of community services to assist students with emotional/behavioral problems. |
3.72 |
0.93 |
10. I know our school’s discipline process—the criteria for referring students to the office, the methods
used to address the problem behavior, and how and when students are returned to the classroom. |
3.72 |
1.03 |
11. I know what functional behavioral assessments are and how they are used to develop behavior
intervention plans for students. |
3.35 |
1.12 |
12. I know how our schoolwide behavior team collects and uses data to evaluate our schoolwide
behavior program. |
3.12 |
1.29 |
13. I know how to provide accommodations and modifications for students with emotional and
behavioral disabilities (EBD) to support their successful participation in the general education setting. |
3.34 |
1.09 |
| 14. I know our school’s crisis intervention plan for emergency situations. |
3.74 |
1.06 |
| Rate how effectively you use the following skills/strategies: |
|
|
| 15. Approaches for helping students to solve social/interpersonal problems. |
4.04 |
0.71 |
| 16. Methods for teaching the schoolwide behavioral expectations/social skills. |
3.62 |
0.96 |
| 17. Methods for encouraging and reinforcing the use of expectations/social skills. |
3.80 |
0.84 |
| 18. Strategies for improving family–school partnerships. |
3.35 |
0.92 |
| 19. Collaborating with the school’s student assistance team to implement student’s behavior intervention plans. |
3.50 |
1.11 |
| 20. Collaborating with the school’s IEP team to implement student’s individualized education programs. |
3.53 |
1.09 |
| 21. Evaluating the effectiveness of student’s intervention plans and programs. |
3.38 |
1.01 |
| 22. Modifying curriculum to meet individual performance levels. |
3.10 |
1.09 |
| 23. Selecting and using materials that respond to cultural, gender, or developmental differences. |
3.26 |
1.02 |
| 24. Establishing and maintaining a positive and consistent classroom environment. |
3.71 |
0.98 |
| 25. Identifying the function of student’s behavior problems. |
3.52 |
0.92 |
| 26. Using data in my decision-making process for student’s behavioral programs. |
3.39 |
1.01 |
| 27. Using prompts and cues to remind students of behavioral expectations. |
3.67 |
0.95 |
| 28. Using self-monitoring approaches to help students demonstrate behavioral expectations. |
3.48 |
0.96 |
| 29. Communicating regularly with parents/guardians about student’s behavioral progress. |
3.64 |
0.97 |
30. Using alternative settings or methods to resolve student’s social/emotional problems (problem-
solving, think time, or buddy room, etc. not a timeout room). |
3.45 |
1.06 |
| 31. Methods for diffusing or deescalating student’s social/emotional problems. |
3.76 |
0.87 |
| 32. Methods for enhancing interpersonal relationships of students (e.g., circle of friends, buddy system, peer mentors). |
3.62 |
0.92 |
| 33. Linking family members to needed services and resources in the school. |
3.72 |
0.91 |
The TKSS was adapted in collaboration with the authors to develop the SCKSS (Olsen, Blum, et al., 2016) to specifically target school counselors and to reflect the updated terminology recommended in the literature (Sugai & Horner, 2009). To update terminology, multi-tiered systems of support (MTSS) replaced Positive Behavior Supports (PBS) throughout the survey. In addition, school counselor replaced teacher to reflect the role of intended participants. Finally, item 6 was updated from “I know how to access and use our school’s counseling programs” to “I know how to provide access and implement our school’s counseling programs” because of school counselors’ roles and interactions with their own programs. Further, item 6 was adjusted to be an internally oriented question about the delivery of the school counseling program rather than the school counselor’s knowledge of another school service or system in order to assess participants’ perceived mastery of school counseling program implementation rather than their perception of another service not already measured in the SCKSS. A description of the 33 SCKSS items and the means and standard deviations of each item for the current study are located in Table 1.
Data Analyses
A cross-validation holdout method was used to examine the data–model fit of the SCKSS. Prior to statistical analyses, data were screened for missing data, multivariate outliers, and the assumptions for multivariate regression. Less than 5% of the data for any variable was missing and Little’s MCAR test (χ2 = 108.47, df = 101, p = .29) indicated missing values could be considered as missing completely at random. Multiple imputation was used to estimate missing values. Although there were some outliers, results of a sensitivity analysis indicated that none of the outliers were overly influential. The assumptions of linearity, normality, multicollinearity, and homoscedasticity suggested that all the assumptions were tenable. The original sample (N = 4,066) was randomly divided into two sub-samples (N = 2,033). The first subset was used to conduct exploratory analyses and develop a model that fit the data. The second subset of participants was used to conduct confirmatory analyses without modifications.
Exploratory Factor Analysis (EFA). Using the first subset from the sample, an EFA was conducted, using SPSS, to explore the number of factors and the alignment of items to factors. The number of factors extracted was estimated based on eigenvalues greater than 1.0 and a visual inspection of the scree plot. Several rotation methods were used, including varimax and direct oblimin with changing the delta value (from 0 to 0.2). The goal of the EFA was to find a factor solution that was theoretically sound.
Confirmatory Factor Analysis (CFA). The estimation method employed for the CFA was maximum likelihood robust estimation, which is a more accurate estimate for non-normal data (Savalei, 2010). Although the data were ordinal (i.e., Likert-type scale), Mplus uses a different maximum likelihood fitting function for categorical variables. The Satorra-Bentler scaled chi-square difference test was used to determine the best model. The pattern coefficient for the first indicator of each latent variable was fixed to 1.00. Indices of model–data fit considered were chi-square test, root-mean-square error of approximation (RMSEA), standardized root-mean-square residual (SRMR), comparative fit index (CFI), and Akaike information criterion (AIC). Browne and Cudeck (1993) suggested that values greater than .10 might indicate a lack of fit. In this study, an upper 90% confidence interval value lower than .08 was used to suggest an acceptable fit. CFI values greater than .90, which indicate that the proposed model is greater than 90% of the baseline model, served as an indicator of adequate fit (Kline, 2016). Perfect model fit is indicated by SRMR = 0, and values greater than .10 may indicate poor fit (Kline, 2016). Reliability was assessed using Cronbach’s alpha (α). CFAs were used in both the exploratory and confirmatory phases of this study. In the exploratory phase (i.e., using the first subset from the sample), the researchers used the residual estimates and modification indices to identify local misfit. Respecification of correlated error variances was expected because of the data collection method (i.e., counselors responding to a single
survey) and similar wording of the items.
Results
Exploratory Phase
Exploratory Factor Analysis
An EFA was used to evaluate the structure of the 33 items on the SCKSS. Principal axis factoring was used as the extraction method. The Kaiser-Meyer-Olkin test value was .97, which suggests the sample was acceptable for conducting an EFA. The decrease in eigenvalues leveled off at five factors, with four factors having eigenvalues greater than 1.0. Parallel analysis confirmed that four factors should be retained in the solution. An oblique rotation, which was selected to allow correlation among the factors, was performed and used to determine the number of factors and item pattern.
The total variance accounted for by four factors was 64%. The item communalities were all above 0.5. Item pattern (i.e., > 0.4) and structure (i.e., > 0.5) coefficients were examined to determine the relationship of the items to the factors. Twenty-nine items clearly aligned to one factor and three items loaded in multiple factors. In a review of the item patterns, it was determined by the researchers that the three items theoretically fit in specific factors. The fourth factor only aligned with three items. In an expert review, it was determined that the three items differentiated enough from the other factors to warrant a separate factor. The alignment of items and factors are reported in Table 2.
Table 2
Alignment of Items and Factors based on EFA
| Factor |
Items |
| Individualized Supports and Practices |
11, 13, 16, 17, 22, 23, 25, 26, 27, 28, 29, 30, 31, 32 |
| Schoolwide Supports and Practices |
1, 2, 3, 4, 5, 8, 10, 12, 14, 24 |
| Targeted Supports and Practices |
6, 7, 9, 15, 18, 33 |
| Collaborative Supports and Practices |
19, 20, 21 |
The first factor was named Individualized Supports and Practices. This factor contained 14 items focused on school counselors’ knowledge and skills for supporting students individually based on need. Examples of items on the Individualized Supports and Practices factor included: “Selecting and using materials that respond to cultural, gender, or developmental differences” and “Methods for diffusing or deescalating student’s social/emotional problems.” The second factor was Schoolwide Supports and Practices, with 10 items focused on school counselors’ knowledge and skills of schoolwide and team-based efforts aimed at supporting all students and preventing student problem behavior and academic decline. Examples of items on the Schoolwide Supports and Practices factor included: “I know our annual goals and objectives for the schoolwide behavior program” and “I know our school’s crisis intervention plan for emergency situations.” Factor 3 was named Targeted Supports and Practices and contained six items. These items focused on school counselors’ knowledge and skills related to providing targeted supports for small groups of students not responding positively to schoolwide prevention efforts. Examples of items on the Targeted Supports and Practices factor included: “I know the influence of cultural/ethnic variables on student’s school behavior” and “Strategies for improving family–partnerships.” The fourth and final factor was Collaborative Supports and Practices, which contained three items focused on school counselors’ knowledge and skills related to collaborating with school personnel to implement student interventions. An example item of the Collaborative Supports and Practices factor was: “Collaborating with the school’s IEP team to implement student’s individualized education programs.” This four-factor model served as our preferred model, but competing models were explored using CFA on the first subset from the sample.
CFA Using First Subset Sample
The competing models were examined to determine the best data–model fit by conducting a CFA using MPlus. The following models were tested: (a) one-factor model, (b) four-factor model, and
(c) second-order four-factor model. Model modifications were allowed during the exploratory phases. The results of the CFA are reported in Table 3.
Table 3
Results of the Confirmatory Factor Analyses for the Exploratory Phase
|
Competing Models |
Chi-square |
df |
SRMR |
RMSEA |
90% CI, RMSEA |
TLI |
CFI |
AIC |
|
|
|
|
|
|
|
|
|
|
|
Exploratory Analyses |
|
|
|
|
|
|
|
|
| 1 |
One-Factor (initial) |
8,518.75 |
495 |
.057 |
.084 |
[.083, .086] |
0.79 |
.80 |
168,279.20 |
|
One-Factor (modification) a |
4,465.60 |
478 |
.048 |
.060 |
[.059, .062] |
0.89 |
.90 |
162,654.94 |
|
|
|
|
|
|
|
|
|
|
| 2 |
Four-Factor (initial) |
5,619.01 |
489 |
.058 |
.068 |
[.066, .069] |
0.86 |
.87 |
164,253.62 |
|
Four-Factor (modification) b |
3,866.27 |
481 |
.048 |
.055 |
[.054, .057] |
0.91 |
.92 |
161,407.48 |
|
|
|
|
|
|
|
|
|
|
| 3 |
Four-Factor second order |
5,632.53 |
491 |
.058 |
.068 |
[.066, .069] |
0.86 |
.87 |
164,270.54 |
|
Four-Factor second order (modified) b |
3,866.27 |
483 |
.048 |
.055 |
[.054, .057] |
0.91 |
.91 |
161,432.63 |
|
|
|
|
|
|
|
|
|
|
|
Confirmatory Analysis |
|
|
|
|
|
|
|
|
|
Four-Factor second order |
5,424.82 |
490 |
0.058 |
0.066 |
[.065, .068] |
0.87 |
.88 |
164,999.81 |
|
Four-Factor second order (modified) b |
4,468.62 |
483 |
0.051 |
0.060 |
[.058, .062] |
0.89 |
.90 |
163,723.53 |
Note. All chi-square tests were statistically significant at < .001.
a Seventeen correlated error variances were estimated. b Eight correlated error variances were estimated.
The initial one-factor model did not fit the data (chi-square = 8,518.75, df = 495, p < .001; RMSEA = .084, 90% CI [.083, .086]; CFI = .80; SRMR = .057), but after modification (i.e., 17 correlated error variances between observed variables), the one-factor model had an adequate fit (chi-square = 4,465.60, df = 478, p < .001; RMSEA = .060, 90% CI [.059, .062]; CFI = .90; SRMR = .048). Reasonable data–model fit was obtained for the modified models in both the four-factor and four-factor second-order models (see Table 3). Modifications included freeing eight correlated error variances between observed variables. A content expert reviewed the suggested modification to determine the appropriateness of allowing the error variances to correlate. In all but one case, the suggested correlated item error variances were adjacent to each other on the survey (i.e., item 2 with 3, 6 with 7, 11 with 12, 17 with 18, 20 with 21, 22 with 23, and 27 with 28). Given the proximity of the items, it was plausible that some systematic error variance between items would correlate. The only pair of items that were not adjacent were item 5 and item 19. Both of these items referred to the school’s teacher assistance team. For all the models, the path coefficients were statistically significant (p < .001).
Results of the Satorra-Bentler scaled chi-square difference test suggested that the four-factor model was a better model than the one-factor model (p < .001), and there was no statistically significant difference between the four-factor model and the second-order four-factor model. Because of the high intercorrelations among the factors (ranging from .81 to .92), the second-order four-factor model was tested using the second subset from the sample.
Confirmatory Phase
The holdout sample of 2,033 participants was used to verify the second-order four-factor model. The initial model (see bottom of Table 3) with no modifications suggested the model marginally fit the data (chi-square = 5,424.82, RMSEA = .066, CFI = .88, SRMR = .058). After modifying the model by allowing for the eight correlated error variances, which were the same eight correlated error variances identified in the exploratory stage, as expected there was an improvement in the model fit (chi-square = 4,468.62, RMSEA = .060, CFI = .90, SRMR = .051). The observed item loading coefficients and standard errors are reported in Table 4. All coefficients are statistically significant and all above 0.50, suggesting stable item alignment to the factor being measured. Coefficient alpha values were 0.95 for total score with all items, 0.88 for Factor 1 (Individualized Supports and Practices), 0.86 for Factor 2 (Schoolwide Supports and Practices), 0.78 for Factor 3 (Targeted Supports and Practices), and 0.65 for Factor 4 (Collaborative Supports and Practices). The results provide evidence that the SCKSS has potential to provide inferences about counselors’ knowledge and skills for MTSS.
Discussion and Implications
The SCKSS was based on the TKSS, which measured teachers’ knowledge and skills related to PBS. After adapting the survey to align to MTSS and the role of school counselors, this study aimed to examine the latent structure of the SCKSS for examining MTSS knowledge and skills. Using both exploratory and confirmatory factor analyses, results suggest that a second-order four-factor model had the best fit. The findings indicate that the SCKSS has high internal consistency with Cronbach’s alpha for the total score at 0.95, and a range between 0.65 and 0.88 for each of the four factors. The first factor, Individualized Supports and Practices, contains 14 items; the second factor, Schoolwide Supports and Practices, contains 10 items; the third factor, Targeted Supports and Practices, contains six items; and the fourth factor, Collaborative Supports and Practices, is composed of three items. These findings confirm that the SCKSS yields valid and reliable inferences about school counselors’ knowledge and skills for MTSS. Previous measures that were specific to school counselors focused on confidence and beliefs in implementing response to intervention (RtI; Ockerman et al., 2015; Patrikakou et al., 2016). Although these studies contribute to the literature by aligning RtI with the ASCA National Model, they did not focus on the specific knowledge and skills related to MTSS.
Table 4
Loading Coefficients and Standard Errors for Best Fitting Model
| Factor 1 |
Individualized Supports and Practices |
Item |
Loading |
SE |
|
|
11 |
.652 |
.014 |
|
|
13 |
.735 |
.011 |
|
|
16 |
.712 |
.013 |
|
|
17 |
.762 |
.011 |
|
|
22 |
.645 |
.014 |
|
|
23 |
.674 |
.013 |
|
|
25 |
.801 |
.009 |
|
|
26 |
.736 |
.012 |
|
|
27 |
.779 |
.010 |
|
|
28 |
.799 |
.009 |
|
|
29 |
.709 |
.012 |
|
|
30 |
.753 |
.012 |
|
|
31 |
.774 |
.010 |
|
|
32 |
.772 |
.010 |
| Factor 2 |
Schoolwide Supports and Practices |
|
|
|
|
|
1 |
.816 |
.009 |
|
|
2 |
.817 |
.010 |
|
|
3 |
.813 |
.010 |
|
|
4 |
.805 |
.010 |
|
|
5 |
.612 |
.016 |
|
|
8 |
.731 |
.012 |
|
|
10 |
.755 |
.011 |
|
|
12 |
.773 |
.011 |
|
|
14 |
.659 |
.014 |
|
|
24 |
.567 |
.017 |
| Factor 3 |
Targeted Supports and Practices |
|
|
|
|
|
6 |
.685 |
.015 |
|
|
7 |
.664 |
.014 |
|
|
9 |
.729 |
.012 |
|
|
15 |
.766 |
.011 |
|
|
18 |
.729 |
.012 |
|
|
33 |
.764 |
.012 |
| Factor 4 |
Collaborative Supports and Practices |
|
|
|
|
|
19 |
.760 |
.013 |
|
|
20 |
.618 |
.017 |
|
|
21 |
.806 |
.012 |
|
|
|
|
|
|
Higher order coefficients |
F1 |
.968 |
.006 |
|
|
F2 |
.872 |
.009 |
|
|
F3 |
.911 |
.008 |
|
|
F4 |
.944 |
.010 |
The four factors of the SCKSS can be used to support improvement practices through the use of targeted professional development. This extends previous research that found when school counselors received MTSS-focused training, there was an increase in knowledge and skills (Olsen, Parikh-Foxx, et al., 2016). Accordingly, the four factors of the SCKSS may provide a baseline of school counselors’ knowledge and skills related to MTSS and help determine gaps that need to be addressed in pre-service and in-service training. Through targeted professional development and pre-service training activities, school districts and counselor educators can identify areas in which practitioners need additional training to increase knowledge and skills related to MTSS.
The four factors of the SCKSS align with MTSS tiers and school counselor roles recommended in the ASCA National Model (2019a). The first factor, Individualized Supports and Practices, aligns with the role of school counselors providing individualized indirect services (e.g., data-based decision-making, referrals) for students who need Tier 3 supports (Ziomek-Daigle et al., 2019). The second factor, Schoolwide Supports and Practices, aligns with the role of school counselors providing Tier 1 universal supports (e.g., school counseling lessons, schoolwide initiatives, family workshops) for all students (Sink, 2019). The third factor, Targeted Supports and Practices, aligns with Tier 2 supports provided by school counselors, including small group counseling and psychoeducational group instruction for students who do not successfully respond to schoolwide support services (Olsen, 2019). Finally, the fourth factor, Collaborative Supports and Practices, aligns with the school counselor’s role across multiple tiers of support, providing access to community resources through appropriate referrals and collaborating and consulting with intervention teams (Cholewa & Laundy, 2019).
The SCKSS survey can also be used to improve current school counseling practices. This is an important consideration given Patrikakou et al. (2016) found that although school counselors reported feeling prepared to deliver Tier 1 counseling support services, they felt least prepared to collect and analyze data to determine the effectiveness of interventions. Given that the ASCA National Model (2019a) has a theme entitled Assess, school counselors should be trained to engage in program improvements that move toward positively impacting students. As such, using the SCKSS to improve MTSS practices has the potential to improve ASCA National Model–related activities.
Limitations
There are several limitations in the current study. First, respondents were from a national school counseling association. Their responses could have been influenced by having access to professional development and literature related to MTSS. Second, this was a self-report survey, so the respondents could have answered in a manner that was socially desirable. Third, given the 30% survey return rate, generalizing these results to the population of counselors is not recommended. Fourth, rewording item 6 to an internally oriented question about delivery of the school counseling program rather than school counselors’ knowledge of another school service or system may have impacted the best fit model. Finally, because this was an online survey, only those with access to email and internet at the time of the survey had the opportunity to participate.
Future Research
Although participants in this study included a large national sample of school counselors, they were all members of a national association. Therefore, researchers could replicate this study with school counselors who are non-members and conduct further testing of the psychometric properties of the survey. Second, research could examine how professional development impacts specific aspects of knowledge and skills in relation to student outcomes. That is, if school counselors have targeted professional development around each of the four factors, does that affect student outcomes in areas such as discipline, social/emotional well-being, school climate, or even academic performance? Finally, future studies could explore other variables that impact the development and application of school counselors’ knowledge and skills for MTSS.
Conclusion
There is growing evidence supporting the impact of school counseling program and MTSS alignment (Betters-Bubon et al., 2016; Betters-Bubon & Donohue, 2016; Campbell et al., 2013; Goodman-Scott, 2013; Goodman-Scott et al., 2014). In order for school counselors to align their programs with MTSS and contribute to MTSS implementation, foundational knowledge and skills are essential. Given that research has shown that key factors such as school level (i.e., elementary, middle, high) and MTSS training impact school counselors’ knowledge and skills for MTSS (Olsen, Parikh-Foxx, et al., 2016), the development and validation of an MTSS knowledge and skills survey to measure school counselors’ knowledge and skills over time is an important next step to advancing school counseling program and MTSS alignment. The four factors of the SCKSS (i.e., Individualized Supports and Practices, Schoolwide Supports and Practices, Targeted Supports and Practices, Collaborative Supports and Practices) provide school counselors with an opportunity to reflect on their strengths and areas in need of improvement related to the tiers of the MTSS framework. Further application research and validation of the SCKSS is needed; however, this study indicates the SCKSS provides counselor educators, pre-service school counselors, and in-service school counselors with a tool to measure the development of MTSS knowledge and skills.
Conflict of Interest and Funding Disclosure
The authors reported no conflict of interest
or funding contributions for the development
of this manuscript.
References
Algozzine, B., Barrett, S., Eber, L., George, H., Horner, R., Lewis, T., Putnam, B., Swain-Bradway, J., McIntosh, K., & Sugai, G. (2019). School-wide PBIS Tiered Fidelity Inventory version 2.1. OSEP Technical Assistance Center on Positive Behavioral Interventions and Supports. https://www.pbisapps.org/Resources/SWIS%20Publications/SWPBIS%20Tiered%20Fidelity%20Inventory%20(TFI).pdf
Algozzine, B., Horner, R. H., Sugai, G., Barrett, S., Dickey, C. R., Eber, L., Kincaid, D., Lewis, T., & Tobin, T. (2010). Evaluation blueprint for school-wide positive behavior support. National Technical Assistance Center on Positive Behavioral Interventions and Support. https://www.pbisapps.org/Resources/SWIS%20Publications/Evaluation%20Blueprint%20for%20School-Wide%20Positive%20Behavior%20Support.pdf
American School Counselor Association. (2014). The school counselor and group counseling. ASCA Position Statements, pp. 35–36. https://www.schoolcounselor.org/asca/media/asca/PositionStatements/PositionStatements.pdf
American School Counselor Association. (2018). The school counselor and multitiered system of supports. ASCA Position Statements, pp. 47–48. https://www.schoolcounselor.org/asca/media/asca/PositionStatements/PositionStatements.pdf
American School Counselor Association. (2019a). The ASCA national model: A framework for school counseling programs (4th ed.).
American School Counselor Association. (2019b). Role of the school counselor. https://www.schoolcounselor.org/administrators/role-of-the-school-counselor
American School Counselor Association. (2020). ASCA membership demographics. https://www.schoolcounselor.org/asca/media/asca/home/MemberDemographics.pdf
Andrews, D., Nonnecke, B., & Preece, J. (2003). Electronic survey methodology: A case study in reaching hard-to-involve internet users. International Journal of Human–Computer Interaction, 16(2), 185–210.
https://doi.org/10.1207/S15327590IJHC1602_04
Bambara, L. M., Nonnemacher, S., & Kern, L. (2009). Sustaining school-based individualized positive behavior support: Perceived barriers and enablers. Journal of Positive Behavior Interventions, 11(3), 161–176.
https://doi.org/10.1177/1098300708330878
Barrett, S. B., Bradshaw, C. P., & Lewis-Palmer, T. (2008). Maryland statewide PBIS initiative: Systems, evaluation, and next steps. Journal of Positive Behavior Interventions, 10(2), 105–114.
https://doi.org/10.1177/1098300707312541
Bastable, E., Massar, M. M., & McIntosh, K. (2020). A survey of team members’ perceptions of coaching activities related to Tier 1 SWPBIS implementation. Journal of Positive Behavior Interventions, 22(1), 51–61. https://doi.org/10.1177/1098300719861566
Belser, C. T., Shillingford, M. A., & Joe, J. R. (2016). The ASCA model and a multi-tiered system of supports: A framework to support students of color with problem behavior. The Professional Counselor, 6(3), 251–262. https://doi.org/10.15241/cb.6.3.251
Benner, G. J., Kutash, K., Nelson, J. R., & Fisher, M. B. (2013). Closing the achievement gap of youth with emotional and behavioral disorders through multi-tiered systems of support. Education and Treatment of Children, 36(3), 15–29. https://doi.org/10.1353/etc.2013.0018
Berkeley, S., Bender, W. N., Peaster, L. G., & Saunders, L. (2009). Implementation of response to intervention: A snapshot of progress. Journal of Learning Disabilities, 42(1), 85–95. https://doi.org/10.1177/0022219408326214
Betters-Bubon, J., Brunner, T., & Kansteiner, A. (2016). Success for all? The role of the school counselor in creating and sustaining culturally responsive positive behavior interventions and supports programs. The Professional Counselor, 6(3), 263–277. https://doi.org/10.15241/jbb.6.3.263
Betters-Bubon, J., & Donohue, P. (2016). Professional capacity building for school counselors through school-wide positive behavior interventions and supports implementation. Journal of School Counseling, 14(3). http://jsc.montana.edu/articles/v14n3.pdf
Blum, C., & Cheney, D. (2009). The validity and reliability of the Teacher Knowledge and Skills Survey for Positive Behavior Support. Teacher Education and Special Education, 32(3), 239–256.
https://doi.org/10.1177/0888406409340013
Blum, C., & Cheney, D. (2012). Teacher Knowledge and Skills Survey for Positive Behavior Support. Illinois State University.
Bradshaw, C. P., Koth, C. W., Thornton, L. A., & Leaf, P. J. (2009). Altering school climate through school-wide positive behavioral interventions and supports: Findings from a group-randomized effectiveness trial. Prevention Science, 10(2), 100–115. https://doi.org/10.1007/s11121-008-0114-9
Bradshaw, C. P., Mitchell, M. M., & Leaf, P. J. (2010). Examining the effects of schoolwide positive behavioral interventions and supports on student outcomes: Results from a randomized controlled effectiveness trial in elementary schools. Journal of Positive Behavioral Interventions, 12(3), 133–148.
https://doi.org/10.1177/1098300709334798
Brendle, J. (2015). A survey of response to intervention team members’ effective practices in rural elementary schools. Rural Special Education Quarterly, 34(2), 3–8. https://doi.org/10.1177/875687051503400202
Briere, D. E., Simonsen, B., Sugai, G., & Myers, D. (2015). Increasing new teachers’ specific praise using a within-school consultation intervention. Journal of Positive Behavior Interventions, 17(1), 50–60.
https://doi.org/10.1177/1098300713497098
Browne, M. W., & Cudeck, R. (1993). Alternative ways of assessing model fit. In K. A. Bollen and J. S. Long (Eds.), Testing structural equation models (pp. 136–162). SAGE.
Bruce, M., & Bridgeland, J. (2012). 2012 national survey of school counselors—True north: Charting the course to college and career readiness.https://secure-media.collegeboard.org/digitalServices/pdf/nosca/true-north.pdf
Campbell, A., Rodriguez, B. J., Anderson, C., & Barnes, A. (2013). Effects of a Tier 2 intervention on classroom disruptive behavior and academic engagement. Journal of Curriculum & Instruction, 7(1), 32–54.
https://doi.org/10.3776/joci.2013.v7n1p32-54
Center on Positive Behavioral Interventions and Supports. (2015). Positive behavioral interventions and supports (PBIS) implementation blueprint. University of Oregon. https://www.pbis.org/resource/pbis-implementation-blueprint
Chard, D. J., Harn, B. A., Sugai, G., Horner, R. H., Simmons, D. C., & Kame’enui, E. J. (2008). Core features of multi-tiered systems of reading and behavioral support. In C. G. Greenwood, T. R. Kratochwill, & M. Clements (Eds.), Schoolwide prevention models: Lessons learned in elementary schools (pp. 31–60). Guilford.
Cholewa, B., & Laundy, K. C. (2019). School counselors consulting and collaborating within MTSS. In E. Goodman-Scott, J. Betters-Bubon, & P. Donohue (Eds.), The school counselor’s guide to multi-tiered systems of support (pp. 222–245). Routledge.
Cressey, J. M., Whitcomb, S. A., McGilvray-Rivet, S. J., Morrison, R. J., & Shander-Reynolds, K. J. (2014). Handling PBIS with care: Scaling up to school-wide implementation. Professional School Counseling, 18(1), 90–99. https://doi.org/10.1177/2156759X0001800104
Curtis, R., Van Horne, J. W., Robertson, P., & Karvonen, M. (2010). Outcomes of a school-wide positive behavioral support program. Professional School Counseling, 13(3), 159–164.
Dillman, D. A., Smyth, J. D., & Christian, L. M. (2014). Internet, phone, mail, and mixed-mode surveys: The tailored design method. Wiley.
Eagle, J. W., Dowd-Eagle, S. E., Snyder, A., & Holtzman, E. G. (2015). Implementing a multi-tiered system of support (MTSS): Collaboration between school psychologists and administrators to promote systems-level change. Journal of Educational and Psychological Consultation, 25(2–3), 160–177.
https://doi.org/10.1080/10474412.2014.929960
Elfner Childs, K., Kincaid, D., & George, H. P. (2010). A model for statewide evaluation of a universal positive behavior support initiative. Journal of Positive Behavior Interventions, 12(4), 198–210.
https://doi.org/10.1177/1098300709340699
Freeman, R., Miller, D., & Newcomer, L. (2015). Integration of academic and behavioral MTSS at the district level using implementation science. Learning Disabilities: A Contemporary Journal, 13(1), 59–72.
Freeman, J., Simonsen, B., McCoach, D. B., Sugai, G., Lombardi, A., & Horner, R. (2016). Relationship between school-wide positive behavior interventions and supports and academic, attendance, and behavior outcomes in high schools. Journal of Positive Behavior Interventions, 18(1), 41–51.
https://doi.org/10.1177/1098300715580992
Freeman, J., Sugai, G., Simonsen, B., & Everett, S. (2017). MTSS coaching: Bridging knowing to doing. Theory Into Practice, 56(1), 29–37. https://doi.org/10.1080/00405841.2016.1241946
Goodman-Scott, E. (2013). Maximizing school counselors’ efforts by implementing school-wide positive behavioral interventions and supports: A case study from the field. Professional School Counseling, 17(1), 111–119. https://doi.org/10.1177/2156759X0001700106
Goodman-Scott, E., Betters-Bubon, J., & Donohue, P. (2015). Aligning comprehensive school counseling programs and positive behavioral interventions and supports to maximize school counselors’ efforts. Professional School Counseling, 19(1), 57–67. https://doi.org/10.5330/1096-2409-19.1.57
Goodman-Scott, E., Doyle, B., & Brott, P. (2014). An action research project to determine the utility of bully prevention in positive behavior support for elementary school bullying prevention. Professional School Counseling, 17(1), 120–129. https://doi.org/10.5330/prsc.17.1.53346473u5052044
Goodman-Scott, E., & Grothaus, T. (2017a). RAMP and PBIS: “They definitely support one another”: The results of a phenomenological study. Professional School Counseling, 21(1), 119–129.
https://doi.org/10.5330/1096-2409-21.1.119
Goodman-Scott, E., & Grothaus, T. (2017b). School counselors’ roles in RAMP and PBIS: A phenomenological investigation. Professional School Counseling, 21(1), 130–141. https://doi.org/10.5330/1096-2409-21.1.130
Grothaus, T. (2013). School counselors serving students with disruptive behavior disorders. Professional School Counseling, 16(2), 245–255. https://doi.org/10.1177/2156759X12016002S04
Gruman, D. H., & Hoelzen, B. (2011). Determining responsiveness to school counseling interventions using behavioral observations. Professional School Counseling, 14(3), 183–190.
Gysbers, N. C. (2010). School counseling principles: Remembering the past, shaping the future: A history of school counseling. American School Counselor Association.
Handler, M. W., Rey, J., Connell, J., Thier, K., Feinberg, A., & Putnam, R. (2007). Practical considerations in creating school-wide positive behavior support in public schools. Psychology in the Schools, 44(1), 29–39. https://doi.org/10.1002/pits.20203
Harlacher, J. E., & Siler, C. E. (2011). Factors related to successful RtI implementation. Communique, 39(6), 20–22.
Harrington, K., Griffith, C., Gray, K., & Greenspan, S. (2016). A grant project to initiate school counselors’ development of a multi-tiered system of supports based on social-emotional data. The Professional Counselor, 6(3), 278–294. https://doi.org/10.15241/kh.6.3.278
Harvey, M. W., Yssel, N., & Jones, R. E. (2015). Response to intervention preparation for preservice teachers: What is the status for Midwest institutions of higher education. Teacher Education and Special Education, 38(2), 105–120. https://doi.org/10.1177/0888406414548598
Hollenbeck, A. F., & Patrikakou, E. (2014). Response to intervention in Illinois: An exploration of school professionals’ attitudes and beliefs. Mid-Western Educational Researcher, 26(2), 58–82.
Horner, R. H., Sugai, G., Smolkowski, K., Eber, L., Nakasato, J., Todd, A. W., & Esperanza, J., (2009). A randomized, wait-list controlled effectiveness trial assessing school-wide positive behavior support in elementary schools. Journal of Positive Behavior Interventions, 11(3), 133–144. https://doi.org/10.1177/1098300709332067
Hughes, C. A., & Dexter, D. D. (2011). Response to intervention: A research-based summary. Theory Into Practice, 50(1), 4–11. https://doi.org/10.1080/00405841.2011.534909
Kittelman, A., Eliason, B. M., Dickey, C. R., & McIntosh, K. (2018). How are schools using the SWPBIS Tiered Fidelity Inventory (TFI)? OSEP Technical Assistance Center on Positive Behavioral Interventions and Supports. https://www.pbis.org/resource/how-are-schools-using-the-swpbis-tiered-fidelity-inventory-tfi
Kline, R. B. (2016). Principles and practice of structural equation modeling (4th ed.). Guilford.
Kuo, N.-C. (2014). Why is response to intervention (RTI) so important that we should incorporate it into teacher education programs and how can online learning help? Journal of Online Learning & Teaching, 10(4), 610–624.
Lassen, S. R., Steele, M. M., & Sailor, W. (2006). The relationship of school-wide positive behavior support to academic achievement in an urban middle school. Psychology in the Schools, 43(6), 701–712.
https://doi.org/10.1002/pits.20177
Leko, M. M., Brownell, M. T., Sindelar, P. T., & Kiely, M. T. (2015). Envisioning the future of special education personnel preparation in a standards-based era. Exceptional Children, 82(1), 25–43.
https://doi.org/10.1177/0014402915598782
Martens, K., & Andreen, K. (2013). School counselors’ involvement with a school-wide positive behavior support intervention: Addressing student behavior issues in a proactive and positive manner. Professional School Counseling, 16(5), 313–322. https://doi.org/10.1177/2156759X1201600504
McIntosh, K., & Goodman, S. (2016). Integrated multi-tiered systems of support: Blending RTI and PBIS. Guilford.
McIntosh, K., & Lane, K. L. (2019). Advances in measurement in school-wide positive behavioral interventions and supports. Remedial and Special Education, 40(1), 3–5. https://doi.org/10.1177/0741932518800388
McIntosh, K., Mercer, S. H., Hume, A. E., Frank, J. L., Turri, M. G., & Mathews, S. (2013). Factors related to sustained implementation of schoolwide positive behavior support. Exceptional Children, 79(3), 293–311.
Michigan’s Integrated Behavior & Learning Support Initiative. (2015). An abstract regarding multi-tier system of supports (MTSS) and Michigan’s integrated behavior and learning support initiative (MiBLSi). https://mimtsstac.org/sites/default/files/Documents/MIBLSI_Model/MTSS/MiBLSi%20MTSS%20Abstract%20May%202015.pdf
Ockerman, M. S., Mason, E. C. M., & Hollenbeck, A. F. (2012). Integrating RTI with school counseling programs: Being a proactive professional school counselor. Journal of School Counseling, 10(15). https://files.eric.ed.gov/fulltext/EJ978870.pdf
Ockerman, M. S., Patrikakou, E., & Hollenbeck, A. F. (2015). Preparation of school counselors and response to intervention: A profession at the crossroads. Journal of Counselor Preparation & Supervision, 7(3), 161–184. https://doi.org/10.7729/73.1106
Olsen, J. (2019). Tier 2: Providing supports for students with elevated needs. In E. Goodman-Scott, J. Betters-Bubon, & P. Donohue (Eds.), The school counselor’s guide to multi-tiered systems of support (pp. 133–162). Routledge.
Olsen, J. A., Blum, C., & Cheney, D. (2016). School counselor knowledge and skills survey for multi-tiered systems of support. Unpublished survey, Department of Counseling, University of North Carolina at Charlotte.
Olsen, J., Parikh-Foxx, S., Flowers, C., & Algozzine, B. (2016). An examination of factors that relate to school counselors’ knowledge and skills in multi-tiered systems of support. Professional School Counseling, 20(1), 159–171. https://doi.org/10.5330/1096-2409-20.1.159
Pas, E. T., & Bradshaw, C. P. (2012). Examining the association between implementation and outcomes: State-wide scale-up of school-wide positive behavior intervention and supports. The Journal of Behavioral Health Services & Research, 39(4), 417–433. https://doi.org/10.1007/s11414-012-9290-2
Patrikakou, E., Ockerman, M. S., & Hollenbeck, A. F. (2016). Needs and contradictions of a changing field: Evidence from a national response to intervention implementation study. The Professional Counselor, 6(3), 233–250. https://doi.org/10.15241/ep.6.3.233
Pearce, L. R. (2009). Helping children with emotional difficulties: A response to intervention investigation. The Rural Educator, 30(2), 34–46.
Prasse, D. P., Breunlin, R. J., Giroux, D., Hunt, J., Morrison, D., & Thier, K. (2012). Embedding multi-tiered
system of supports/response to intervention into teacher preparation. Learning Disabilities: A Contemporary Journal, 10(2), 75–93.
Rose, J., & Steen, S. (2015). The Achieving Success Everyday group counseling model: Fostering resiliency in middle school students. Professional School Counseling, 18(1), 28–37. https://doi.org/10.1177/2156759X0001800116
Ryan, T., Kaffenberger, C. J., & Carroll, A. G. (2011). Response to intervention: An opportunity for school
counselor leadership. Professional School Counseling, 14(3), 211–221.
https://doi.org/10.1177/2156759X1101400305
Savalei, V. (2010). Expected versus observed information in SEM with incomplete normal and nonnormal data. Psychological Methods, 15(4), 352–367. https://doi.org/10.1037/a0020143
Scheuermann, B. K., Duchaine, E. L., Bruntmyer, D. T., Wang, E. W., Nelson, C. M., & Lopez, A. (2013). An exploratory survey of the perceived value of coaching activities to support PBIS implementation in secure juvenile education settings. Education and Treatment of Children, 36(3), 147–160.
https://doi.org/10.1353/etc.2013.0021
Sink, C. A. (2016). Incorporating a multi-tiered system of supports into school counselor preparation. The Professional Counselor, 6(3), 203–219. https://doi.org/10.15241/cs.6.3.203
Sink, C. (2019). Tier 1: Creating strong universal systems of support and facilitating systemic change. In E. Goodman-Scott, J. Betters-Bubon, & P. Donohue (Eds.), The school counselor’s guide to multi-tiered systems of support (pp. 62–98). Routledge.
Sink, C. A., Edwards, C., & Eppler, C. (2012). School based group counseling. Brooks/Cole.
Sink, C. A., & Ockerman, M. S. (2016). Introduction to the special issue: School counselors and a multi-tiered system of supports: Cultivating systemic change and equitable outcomes. The Professional Counselor, 6(3), v–ix. https://doi.org/csmo.6.3.v
Smith, H. M., Evans-McCleon, T. N., Urbanski, B., & Justice, C. (2015). Check in/check out intervention with peer monitoring for a student with emotional-behavioral difficulties. Journal of Counseling & Development, 93(4), 451–459. https://doi.org/10.1002/jcad.12043
Sugai, G., & Horner, R. H. (2009). Responsiveness-to-intervention and school-wide positive behavior supports: Integration of multi-tiered system approaches. Exceptionality, 17(4), 223–237.
https://doi.org/10.1080/09362830903235375
Sugai, G. M., Horner, R. H., Dunlap, G., Hieneman, M., Lewis, T. J., Nelson, C. M., Scott, T. M., Liaupsin, C.,
Sailor, W., Turnbull, A. P., Turnbull, H. R., Wickham, D., Wilcox, B., & Ruef, M. (2000). Applying positive behavior support and functional behavioral assessment in schools. Journal of Positive Behavior Interventions, 2(3), 131–143. https://doi.org/10.1177/109830070000200302
Sugai, G., & Simonsen, B. (2012). Positive behavioral interventions and supports: History, defining features, and misconceptions (2012, June 19). University of Connecticut: Center for PBIS & Center for Positive Behavioral Interventions and Supports. http://www.pbis.org/common/cms/files/pbisresources/PBIS_revisited_June19r_2012
.pdf
Sullivan, A. L., Long, L., & Kucera, M. (2011). A survey of school psychologists’ preparation, participation, and perceptions related to positive behavior interventions and supports. Psychology in the Schools, 48(10), 971–985. https://doi.org/10.1002/pits.20605
Swindlehurst, K., Shepherd, K., Salembier, G., & Hurley, S. (2015). Implementing response to intervention: Results of a survey of school principals. Rural Special Education Quarterly, 34(2), 9–16.
https://doi.org/10.1177/875687051503400203
Ziomek-Daigle, J., Cavin, J., Diaz, J., Henderson, B., & Huguelet, A. (2019). Tier 3: Specialized services for students with intensive needs. In E. Goodman-Scott, J. Betters-Bubon, & P. Donohue (Eds.), The school counselor’s guide to multi-tiered systems of support (pp. 163–188). Routledge.
Ziomek-Daigle, J., Goodman-Scott, E., Cavin, J., & Donohue, P. (2016). Integrating a multi-tiered system of support with comprehensive school counseling programs. The Professional Counselor, 6(3), 220–232. https://doi.org/10.15241/jzd.6.3.220
Jacob Olsen, PhD, is an assistant professor at California State University Long Beach. Sejal Parikh Foxx, PhD, is a professor and Chair of the Department of Counseling at the University of North Carolina at Charlotte. Claudia Flowers, PhD, is a professor at the University of North Carolina at Charlotte. Correspondence may be addressed to Jacob Olsen, College of Education, 1250 Bellflower Boulevard, Long Beach, CA 90840-2201, jacob.olsen@csulb.edu.
Dec 2, 2015 | Article, Volume 5 - Issue 4
Gwen Bass, Ji Hee Lee, Craig Wells, John C. Carey, Sangmin Lee
The scale development and exploratory and confirmatory factor analyses of the Protective Factor Index (PFI) is described. The PFI is a 13-item component of elementary students’ report cards that replaces typical items associated with student behavior. The PFI is based on the Construct-Based Approach (CBA) to school counseling, which proposes that primary and secondary prevention activities of school counseling programs should focus on socio-emotional, development-related psychological constructs that are associated with students’ academic achievement and well-being, that have been demonstrated to be malleable, and that are within the range of expertise of school counselors. Teachers use the PFI to rate students’ skills in four construct-based domains that are predictive of school success. School counselors use teachers’ ratings to monitor student development and plan data-driven interventions.
Keywords: protective factors, factor analysis, school counselors, construct-based approach, student development
Contemporary models for school counseling practice (ASCA, 2012) emphasize the importance of school counselors using quantitative data related to students’ academic achievement to support professional decisions (Poynton & Carey, 2006), to demonstrate accountability (Sink, 2009), to evaluate activities and programs (Dimmitt, Carey, & Hatch, 2007), to advocate for school improvement (House & Martin, 1998) and to advocate for increased program support (Martin & Carey, 2014). While schools are data-rich environments and great emphasis is now placed on the use of data by educators, the readily available quantitative data elements (e.g., achievement test scores) are much better aligned with the work of classroom teachers than with the work of school counselors (Dimmitt et al., 2007). While teachers are responsible for students’ acquisition of knowledge, counselors are responsible for the improvement of students’ socio-emotional development in ways that promote achievement. Counselors need data related to students’ socio-emotional states (e.g., self-efficacy) and abilities (e.g., self-direction) that predispose them toward achievement so that they are better able to help students profit from classroom instruction and make sound educational and career decisions (Squier, Nailor, & Carey, 2014). Measures directly associated with constructs related to socio-emotional development are not routinely collected or used in schools. The development of sound and useful measures of salient socio-emotional factors that are aligned with the work of school counselors and that are strongly related to students’ academic success and well-being would greatly contribute to the ability of counselors to identify students who need help, use data-based decision making in planning interventions, evaluate the effectiveness of interventions, demonstrate accountability for results, and advocate for students and for program improvements (Squier et al., 2014).
Toward this end, we developed the Protective Factors Index (PFI) and describe herein the development and initial exploratory and confirmatory factors analyses of the PFI. The PFI is a 13-item component of elementary students’ report cards that replaces typical items associated with student deportment. The PFI is based on the Construct-Based Approach (CBA) to school counseling (Squier et al., 2014), which is based on the premise that primary and secondary prevention activities of school counseling programs should be focused on socio-emotional development-related psychological constructs that have been identified by research to be associated strongly with students’ academic achievement and well-being, that have been demonstrated to be malleable, and that are within the range of expertise of school counselors. The CBA clusters these constructs into four areas reflecting motivation, self-direction, self-knowledge and relationship competence.
The present study was conducted as collaboration between the Ronald H. Fredrickson Center for School Counseling Outcome Research and Evaluation and an urban district in the Northeastern United States. As described below, the development of the PFI was guided by the CBA-identified clusters of psychological states and processes (Squier et al., 2014). With input from elementary counselors and teachers, a 13-item report card and a scoring rubric were developed, such that teachers could rate each student on school counseling-related dimensions that have been demonstrated to underlie achievement and well-being. This brief measure was created with considerable input from the school personnel who would be implementing it, with the goal of targeting developmentally appropriate skills in a way that is efficient for teachers and useful for counselors. By incorporating the PFI into the student report card, we ensured that important and useful student-level achievement-related data could be easily collected multiple times per year for use by counselors. The purpose of this study was to explore relationships between the variables that are measured by the scale and to assess the factor structure of the instrument as the first step in establishing its validity. The PFI has the potential to become an efficient and accurate way for school counselors to collect data from teachers about student performance.
Method
Initial Scale Development
The PFI was developed as a tool to gather data on students’ socio-emotional development from classroom teachers. The PFI includes 13 items on which teachers rate students’ abilities related to four construct-based standards: motivation, self-direction, self-knowledge and relationships (Squier et al., 2014). These four construct clusters are believed to be foundational for school success (Squier et al., 2014). Specific items within a cluster reflect constructs that have been identified by research to be strongly associated with achievement and success.
The PFI assessment was developed through a collaborative effort between the research team and a group of district-level elementary school administrators and teachers. The process of creating the instrument involved an extensive review of existing standards-based report cards, socio-emotional indicators related to different student developmental level, and rating scales measuring identified socio-emotional constructs. In addition, representatives from the district and members of the research team participated in a two-day summer workshop in August of 2013. These sessions included school counselors and teachers from each grade level, as well as a teacher of English language learners, a special education representative, and principals. All participants, except the principals, were paid for their time. Once the draft PFI instrument was completed, a panel of elementary teachers reviewed the items for developmental appropriateness and utility. The scale was then adopted across the district and piloted at all four (K–5) elementary schools during the 2013–2014 school year as a component of students’ report cards.
The PFI component of the report card consists of 13 questions, which are organized into four segments, based on the construct-based standards: motivation (4 items), self-direction (2 items), self-knowledge (3 items) and relationships (4 items). The items address developmentally appropriate skills in each of these domains (e.g., demonstrates perseverance in completing tasks, seeks assistance when needed, works collaboratively in groups of various sizes). The format for teachers to evaluate their students includes dichotomous response options: “on target” and “struggling.” All classroom teachers receive the assessment and the scoring rubric that corresponds to their grade level. The rubric outlines the observable behaviors and criteria that teachers should use to determine whether or not a student demonstrates expected, age-appropriate skills in each domain. Because the PFI instrument is tailored to address developmentally meaningful competencies, three rubrics were developed to guide teacher ratings at kindergarten and first grade, second and third grade, and fourth and fifth grade.
At the same time that the PFI scale was developed, the district began using a computer-based system to enter report card data. Classroom teachers complete the social-emotional section of the standards-based report card electronically at the close of each marking period, when they also evaluate students’ academic performance. The data collected can be accessed and analyzed electronically by school administrators and counselors. Additionally, data from two marking periods during the 2013–2014 school year were exported to the research team for analysis (with appropriate steps taken to protect students’ confidentiality). These data were used in the exploratory and confirmatory factor analyses described in this paper.
Sample
The PFI was adopted across all of the school district’s four elementary schools, housing grades kindergarten through fifth. All elementary-level classroom teachers completed the PFI for each of the students in their classes. The assessment was filled out three times during the 2013–2014 school year, namely in December, March and June. The data collected in the fall and winter terms were divided into two sections for analysis. Data from the December collection (N = 1,158) was used for the exploratory factor analysis (EFA) and data from the March collection was randomly divided into two subsamples (subsample A = 599 students and subsample B = 591 students) in order to perform the confirmatory factor analysis (CFA).
The sample for this study was highly diverse: 52% were African American, 17% were Asian, 11% were Hispanic, 16% were Caucasian, and the remaining students identified as multi-racial, Pacific Islander, Native Hawaiian, or Native American. In the EFA, 53.2% (n = 633) of the sample were male and 46.8% (n = 557) of the sample were female. Forty-seven kindergarten students (3.9%), 242 first-grade students (20.3%), 216 second-grade students (18.2%), 222 third-grade students (18.7%), 220 fourth-grade students (18.5%), and 243 fifth-grade students (20.4%) contributed data to the EFA.
The first CFA included data from 599 students, 328 males (54.8%) and 271 females (45.2%). The data included 23 kindergarten students (3.8%), 136 first-grade students (22.7%), 100 second-grade students (16.7%), 107 third-grade students (17.9%), 102 fourth-grade students (17.0%), and 131 fifth-grade students (21.9%). The data analyzed for the second CFA included assessments of 591 students, 305 males (51.6%) and 286 females (48.4%). The data consisted of PFI assessments from 24 kindergarten students (4.1%), 106 first-grade students (17.9%), 116 second-grade students (19.6%), 115 third-grade students (19.5%), 118 fourth-grade students (20.0%), and 112 fifth-grade students (19.0%).
Procedures
Classroom teachers completed PFI assessments for all students in their class at the close of each marking period using the rubrics described above. Extracting the data from the district’s electronic student data management system was orchestrated by the district’s information technology specialist in collaboration with members of the research team. This process included establishing mechanisms to ensure confidentiality, and identifying information was extracted from student records.
Data Analyses
The PFI report card data was analyzed in three phases. The first phase involved conducting an EFA at the conclusion of the first marking period. The second phase was to randomly select half of the data compiled during the second marking period and perform a confirmatory factor analysis. Finally, the remaining half of the data from the second marking period was analyzed through another CFA.
Phase 1. Exploratory factor analysis. An initial EFA of the 13 items on the survey instrument was conducted using the weighted least squares mean adjusted (WLSM) estimation with the oblique rotation of Geomin. The WLSM estimator appropriately uses tetrachoric correlation matrices if items are categorical (Muthén, du Toit, & Spisic, 1997). The EFA was conducted using Mplus version 5 (Muthén & Muthén, 1998–2007).
Model fit was assessed using several goodness-of-fit indices: comparative fit index (CFI), Tucker-Lewis Index (TLI), root mean square error of approximation (RMSEA), and standardized root mean square residual (SRMR). We assessed model fit based on the following recommended cutoff values from Hu and Bentler (1999): CFI and TLI values greater than 0.95, RMSEA value less than 0.06, and SRMR value less than 0.08.
Phase 2. First confirmatory factor analysis. An initial CFA was conducted on the 13 items from the instrument survey to assess a three-factor measurement model that was based on theory and on the results yielded through the exploratory analysis. Figure 1 provides the conceptual path diagram for the measurement model. Six items (3, 4, 6, 7, 11 and 13) loaded on factor one (C1), which is named “academic temperament.” Three items (8, 9 and 12) loaded on factor two (C2), which is referred to as “self-knowledge.” Four items (1, 2, 5 and 10) loaded on factor three (C3), which is titled “motivation.” All three latent variables were expected to be correlated in the measurement model.
This CFA was used to assess the measurement model with respect to fit as well as convergent and discriminant validity. Large standardized factor loadings, which indicate strong inter-correlations among items associated with the same latent variable, support convergent validity. Discriminant validity is evidenced by correlations among the latent variables that are less than the standardized factor loadings; that is, the latent variables are distinct, albeit correlated (see Brown, 2006; Kline, 2011; Schumacker & Lomax, 2010).
The computer program Mplus 5 (Muthén & Muthén, 1998-2007) was used to conduct the CFA with weighted least square mean and variance adjusted (WLSMV) estimation. This is a robust estimator for categorical data in a CFA (Brown, 2006). For the CFA, Mplus software provides fit indices of a given dimensional structure that can be interpreted in the same way as they are interpreted when conducting an EFA.
Phase 3. Second confirmatory factor analysis. A second CFA was conducted for cross-validation. This second CFA was conducted on the 13 items from the instrument survey to assess a three-factor measurement model that was based on the results yielded through the first confirmatory factor analysis. The same computer program and estimation tactics were used to conduct the second CFA.
Results
Phase 1. Exploratory Factor Analysis
Complete descriptive statistics for the responses to each of the 13 items are presented in Table 1. The response categories for all questions are dichotomous and also identified in Table 1 as “On Target” or “Struggling,” while incomplete data are labeled “Missing.” A total of 1,158 surveys were analyzed through the EFA. The decision to retain factors was initially guided by visually inspecting the scree plot and eigenvalues. The EFA resulted in two factors with eigenvalues greater than one (one-factor = 8.055, two-factor = 1.666, and three-factor = 0.869). In addition, the scree test also supported the idea that two factors were retained because two factors were left of the point where the scree plot approached asymptote. However, considering goodness-of-fit indices, the models specifying a three-factor structure and four-factor structure fit the data well. Methodologists have suggested that “underfactoring” is more problematic than “overfactoring” (Wood, Tataryn, & Gorsuch, 1996). Thus, there was a need to arrive at a factor solution that balanced plausibility and parsimony (Fabrigar, Wegener, MacCallum, & Strahan, 1999).
Methodologists (e.g., Costello & Osborne, 2005; Fabrigar et al., 1999) have indicated that when the number of factors to retain is unclear, conducting a series of analyses is appropriate. Therefore, two-, three-, and four-factor models were evaluated and compared to determine which model might best explain the data in the most parsimonious and interpretable fashion. In this case, the two-factor model was eliminated because it did not lend itself to meaningful interpretability. The four-factor model was excluded because one of the factors was related to only one item, which is not recommended (Fabrigar et al., 1999). Researchers evaluated models based on model fit indices, item loadings above 0.40 (Kahn, 2006), and interpretability (Fabrigar et al., 1999).
The three-factor measurement model fit the data well (RMSEA = 0.052, SRMR = 0.036, CFA = 0.994, TLI = 0.988, χ2 = 173.802, df = 42, p < 0.001). As shown in Table 2, the standardized factor loadings were large, ranging from 0.58 to 0.97. The first factor included six items. Items reflected students’ abilities at emotional self-control and students’ abilities to maintain good social relationships in school (e.g., demonstrates resilience after setbacks and works collaboratively in groups of various sizes). This first factor was named “academic temperament.”
The second factor included three items. All of the items reflected the understanding that students have about their own abilities, values, preferences and skills (e.g., identifies academic strengths and abilities and identifies things the student is interested in learning). This second factor was named “self-knowledge.” The third factor included four items. All of the items reflected personal characteristics that help students succeed academically by focusing and maintaining energies on goal-directed activities (e.g., demonstrates an eagerness to learn and engages in class activities). This third factor was named “motivation.” The three-factor measurement model proved to have parsimony and interpretability.
The two-factor model did not fit the data as well as the three-factor model (RMSEA = 0.072, SRMR = 0.058, CFA = 0.985, TLI = 0.978, χ2 = 371.126, df = 53, p < 0.001). As shown in Table 2, the standardized factor loadings were large, ranging from 0.59 to 0.94. The first factor included seven items. This first factor reflected self-knowledge and motivation. It was more appropriate to differentiate self-knowledge and motivation considering interpretability. The two-factor model provided relatively poor goodness-of-fit indices and interpretability.
The four-factor model fit the data slightly better than the three-factor model (RMSEA = 0.035, SRMR = 0.023, CFA = 0.998, TLI = 0.995, χ2 = 76.955, df = 32, p < 0.001). As shown in Table 2, the standardized factor loadings were large, ranging from 0.54 to 1.01. The first factor included one item, however, and retained factors should include at least three items that load 0.05 or greater (Fabrigar et al., 1999), so the first factor was removed. The second factor was comprised of six items that all relate to the construct of academic temperament. The third factor includes four items that reflect motivation. The fourth factor is composed of three items that relate to self-knowledge. The four-factor model was strong in terms of goodness-of-fit indices, though it was not possible to retain the first factor methodologically, due to the fact that it only involved one item. Therefore, given a series of analyses, the three-factor model was selected as the most appropriate.
Phase 2. First Confirmatory Factor Analysis
Complete descriptive statistics for the items are presented in Table 3. The responses for all items were dichotomous. A total of 569 (95.0%) of 599 surveys were completed and were used in the first CFA.
The three-factor measurement model provided good fit to the data (RMSEA = 0.059, CFI = 0.974, TLI = 0.984, χ2 = 104.849, df = 35, p < 0.001). Table 4 reports the standardized factor loadings, which
can be interpreted as correlation coefficients, for the three-factor model. The standardized factor loadings were statistically significant (p < 0.001) and sizeable, ranging from 0.72 to 0.94. The large standardized factor loadings support convergent validity in that each indicator was primarily related to the respective underlying latent variable. Table 5 reports the correlation coefficients among the three latent variables. The correlation coefficients were less than the standardized factor loadings, thus supporting discriminant validity.
Phase 3. Second Confirmatory Factor Analysis
Complete descriptive statistics for the items are presented in Table 3. The type of responses for all items was dichotomous. A total of 564 (95.4%) of 591 surveys had all the items complete and were used in the first CFA.
The second CFA was conducted on the three-factor measurement model to cross-validate the results from the first CFA. The three-factor model provided acceptable fit to the data in this second CFA (RMSEA = 0.055, CFI = 0.976, TLI = 0.983, χ2 = 100.032, df = 37, p < 0.001). Table 4 reports the standardized factor loadings, which can be interpreted as correlation coefficients, for the three-factor model. The standardized factor loadings were significantly large, ranging from 0.70 to 0.93. These large standardized factor loadings support convergent validity in that each indicator was largely related to the respective underlying latent variable. Table 5 reports the correlation coefficients among the three latent variables. The correlation coefficients were less than the standardized factor loadings so that discriminant validity was supported. Given these results, it appears that the three-factor model is the most reasonable solution.
Discussion
The ASCA National Model (2012) for school counseling programs underscores the value of using student achievement data to guide intervention planning and evaluation. This requires schools to find ways to collect valid and reliable information that provides a clear illustration of students’ skills in areas that are known to influence academic achievement. The purpose of developing the PFI was to identify and evaluate socio-emotional factors that relate to students’ academic success and emotional health, and to use the findings to inform the efforts of school counselors. The factor analyses in this study were used to explore how teachers’ ratings of students’ behavior on the 13-item PFI scale clustered around specific constructs that research has shown are connected to achievement and underlie many school counseling interventions. Because the scoring rubrics are organized into three grade levels (kindergarten and first grade, second and third grade, and fourth and fifth grade), the behaviors associated with each skill are focused at an appropriate developmental level. This level of detail allows teachers to respond to questions about socio-emotional factors in ways that are consistent with behaviors that students are expected to exhibit at different ages and grade levels.
Considering parsimony and interpretability, the EFA and two CFAs both resulted in the selection of a three-factor model as the best fit for the data. Through the EFA, we compared two-, three- and four-factor models. The three-factor model showed appropriate goodness-of-fit indices, item loadings and interpretability. Additionally, the two CFAs demonstrated cross-validation of the three-factor model. In this model, the fundamental constructs associated with students’ academic behavior identified are “academic temperament,” “self-knowledge,” and “motivation.” “Self-knowledge” and “motivation” correspond to two of the four construct clusters identified by Squier et al. (2014) as critical socio-emotional dimensions related to achievement. The “academic temperament” items reflected either self-regulation skills or the ability to engage in productive relationships in school. Squier et al. (2014) differentiated between self-direction (including emotional self-regulation constructs) and relationship skills clusters.
Although not perfectly aligned, this factor structure of the PFI is consistent with the CBA model for clustering student competencies and corresponds to previous research on the links between construct-based skills and academic achievement. Teacher ratings on the PFI seemed to reflect their perceptions that self-regulation abilities and good relationship skills are closely related constructs. These results indicate that the PFI may be a useful instrument for identifying elementary students’ strengths and needs in terms of exhibiting developmentally appropriate skills that are known to influence academic achievement and personal well-being.
Utility of Results
The factor analysis conducted in this study suggests that the PFI results in meaningful data that can allow for data-based decision making and evaluation. This tool has possible implications for school counselors in their efforts to provide targeted support, addressing the academic and socio-emotional needs of elementary school students. The PFI can be completed in conjunction with the academic report card and it is minimally time-intensive for teachers. In addition to school-based applications, the socio-emotional information yielded is provided to parents along with their child’s academic report card. This has the potential to support school–home connections that could prove useful in engaging families in interventions, which is known to be beneficial. Finally, the instrument can help school counselors identify struggling students, create small, developmentally appropriate groups based on specific needs, work with teachers to address student challenges that are prevalent in their classrooms, evaluate the success of interventions, advocate for program support, and share their work with district-level administrators. The PFI could come to be used like an early warning indicator to identify students who are showing socio-emotional development issues that predispose toward disengagement and underachievement.
The PFI also may prove useful as a school counseling evaluation measure. Changes on PFI items (and perhaps on subscales related to the three underlying dimensions identified in the present study) could be used as data in the evaluation of school counseling interventions and programs. Such evaluations would be tremendously facilitated by the availability of data that is both within the domain of school counselors’ work and that is known to be strongly related to achievement.
The findings offer great promise in terms of practical implications for school personnel and parents. This analysis quite clearly illustrates “academic temperament,” “self-knowledge” and “motivation” as factors that are demonstrated to be foundational to school success. The results indicate that the teachers’ ratings of students’ behavior align with findings of existing research and, thus, that the instrument is evaluating appropriate skills and constructs.
Implications for School Counselors
The PFI was developed as a data collection tool that could be easily integrated into schools for the purpose of assessing students’ development of skills that correspond to achievement-related constructs. Obtaining information about competencies that underlie achievement is critical for school counselors, who typically lead interventions that target such skills in an effort to improve academic outcomes. Many developmental school counseling curricula address skills that fall within the domains of “academic temperament,” “self-knowledge,” and “motivation” (see: http://www.casel.org/guide/programs for a complete list of socio-emotional learning programs). Teachers can complete the PFI electronically, at the same intervals as report cards and in a similarly user-friendly format. Therefore, the PFI facilitates communication between teachers and school counselors regularly throughout the school year. Counselors can use the data to identify appropriate interventions and to monitor students’ responsiveness to school counseling curricula over time and across settings. Although not included in this analysis, school counselors could also measure correlations between PFI competencies and achievement to demonstrate how academic outcomes are impacted by school counseling interventions and curricula.
Limitations and Further Study
Despite the promising findings on these factor analyses, further research is needed to confirm these results and to address the limitations of the present study. Clearly, additional studies are needed to confirm the reliability of PFI teacher ratings and future research should explore inter-rater reliability. Further research also is needed to determine if reliable and valid PFI subscales can be created based on the three dimensions found in the present study. Test-retest reliability, construct validity and subscale inter-correlations should be conducted to determine if PFI subscales with adequate psychometric characteristics can be created. Subsequent studies should consider whether students identified by the PFI as being in need of intervention also are found by other measures to be in need of support. Another important direction for future research is to examine the relationships between teachers’ ratings of students’ socio-emotional skills on the PFI and the students’ academic performance. Establishing a strong link between the PFI and actual academic achievement is an essential step to documenting the potential utility of the index as a screening tool. As this measure was developed to enhance data collection for data-based decision making, future research should explore school counselors’ experiences with implementation as well as qualitative reporting on the utility of PFI results for informing programming.
Although the present study suggests that the PFI in its current iteration is quite useful, practically speaking, researchers may consider altering the tool in subsequent iterations. One possible revision involves changing the format from dichotomous ratings to a Likert scale, which could allow for teachers to evaluate student behavior with greater specificity and which would benefit subscale construction. Another change that could be considered is evaluating the rubrics to improve the examples of student behavior that correspond to each rating on the scale and to ensure that each relates accurately to expectations at each developmental level. Furthermore, most of the items on the current PFI examine externalizing behaviors, which poses the possibility that students who achieve at an academically average level, but who experience more internalizing behaviors (such as anxiety), might not be identified for intervention. Subsequent iterations of the PFI could include additional areas of assessment, such as rating school behavior that is indicative of internalized challenges. Finally, it will be important to evaluate school counselors’ use of the PFI to determine if it actually provides necessary information for program planning and evaluation in an efficient, cost-effective fashion as is intended.
Conflict of Interest and Funding Disclosure
The authors reported no conflict of interest
or funding contributions for the development
of this manuscript.
References
American School Counselor Association. (2012). The ASCA National Model: A Framework for School Counseling
Programs (3rd ed.). Alexandria, VA: Author.
Brown, T. A. (2006). Confirmatory factor analysis for applied research. New York, NY: Guilford.
Costello, A. B., & Osborne, J. W. (2005). Best practices in exploratory factor analysis: Four recommendations for
getting the most from your analysis. Practical Assessment, Research & Evaluation, 10(7), 1–9.
Dimmitt, C., Carey, J. C., & Hatch, T. (Eds.) (2007). Evidence-based school counseling: Making a difference with data-driven practices. Thousand Oaks, CA: Corwin.
Fabrigar, L. R., Wegener, D. T., MacCallum, R. C., & Strahan, E. J. (1999). Evaluating the use of exploratory
factor analysis in psychological research. Psychological Methods, 4, 272–299.
doi:10.1037//1082-989X.4.3.272
House, R. M., & Martin, P. J. (1998). Advocating for better futures for all students: A new vision for school
counselors. Education, 119, 284–291.
Hu, L., & Bentler, P. M. (1999). Cutoff criteria for fit indexes in covariance structure analysis: Conventional
criteria versus new alternatives. Structural Equation Modeling, 6, 1–55. doi:10.1080/10705519909540118
Kahn, J. H. (2006). Factor analysis in counseling psychology research, training, and practice – principles,
advances, and applications. The Counseling Psychologist, 34, 684–718. doi:10.1177/0011000006286347
Kline, R. B. (2011). Principles and practice of structural equation modeling (3rd ed.). New York, NY: Guilford.
Martin, I., & Carey, J. (2014). Development of a logic model to guide evaluations of the ASCA National Model
for School Counseling Programs. The Professional Counselor, 4, 455–466. doi:10.15241/im.4.5.455
Muthén, B. O., du Toit, S. H. C., & Spisic, D. (1997). Robust inference using weighted least squares and
quadratic estimating equations in latent variable modeling with categorical and continuous
outcomes. Psychometrika, 75, 1–45.
Muthén, L. K., & Muthén, B. O. (1998–2007). Mplus user’s guide (5th ed.). Los Angeles, CA: Muthén & Muthén.
Poynton, T. A., & Carey, J. C. (2006). An integrative model of data-based decision making for school
counseling. Professional School Counseling, 10, 121–130.
Schumacker, R. E., & Lomax, R. G. (2010). A beginner’s guide to structural equation modeling (3rd ed.). New York,
NY: Routledge.
Sink, C. A. (2009). School counselors as accountability leaders: Another call for action. Professional School
Counseling, 13, 68–74. doi:10.5330/PSC.n.2010-13.68
Squier, K. L., Nailor, P., & Carey, J. C. (2014). Achieving excellence in school counseling through motivation, self-
direction, self-knowledge and relationships. Thousand Oaks, CA: Corwin.
Wood, J. M., Tataryn, D. J., & Gorsuch, R. L. (1996). Effects of under-and overextraction on principle axis factor
analysis with varimax rotation. Psychological methods, 1, 354–365. doi:10.1037//1082-989X.1.4.354
Gwen Bass is a doctoral researcher at the Ronald H. Fredrickson Center for School Counseling Outcome Research at the University of Massachusetts. Ji Hee Lee is a doctoral student at Korea University in South Korea and Center Fellow of the Ronald H. Frederickson Center for School Counseling Outcome Research at the University of Massachusetts. Craig Wells is an Associate Professor at the University of Massachusetts. John C. Carey is a Professor of School Counseling and the Director of the Ronald H. Frederickson Center for School Counseling Outcome Research at the University of Massachusetts. Sangmin Lee is an Associate Professor at Korea University. Correspondence can be addressed to Gwen Bass, School of Cognitive Science, Adele Simmons Hall, Hampshire College, 893 West Street, Amherst, MA 01002, gjbass@gmail.com.