Sep 16, 2016 | Article, Volume 6 - Issue 3
Christopher T. Belser, M. Ann Shillingford, J. Richelle Joe
The American School Counselor Association (ASCA) National Model and a multi-tiered system of supports (MTSS) both provide frameworks for systematically solving problems in schools, including student behavior concerns. The authors outline a model that integrates overlapping elements of the National Model and MTSS as a support for marginalized students of color exhibiting problem behaviors. Individually, the frameworks employ data-driven decision making as well as prevention services for all students and intervention services for at-risk students. Thus, the integrated model allows schools to provide objective alternatives to exclusionary disciplinary actions (e.g., suspensions and expulsions) that are being assigned to students of color at a disproportionate rate. The manuscript outlines the steps within the integrated model and provides implications for school counselors and counselor educators.
Keywords: ASCA National Model, multi-tiered system of supports, school counselors, marginalized students, students of color
Educational disparities are well documented for students of color in the United States (Delpit, 2006; Ford & Moore, 2013; U.S. Department of Education [USDOE], 2014). Today’s students of color are facing lower graduation rates, overuse of exclusionary disciplinary action, overrepresentation in exceptional education programming and school policies that negatively impact students of color rather than support them (Moore, Henfield, & Owens, 2008; USDOE, 2014; R. Palmer & Maramba, 2010; Toldson & Lewis, 2012). School discipline policies based on a framework of zero tolerance have not reduced suspensions or expulsions as initially intended. Instead, these policies have resulted in more students being excluded from the classroom due to reactive disciplinary action (Skiba, 2014). Bernstein (2014) posited that these policies are increasing the educational achievement gap and negatively impacting the development of students of color. What then can be done as an alternative to or as a measure to prevent exclusionary disciplinary actions such as suspensions and expulsions?
A multi-tiered system of supports (MTSS) is a systematic data-driven program designed to address academic concerns and problem behavior by utilizing both prevention and intervention strategies (Sugai & Horner, 2009). Specific to behavior-related concerns, MTSS programs offer a structured method for providing both universal and individual support for students and present data-driven alternatives to suspension and expulsion. School counselors are uniquely positioned to play a critical role in the implementation of such programs due to their training in data analysis, program development and direct service delivery. Moreover, MTSS programs align well with the American School Counselor Association (ASCA) National Model (2012a).
The ASCA National Model has themes of social justice, advocacy and systemic change infused throughout, as comprehensive school counseling programs are designed to remove barriers to student success and help students reach their potential in the areas of academic, career, social and emotional development (ASCA, 2012a). With these themes in mind, integrating the National Model with the objective and data-driven framework of MTSS may offer one solution for systemic educational disparities such as the school-to-prison pipeline. The purpose of this article is to describe a model for integrating elements of the ASCA National Model within the MTSS framework. The authors will describe steps involved in the process and will provide context for how such an intervention can specifically benefit students of color.
The School-to-Prison Pipeline
More than 6.8 million individuals were under supervision of the adult correctional system in the United States at the end of 2014, a rate of 1 in 36 adults (Kaeble, Glaze, Tsoutis, & Minton, 2015). Of those under correctional supervision, over 1.5 million were held in state and federal correctional facilities (Carson, 2015). Although these numbers mark a slight decrease in the correctional population since 2007 (Kaeble et al., 2015), the American incarceration rate has quadrupled since the 1970s (Travis, Western, & Redburn, 2014). The growth of incarceration in the United States over the past four decades has largely affected the Black and Latino communities, both of which are disproportionately represented among individuals involved with the correctional system (Carson, 2015). Scholars in multiple academic disciplines have linked American drug policy and enforcement with mass incarceration of primarily individuals of color (Alexander, 2010; Travis et al., 2014). In education, however, a parallel cause has contributed to the expansion of the correctional system in the United States. Increasingly punitive discipline policies marked by zero tolerance approaches have created a pipeline from schools to prisons where exclusion from the educational environment and criminalization of student misbehavior contribute to school dropout and involvement with the juvenile justice system (Fowler, 2011).
The effects of this school-to-prison pipeline have been particularly detrimental for students of color, who are disproportionately suspended, expelled or otherwise excluded from the academic setting. Starting in preschool, Black children are suspended at a higher rate than their White counterparts (USDOE, 2014). Whereas 5% of White students are suspended, three times as many Black students are suspended on average (USDOE, 2014). Additionally, American Indian and Native-Alaskan students, who are less than 1% of the population in American schools, account for 2% of out-of-school suspensions and 3% of expulsions. Both gender and disability intersect with race and ethnicity, resulting in disproportionate suspensions of boys and girls of color and students with disabilities (USDOE, 2014). Among students with disabilities, those with emotional-behavioral disorders are most likely to experience academic exclusion and to experience such exclusion multiple times (Bowman-Perrott et al., 2011). Double minority status can increase the likelihood of exclusion, such as with Black males who are consistently over-identified in special education (Artiles, Harry, Reschly, & Chinn, 2002; Bowman-Perrott et al., 2011; Ferri & Connor, 2005).
Similar disparities exist among the rates of arrests and referrals to law enforcement for Black students and students with disabilities. Although only 16% of the student population, Black students account for 31% of school-related arrests and 27% of referrals to law enforcement (USDOE, 2014). Similarly, students with disabilities, which comprise about 12% of the student population, represent 25% of students arrested or referred to law enforcement (USDOE, 2014). School-related arrests and referrals to law enforcement can place students at risk for future involvement with the juvenile justice system and ultimately prison. Carmichael, Whitten, and Voloudakis’s (2005) investigation of minority overrepresentation in the juvenile justice system of Texas indicated that students with a disciplinary history were more likely to be involved with juvenile justice. Although this was the case for youth in all categories of race and ethnicity, both Latino and Black youth had more frequent contact with the justice system than White youth (Carmichael et al., 2005). Demonstrating the cumulative effect of involvement with the juvenile system, Natsuaki, Ge, and Wenk’s (2008) longitudinal study of young male offenders identified age of first arrest as an indicator of criminal trajectory with a younger age producing a steeper cumulative trajectory. Additionally, for those first arrested early during their adolescent years, the pace at which they committed criminal offenses was not slowed by completion of high school (Natsuaki et al., 2008). Hence, when school discipline policies result in the exclusion of students from the educational setting and involvement with law enforcement, students are likely to be involved with the justice system as juveniles and adults (Natsuaki et al., 2008; USDOE, 2014; Wiesner, Kim, & Capaldi, 2010).
The American School Counselor Association National Model
ASCA developed a National Model (2012a) in order to provide school counselors with clear guidelines on how to meet the needs of all students. The ASCA National Model boasts a comprehensive, data-driven approach to meeting the needs of students and focuses on addressing students’ academic, personal, social and career needs. The model is driven by a key question: “How are students different as a result of what school counselors do?” Considering the data presented on the school-to-prison pipeline, this question is significant in ensuring that school counselors are providing students of color with the necessary support systems in order to foster more positive academic and social outcomes.
The National Model highlighted a collaborative approach centered on incorporating the efforts of teachers, administrators, families and other stakeholders in developing a comprehensive school counseling program. With school counselors at the helm, the model provided a new vision for the profession and emphasized school counselor accountability, leadership, advocacy, collaboration and systemic change (ASCA, 2012a). That is, the focus shifted to elevating the function of the school counseling program to align more readily with the mission of the school at large.
As a result of this new vision, school counseling programs have been able to observe significant improvements in students’ academic as well as social performance. For instance, L. Palmer and Erford (2012) found increases in high school attendance and graduation trends as the school counseling program implementation was increased. L. Palmer and Erford also reported positive changes in the academic performance of high school students, particularly improvements on Maryland State Assessment English and algebra scores. These results suggested optimistic influences of utilizing a comprehensive school counseling program as promoted by the National Model. Similarly, Carey and Dimmitt (2012) reported positive associations between the delivery of the comprehensive school counseling program and student performance; most specifically, rates of student suspensions and other disciplinary actions decreased, attendance increased, and math and reading proficiency improved. Dimmit and Wilkerson (2012) found that minority students were less likely to have access to comprehensive school counseling programs in their schools but noted correlations between an increase in counseling services and improved attendance, a decrease in suspensions, and a drop in reports of bullying. Similarly, Lapan, Whitcomb, and Aleman (2012) noted that schools with low counselor-to-student ratios and fully implemented ASCA Model programming had lower rates of suspension and fewer discipline issues.
Although much has been written on the benefits of school counselors addressing academic, personal, social and career development of students, there appears to be a paucity of research studies focused on the topic of college and career readiness of students of color. In terms of recommendations for school counselors and career development, Mayes and Hines (2014) discussed the need for more culturally sensitive and gendered approaches to college and career readiness for gifted Black females, including assisting these students in navigating through systemic and even social challenges that they may face. Similarly, Belser (2015) highlighted the impact that the school-to-prison pipeline has on career opportunities later in life for adolescent males of color. Considering the challenges that students face, especially those from marginalized populations, as well as the significant benefits of data-driven comprehensive school counseling programs, it seems appropriate that school counselors utilize the National Model as the foundation for stimulating more positive student outcomes.
Multi-Tiered System of Supports (MTSS)
Initially framed as Response to Intervention (RTI), the implementation of MTSS resulted from federal education initiatives after the 2004 reauthorization of the Individuals with Disabilities Education Improvement Act (IDEA), which called for more alignment between this policy and the No Child Left Behind Act (NCLB) of 2001 (Sugai & Horner, 2009). MTSS programs in schools are designed to provide a more systematic, data-driven and equitable approach to solving academic and behavioral issues with students. Within such programs, students are divided into three tiered categories based on the level of risk and need: (a) Tier 1 represents students who are in the general education population and who are thriving, (b) Tier 2 represents students who need slightly more intensive intervention that can be delivered both individually or in a small group setting, and (c) Tier 3 represents students who need intensive individualized interventions (Ockerman, Mason, & Hollenbeck, 2012). The process involves universal screening or testing, intervention implementation and progress monitoring.
To combat problem behaviors, MTSS is often linked to Positive Behavioral Interventions and Supports (PBIS) as an additional source of support for students. These programs have shown to reduce office disciplinary referrals and increase attendance (Freeman et al., 2016). Moreover, Horner, Sugai, and Anderson (2010) determined that PBIS programs are associated with reductions in problem behaviors, improved perception of school safety and improved academic results. Banks and Obiakor (2015) provided strategies for implementing culturally responsive positive behavior supports in schools, noting that doing so can reduce the marginalization of minority students and foster a safe and supportive school climate. With outcomes such as these, PBIS and MTSS programs have become known as best practices (Horner et al., 2010).
Several authors have noted the overlapping elements of MTSS and the ASCA National Model (ASCA, 2012a; Martens & Andreen, 2013; Ockerman et al., 2012). As both frameworks have yielded positive outcomes with the general population and minority students, it would appear that a coordinated approach would be beneficial for schools. However, existing discussions of how to integrate the two have not been comprehensive in their discussion or have not addressed the potential impact on students of color. In this manuscript, the authors have sought to provide a solution to this problem.
Putting MTSS and Comprehensive School Counseling Programs Into Practice
Integrating the ASCA National Model with MTSS involves strategic data-driven planning and decision making. The process begins with collecting baseline data on students via screening scales and surveys and then analyzing this data to group students into tiers based on indicated level of risk. A more objective approach driven by data could especially benefit students of color, who have historically been subject to disproportionate and—at times—unfair discipline policies (Hoffman, 2012). Once students have been placed in one of three MTSS tier groups, the decision-making team and school counselors can generate appropriate prevention and intervention strategies that fit with each tier and with students’ needs. The process is cyclical, as progress-monitoring data is collected periodically to determine future steps. Figure 1 outlines the process from start to finish, and the sections that follow will further highlight the phases of the process. In addition, the authors will address how these steps can affect students of color.

Figure 1. The MTSS Cycle for Behavior Intervention
Team Development and Planning
The process of providing MTSS services is not a job for a single person; rather, a team of stakeholders (e.g., school counselors, administrators, teachers) must be involved in planning, enacting and evaluating the services and interventions utilized. With the integration of the ASCA National Model within MTSS, school counselors can utilize elements of the model, such as the Advisory Council and the Annual Agreement, to aid in the planning process (ASCA, 2012a). Each member of the team provides a unique role, from direct service delivery to data management. School counselors should be mindful of their numerous other duties within the school and only take the lead on program components that are appropriate and directly relate to the role of school counselors in schools (ASCA, 2014; Ockerman et al., 2012).
In the planning phase, the team should examine preliminary discipline-related data to gauge what types of universal supports might be necessary; within this conversation, understanding the school’s demographic data is crucial so the team can account for potential culture-bound concerns that may need to be addressed during the MTSS process. Additionally, the team should determine what instrument will be used for universal screening, a process that will be discussed in more detail in the next section. Once the team has a preliminary plan of action, including a timeline of key events, this information should be presented to the entire school faculty to provide a rationale for the services and procedural information to boost fidelity of implementation, especially with program elements implemented schoolwide like universal screening.
Universal Screening
Data collection through universal assessment is a necessary step to the MTSS process (Harn, Basaraba, Chard, & Fritz, 2015; von der Embse, Pendergast, Kilgus, & Eklund, 2015). School counselors often rely on referrals from teachers, parents and students to match students with interventions; however, integrating a universal screening approach to comprehensive school counseling programs can help mitigate students falling through the cracks (Ockerman et al., 2012). Universal screening involves all students being evaluated using one instrument, such as the Student Risk Screening Scale (SRSS; Drummond, 1994), which allows a decision-making team to categorize students based on level of risk for the respective issue. Cheney and Yong (2014) noted that a universal screening instrument should be time efficient for teachers to complete and should be both valid and reliable; they further noted that the purpose of such a screening tool is to identify which students warrant interventions beyond Tier 1 supports (i.e., Tier 2 and 3 interventions).
Various instruments exist for universal screening of behavior or emotional risk (Lane, Kalberg, et al., 2011). The SRSS (Drummond, 1994) is one freely available screening instrument that allows teachers to rate an entire class of students quickly on seven behavioral or social subscales. This tool fits well into an MTSS framework as the scoring places students into a category of low, moderate, or high levels of risk (Lane et al., 2015); in addition, researchers have established validity and reliability for the SRSS at the elementary (Lane et al., 2012), middle (Lane, Oakes, Carter, Lambert, & Jenkins, 2013), and high school levels (Lane, Oakes, et al., 2011), as well as in urban elementary schools (Ennis, Lane, & Oakes, 2012). Other universal screening instruments that support the MTSS framework for behavior-related concerns include the Behavioral and Emotional Screening System (BESS; Kamphaus & Reynolds, 2007), the Systematic Screening for Behavioral Disorders (SSBD; Walker & Severson, 1992), and the Social, Academic, and Emotional Behavioral Risk Screener (SAEBRS; von der Embse et al., 2015).
Procedurally, the process of conducting a universal screening at a school would need to be driven by a collaborative faculty team with heavy administrative support. Carter, Carter, Johnson, and Pool (2012) described steps that educators took at one school to identify students for Tier 2 and 3 interventions and beyond. Within their process, faculty members would complete the screening instrument on a class of students whom they see regularly (e.g., a homeroom class). Ideally, multiple faculty members would complete the instrument on a single class to provide multiple data points on each student as a means of reducing teacher bias; in such an instance, the scores could be averaged together. Once the screening process is complete, the MTSS team (or whatever team has been assembled for this purpose) can view the compiled data to identify at-risk students. The faculty team can then sort and view this data easily by students’ scores on the instrument to reveal which students are most at risk based on the assessment. The final step in this process is to place students within one of the three MTSS tiers based on the results of the universal screening instrument. After this process is complete, the school counselors and the team can design interventions for students at each level. The faculty team may find it useful to consult other school discipline data points (e.g., office disciplinary referrals and suspensions) as additional baseline measures for students identified as needing Tier 2 or Tier 3 interventions. However, the team should keep in mind that these disciplinary actions have historically been applied to students of color, particularly Black males, at a disproportionate rate; thus, these data points may not be in line with the goal of using a more objective measurement strategy (Hoffman, 2012).
Tiering and Intervention
Whereas school counselors can be an integral part of the universal screening process, they can also be a driving force with direct service delivery for students at all three MTSS tiers (Ockerman et al., 2012). The ASCA National Model (2012a) highlighted the overlapping nature of the model’s direct student services component to the three tiers of the MTSS model. The following sections will highlight the connections between the three MTSS tiers and the levels of service delivery within comprehensive school counseling programs; moreover, the authors will convey strategies and interventions that may be especially helpful for students of color facing social and behavioral concerns.
Tier 1. Tier 1 instruction or intervention takes place in the general education environment and is presented universally to students (Harn et al., 2015). Two programs commonly used at this level are PBIS and Social-Emotional Learning (Cook et al., 2015). However, Ockerman et al. (2012) noted that some elements of comprehensive school counseling programs (e.g., schoolwide interventions, large group interventions and the counseling core curriculum) fall within the first tier, as they are designed to target all or most students. For example, school counselors can partner with administrators and teachers to develop or adopt a data-driven PBIS program that integrates classroom lessons (e.g., character education) and schoolwide programming (e.g., an anti-bullying rally or positive behavior reward events). Additionally, school counselors can align their counseling curriculum with the goals of the MTSS or PBIS program and create lessons or units that support these goals. Potential topics for these lessons or units include social skills, conflict resolution, respecting diversity and differences in others, and managing one’s anger. School counselors can gather needs assessment data from students, teachers, parents and other stakeholders to determine which topics may be of most benefit to students. Tier 1 interventions are designed to effectively serve approximately 80–85% of students (Martens & Andreen, 2013).
Tier 2. Tier 2 interventions are enacted for students whose needs are not being met by Tier 1 services and may include a variety of interventions such as the following: (a) targeted interventions, (b) group interventions, and (c) individualized interventions for less problematic behaviors (Newcomer, Freeman, & Barrett, 2013). School counselors may be involved with any or all of these types of interventions but are more likely to provide direct services to students through small group interventions and individualized interventions for minor problem behaviors. The MTSS decision-making team should evaluate data from the universal screening process to determine which students may need a Tier 2 support and what type of intervention that should be. For example, after the first author compiled data from the SRSS at his middle school, he and his team evaluated the scores of students who fell in the moderate risk range to determine what interventions (e.g., small group counseling, behavior contract, Check-in/Check-out) would be appropriate for each student. Unlike Tier 1 supports, Tier 2 interventions should not be one-size-fits-all, but driven by the needs of each unique student.
Small group counseling. As students of color have been subject to disproportionate use of exclusionary disciplinary actions (e.g., in-school or out-of-school suspensions), school counselors and the decision-making team should utilize Tier 2 interventions that promote alternatives to suspension and help re-engage students with prosocial behaviors. Group counseling interventions can be more psychoeducational in nature (e.g., anger management, social skills development, conflict resolution, problem solving) or can be geared more toward personal growth and exploration of students’ feelings and concerns about everyday problems (Gladding, 2016). Regardless of the type of group, school counselors should foster an environment where students can openly express themselves and simultaneously work on an individual goal. Safety, trust and universality within the group may be especially helpful for marginalized students, as they can often feel disenfranchised from the school environment because of exclusionary discipline practices (Caton, 2012; Gladding, 2016).
Individualized interventions. Some students are not appropriate for counseling groups or their presenting issues do not warrant a group intervention. For these students, an individual approach to Tier 2 interventions is necessary. Two commonly used strategies are Check-in/Check-out and behavior contracts. Check-in/Check-out is a structured method for providing students with feedback regarding their behavior with higher frequency (Crone, Hawken, & Horner, 2010). With this strategy, students “check-in” with a designated faculty member in the morning as a source of encouragement and non-contingent attention, receive a behavior report card that is carried with them throughout their day for teachers to record feedback, and “check-out” with the same faculty member at the end of the day to evaluate progress and possibly receive a reward. The report card can then be taken home to parents as a form of home–school collaboration (Maggin, Zurheide, Pickett, & Baillie, 2015). Check-in/check-out has been shown to be an intervention that successfully prevents escalation of student behavior and reduces disciplinary referrals (Maggin et al., 2015; Martens & Andreen, 2013). Moreover, it also helps students build a positive relationship with school staff members.
Behavior contracts have a similar approach but also take the form of a less intensive behavior intervention plan (BIP). With both approaches, the report card or behavior tracking form should be modified based on the developmental and behavioral needs of the student. The first author utilized an approach that integrated both of these interventions, and each identified student was matched with an adult with whom they had a trusting relationship who acted as their designated check-in/check-out person. Students receiving an individual intervention also may benefit from small group counseling as an additional support. If Tier 2 interventions are unsuccessful in mitigating students’ problem behaviors, the team’s attention should shift to Tier 3 interventions.
Tier 3. Tier 3 interventions are appropriate for students identified as highly at risk by the universal screening and students who have not responded positively to Tier 2 interventions. As with Tier 2 interventions, school counselors’ roles with Tier 3 interventions may vary, ranging from a supporting or consultative role to directly delivering interventions. Counseling interventions at this level include individual counseling, one-on-one mentoring, or referrals to community agencies for more intensive services (Ockerman et al., 2012). School counselors should keep in mind that ASCA has identified providing long-term individual counseling as an inappropriate role for school counselors (ASCA, 2012a) due to time constraints and lack of resources. As such, referrals to community agencies may be most helpful in supporting students in need of more intensive one-on-one counseling services.
Behavior intervention plans are another Tier 3 strategy to mitigate more severe problem behaviors (Bohanon, McIntosh, & Goodman, 2015). Lo and Cartledge (2006) found that conducting functional behavioral assessments (FBAs) and creating BIPs was a successful intervention for reducing problem behaviors and increasing replacement behaviors in elementary-aged Black males. Whether through counseling intervention or intensive behavior support, structured Tier 3 interventions can provide alternatives to suspensions, which is especially helpful for students of color as previously discussed.
Progress Monitoring
The MTSS process does not end with universal screening or service delivery; the decision-making team must have a clear and systematic plan for monitoring student outcomes. Carter et al. (2012) recommended administering the universal screening tool at least twice during the school year to evaluate progress. By taking such action, the decision-making team can determine which students are responding well to interventions and which students are not. Those students responding well to Tier 2 or 3 interventions may be moved down to Tier 1, whereas those not responding well to Tier 1 or 2 may be moved up a tier. Students not responding to Tier 3 interventions may warrant additional behavioral or psychological assessment to determine if further services are more appropriate (Ockerman et al., 2012). Progress monitoring also can provide clues about the efficacy of an intervention or the fidelity of its implementation. For example, if only one student in a class is responding to a Tier 1 intervention, the team may want to evaluate the delivery of that intervention for that class or consider an alternative intervention. A primary benefit of utilizing a data-driven progress monitoring approach is that it allows for objective decision making based on data, rather than subjective decision making that may be influenced by bias.
Implications for School Counselors
In line with the ASCA National Model (2012a), school counselors are called to be advocates and agents of systemic change in their schools. Part of this calling includes implementing comprehensive school counseling programs that address inequities within the school and provide programming to address the achievement gap. As has been discussed previously, integrating MTSS and the National Model can be especially helpful for students of color who have historically been subject to bias within discipline policies and procedures, resulting in disproportionate rates of disciplinary action. School counselors acting as advocates and agents of change should be proactive in analyzing school data to determine whether these inequities are at play and must be vocal about the need to solve these problems if they do exist at their schools (ASCA, 2012b).
As such, school counselors should ensure that they are versed in best practices such as MTSS that have been shown to positively impact racial and cultural inequities. However, school counselors cannot solve the problem alone. The other two themes of the ASCA National Model (2012a)—leadership, and collaboration and teaming—are also critically important if school counselors are to implement such programs. With training in data analysis, program development and direct service implementation, school counselors are uniquely positioned to take on leadership roles with regard to MTSS programming. However, they also should recognize their roles as collaborators and team members for program elements that do not directly fall within the role of school counselors (Ockerman et al., 2012).
Implications for Counselor Educators and Researchers
As stakeholders charged with training the next generation of school counselors, counselor educators must remain versed in newer topics within school counseling and education. Although PBIS has been around since 1997, MTSS is still a relatively new concept, especially when integrated with the ASCA National Model. School counselor educators should ensure that coursework prepares future school counselors to engage in such programming. More specifically, school counselor preparation courses should include discussion and application of MTSS, data analysis, program evaluation, behavior interventions and other concepts that are vital to coordinating ASCA Model programming. At the same time, counselor educators also must empower graduate students to become advocates for marginalized students at their future schools and for themselves as professionals. Because there is little research available that evaluates the integration of MTSS and ASCA Model programming, it is imperative that school counselors and counselor educators collaborate to conduct such research.
Conclusion
Research on the school-to-prison pipeline has demonstrated an unfortunate link between the criminal justice system and K–12 disproportionate disciplinary practices faced by students of color. An integrated system including a multi-tiered system of supports and the ASCA (2012a) National Model has been introduced in this manuscript to address disciplinary concerns in a more systemically balanced manner. MTSS and the ASCA National Model utilize a similar data-driven structured approach to solving issues related to academic and behavioral concerns. When integrated, the overlapping elements of each framework can provide an avenue for addressing key concerns for students of color exhibiting problem behaviors. Rather than relying on disciplinary procedures that may result in students being excluded from class, an approach integrating frameworks of prevention and intervention can provide a much-needed alternative. The framework provided herein details steps that school counselors and other educators can take to address the school-to-prison pipeline. In order to best support marginalized students, school counselors must heed the call to leadership, advocacy, collaboration and systemic change given by the National Model; moreover, joining forces with other educators through collaborative efforts such as MTSS can only strengthen the effort to best support the success of all students.
Conflict of Interest and Funding Disclosure
The authors reported no conflict of interest or funding contributions for the development of this manuscript.
References
Alexander, M. (2010). The new Jim Crow: Mass incarceration in the age of colorblindness. New York, NY: The New Press.
American School Counselor Association. (2012a). The ASCA national model: A framework for school counseling programs (3rd ed.). Alexandria, VA: Author.
American School Counselor Association. (2012b). ASCA school counselor competencies. Retrieved from https://www.schoolcounselor.org/asca/media/asca/home/SCCompetencies.pdf
American School Counselor Association. (2014). The school counselor and multitiered system of supports. Retrieved from http://www.schoolcounselor.org/asca/media/asca/PositionStatements/
PS_MultitieredSupportSystem.pdf
Artiles, A. J., Harry, B., Reschly, D. J., & Chinn, P. C. (2002). Over-identification of students of color in special education: A critical overview. Multicultural Perspectives, 4, 3–10. doi:10.1207/s15327892mcp0401_2
Banks, T., & Obiakor, F. E. (2015). Culturally responsive positive behavior supports: Considerations for practice. Journal of Education and Training Studies, 3(2), 83–90. doi:10.11114/jets.v3i2.636
Belser, C. T. (2015). African American males: A career and college readiness crisis. In J. R. Curry & M. A. Shillingford (Eds), African American students’ career and college readiness: The journey unraveled (pp. 279–307). Washington, DC: Lexington Books.
Bernstein, N. (2014). Burning down the house: The end of juvenile prison. New York, NY: The New Press.
Bohanon, H., McIntosh, K., & Goodman, S. (2015). Integrating academic and behavior supports within an RtI framework, part 4: Tertiary supports. Retrieved from http://www.rtinetwork.org/learn/behavior-supports/integrating-academic-and-behavior-supports-tertiary-supports
Bowman-Perrott, L., Benz, M. R., Hsu, H.-Y., Kwok, O.-M., Eisterhold, L. A., & Zhang, D. (2011). Patterns and predictors of disciplinary exclusion over time: An analysis of the SEELS national data set. Journal of Emotional and Behavioral Disorders, 21(2), 83–96. doi:10.1177/1063426611407501
Carey, J., & Dimmitt, C. (2012). School counseling and student outcomes: Summary of six statewide studies. Professional School Counseling, 16, 146–153. doi:10.5330/PSC.n.2012-16.146
Carmichael, D., Whitten, G., & Voloudakis, M. (2005). Study of minority over-representation in the Texas juvenile justice system: Final report. College Station, TX: Public Policy Research Institute at Texas A&M University.
Carson, E. A. (2015). Prisoners in 2014. Retrieved from http://www.bjs.gov/index.cfm?ty=pbdetail
&iid=5387
Carter, D. R., Carter, G. M., Johnson, E. S., & Pool, J. L. (2012). Systematic implementation of a Tier 2
behavior intervention. Intervention in School and Clinic, 48, 223–231. doi:10.1177/1053451212462879
Caton, M. T. (2012). Black male perspectives on their educational experiences in high school. Urban Education, 47, 1055–1085. doi:10.1177/0042085912454442
Cheney, D. A., & Yong, M. (2014). RE-AIM checklist for integrating and sustaining Tier 2 social-behavioral interventions. Intervention in School and Clinic, 50, 39–44. doi:10.1177/1053451214532343
Cook, C. R., Frye, M., Slemrod, T., Lyon, A. R., Renshaw, T. L., & Zhang, Y. (2015). An integrated approach to universal prevention: Independent and combined effects of PBIS and SEL on youths’ mental health. School Psychology Quarterly, 30, 166–183. doi:10.1037/spq0000102
Crone, D. A., Hawken, L. S., & Horner, R. H. (2010). Responding to problem behavior in schools: The behavior education program (2nd ed.). New York, NY: Guilford Press.
Delpit, L. (2006). Other people’s children: Cultural conflict in the classroom. New York, NY: Norton.
Dimmitt, C., & Wilkerson, B. (2012). Comprehensive school counseling in Rhode Island: Access to services and student outcomes. Professional School Counseling, 16, 125–135. doi:10.5330/PSC.n.2012-16.125
Drummond, T. (1994). The Student Risk Screening Scale (SRSS). Grants Pass, OR: Josephine County Mental Health Program.
Ennis, R. P., Lane, K. L., & Oakes, W. P. (2012). Score reliability and validity of the student risk screening scale: A psychometrically sound, feasible tool for use in urban elementary schools. Journal of Emotional and Behavioral Disorders, 20, 241–259. doi:10.1177/1063426611400082
Ferri, B. A., & Connor, D. J. (2005). In the shadow of Brown: Special education and overrepre-sentation of students of color. Remedial and Special Education, 26, 93–100. doi:10.1177/07419325050260020401
Ford, D. Y., & Moore, J. L., III. (2013). Understanding and reversing underachievement, low achievement, and achievement gaps among high-ability African American males in urban school contexts. Urban Review, 45, 399–415. doi:10.1007/s11256-013-0256-3
Fowler, D. (2011). School discipline feeds the pipeline to prison. Phi Delta Kappan, 93(2), 14–19. doi:10.1177/003172171109300204
Freeman, J., Simonsen, B., McCoach, D. B., Sugai, G., Lombardi, A., & Horner, R. (2016). Relationship between school-wide positive behavior interventions and supports and academic, attendance, and behavior outcomes in high schools. Journal of Positive Behavior Intervention, 18, 41–51. doi:10.1177/1098300715580992
Gladding, S. (2016). Groups: A counseling specialty (7th ed.). Upper Saddle River, NJ: Prentice-Hall.
Harn, B., Basaraba, D., Chard, D., & Fritz, R. (2015). The impact of schoolwide prevention efforts: Lessons learned from implementing independent academic and behavior support systems. Learning Disabilities: A Contemporary Journal, 13, 3–20. doi:10.1177/0022219407313588
Hoffman, S. (2012). Zero benefit: Estimating the effect of zero tolerance discipline policies on racial disparities in school discipline. Education Policy, 28, 69–95. doi:10.1177/0895904812453999
Horner, R. H., Sugai, G. M., & Anderson, C. M. (2010). Examining the evidence base for school-wide positive behavior support. Focus on Exceptional Children, 42(8), 1–14.
Kaeble, D., Glaze, L. E., Tsoutis, A., & Minton, T. D. (2015). Correctional populations in the United States, 2014. Retrieved from http://www.bjs.gov/index.cfm?ty=pbdetail&iid=5519
Kamphaus, R. W., & Reynolds, C. R. (2007). BASC-2 Behavioral and emotional screening system (BASC-2 BESS). Minneapolis, MN: Pearson.
Lane, K. L., Kalberg, J. R., Menzies, H., Bruhn, A., Eisner, S., & Crnobori, M. (2011). Using systematic screening data to assess risk and identify students for targeted supports: Illustrations across the K-12 continuum. Remedial and Special Education, 32, 39–54. doi:10.1177/0741932510361263
Lane, K. L., Oakes, W. P., Carter, E. W., Lambert, W. E., & Jenkins, A. B. (2013). Initial evidence for the reliability and validity of the student risk screening scale for internalizing and externalizing behaviors at the middle school level. Assessment for Effective Intervention, 39, 24–38. doi:10.1177/1534508413489336
Lane, K. L., Oakes, W. P., Ennis, R. P., Cox, M. L., Schatschneider, C., & Lambert, W. (2011). Additional evidence for the reliability and validity of the student risk screening scale at the high school level: A replication and extension. Journal of Emotional and Behavioral Disorders, 21(2), 97–115. doi:10.1177/1063426611407339
Lane, K. L., Oakes, W. P., Harris, P. J., Menzies, H. M., Cox, M., & Lambert, W. (2012). Initial evidence for the reliability and validity of the student risk screening scale for internalizing and externalizing behaviors at the elementary level. Behavioral Disorders, 37, 99–122.
Lane, K. L., Oakes, W. P., Swogger, E. D., Schatschneider, C., Menzies, H. M., & Sanchez, J. (2015). Student risk screening scale for internalizing and externalizing behaviors: Preliminary cut scores to support data-informed decision making. Behavioral Disorders, 40, 159–170.
doi:10.17988/0198-7429-40.3.159
Lapan, R. T., Whitcomb, S. A., & Aleman, N. M. (2012). Connecticut professional school counselors: College and career counseling services and smaller ratios benefit students. Professional School Counseling, 16, 117–124. doi:10.5330/PSC.n.2012-16.124
Lo, Y.-Y., & Cartledge, G. (2006). FBA and BIP: Increasing the behavior adjustment of African American boys in schools. Behavioral Disorders, 31, 147–161.
Maggin, D. M., Zurheide, J., Pickett, K. C., & Baillie, S. J. (2015). A systematic evidence review of the check-in/check-out program for reducing student challenging behaviors. Journal of Positive Behavior Interventions, 17, 197–208. doi:10.1177/1098300715573630
Martens, K., & Andreen, K. (2013). School counselors’ involvement with a school-wide positive behavior support system: Addressing student behavior issues in a proactive and positive manner. Professional School Counseling, 16, 313–322. doi:10.5330/PSC.n.2013-16.313
Mayes, R. D., & Hines, E. M. (2014). College and career readiness for gifted African American girls: A call to school counselors. Interdisciplinary Journal of Teaching and Learning, 4, 31–42.
Moore, J. L., Henfield, M. S., & Owens, D. (2008). African American males in special education: Their attitudes and perceptions toward high school counselors and school counseling services. American Behavioral Scientist, 51, 907–927. doi:10.1177/0002764207311997
Natsuaki, M. N., Ge, X., & Wenk, E. (2008). Continuity and changes in the developmental trajectories of criminal career: Examining the roles of timing of first arrest and high school graduation. Journal of Youth and Adolescence, 37, 431–444. doi:10.1007/s10964-006-9156-0
Newcomer, L. L., Freeman, R., & Barrett, S. (2013). Essential systems for sustainable implementation of Tier 2 supports. Journal of Applied School Psychology, 29, 126–147. doi:10.1080/15377903.2013.778770
Ockerman, M. S., Mason, E. C. M., & Hollenbeck, A. F. (2012). Integrating RTI with school counseling programs: Being a proactive professional school counselor. Journal of School Counseling, 10(15), 1–37. Retrieved from http://files.eric.ed.gov/fulltext/EJ978870.pdf
Palmer, L. E., & Erford, B. T. (2012). Predicting student outcome measures using the ASCA National Model program audit. The Professional Counselor, 2, 152–159. doi:10.15241/lep.2.2.152
Palmer, R. T., & Maramba, D. C. (2010). African American male achievement: Using a tenet of Critical Theory to explain the African American male achievement disparity. Education and Urban Society, 43, 431–450. doi:10.1177/0013124510380715
Skiba, R. J. (2014). The failure of zero tolerance. Reclaiming Children and Youth, 22(4), 27–33.
Sugai, G., & Horner, R. H. (2009). Responsiveness-to-intervention and school-wide positive behavior supports: Integration of multi-tiered system approaches. Exceptionality, 17, 223–237. doi:10.1080/09362830903235375
Toldson, I. A., & Lewis, C. W. (2012). Challenge the status quo: Academic success among school-age African American males. Retrieved from http://www.cbcfinc.org/oUploadedFiles/CTSQ.pdf
Travis, J., Western, B., & Redburn, S. (2014). The growth of incarceration in the United States: Exploring causes and consequences. Committee on Causes and Consequences of High Rates of Incarceration, Committee on Law and Justice, Division of Behavioral and Social Sciences and Education. Washington, DC: The National Academic Press.
U.S. Department of Education, Office of Civil Rights. (2014). Data snapshot: School discipline (Issue Brief No. 1). Retrieved from http://www2.ed.gov/about/offices/list/ocr/docs/crdc-discipline-snapshot.pdf
Von der Embse, N. P., Pendergast, L. L., Kilgus, S. P., & Eklund, K. R. (2015). Evaluating the applied use of a mental health screener: Structural validity of the social, academic, and emotional behavior risk screener. Psychological Assessment. Advance online publication. doi:10.1037/pas0000253
Walker, H. M., & Severson, H. H. (1992). Systematic Screening for Behavior Disorders (SSBD): User’s guide and administration manual. Longmont, CO: Sopris West.
Wiesner, M., Kim, H. K., & Capaldi, D. M. (2010). History of juvenile arrests and vocational career
outcomes for at-risk young men. Journal of Research in Crime & Delinquency, 47, 91–117. doi:10.1177/0022427809348908
Christopher T. Belser, NCC, is a doctoral candidate at the University of Central Florida. M. Ann Shillingford is an Associate Professor at the University of Central Florida. J. Richelle Joe, NCC, is an Assistant Professor at the University of Central Florida. Correspondence can be addressed to Christopher Belser, 231B Mathematical Sciences Building, University of Central Florida, Orlando, FL 32816, christopher.belser@ucf.edu.
Sep 16, 2016 | Article, Volume 6 - Issue 3
Jennifer Betters-Bubon, Todd Brunner, Avery Kansteiner
The American School Counselor Association (ASCA) National Model and a multi-tiered system of supports (MTSS) both provide frameworks for systematically solving problems in schools, including student behavior concerns. The authors outline a model that integrates overlapping elements of the National Model and MTSS as a support for marginalized students of color exhibiting problem behaviors. Individually, the frameworks employ data-driven decision making as well as prevention services for all students and intervention services for at-risk students. Thus, the integrated model allows schools to provide objective alternatives to exclusionary disciplinary actions (e.g., suspensions and expulsions) that are being assigned to students of color at a disproportionate rate. The manuscript outlines the steps within the integrated model and provides implications for school counselors and counselor educators.
Keywords: ASCA National Model, multi-tiered system of supports, school counselors, marginalized students, students of color
In 1957, Horace Mann stated, “Education, then, beyond all other devices of human origin, is a great equalizer of conditions of men” (p. 87). Public education was designed to bridge the inequalities of society such that experiences in schools could ensure all individuals have the opportunity to excel in school and in life. This tenet has been challenged in recent years as the achievement and opportunity gaps in our schools continue to grow. A disproportionate number of youth from culturally and linguistically diverse backgrounds are not succeeding and may be excluded from public school (Gregory, Skiba, & Noguera, 2010). In 2012, for example, African American students were 3.5 times more likely than their Caucasian peers to be suspended (U.S. Department of Education Office of Civil Rights, 2014). African American, Latino, and Native American students receive harsher punishments for more subjective reasons such as disrespect, insubordination or excessive noise (Losen & Gillespie, 2012). Further, data from the National Center on Educational Statistics show that while the gap is narrowing slightly, African American youth lag behind their Caucasian peers an average of 23–26 points in math and 21–26 points in reading assessments (Vanneman, Hamilton, Baldwin Anderson, & Rahman, 2009).
To close these achievement gaps and disparities in discipline practices, important research has linked schoolwide behavior programs and student achievement and engagement outcomes (Lassen, Steele, & Sailor, 2006; Luiselli, Putnam, Handler, & Feinberg, 2005). A recent focus has included schoolwide behavior programs that are multi-tiered in nature, including Positive Behavior Interventions and Supports (PBIS) programs. PBIS programs integrate research-based practice within a three-tier approach, including those at the primary, secondary, and tertiary levels of prevention and intervention. This multi-tiered system of supports has been supported by the American School Counselor Association (ASCA; 2014) and cited as evidence-based practices that have potential in closing the achievement gap (Benner, Kutash, Nelson, & Fisher, 2013). Recent research has focused on how to implement PBIS in culturally responsive ways (Bal, Kozleski, Schrader, Rodriguez, & Pelton, 2014; Greflund, McIntosh, Mercer, & May, 2014) to better impact disproportionality in discipline outcomes that exist in schools today.
School counselors with extensive training in data-informed student intervention and school-level systemic change can play integral roles in PBIS implementation and can serve as leaders in the process (Cressey, Whitcomb, McGilvray-Rivet, Morrison, & Shander-Reynolds, 2014; Goodman-Scott, 2014). Goodman-Scott, Betters-Bubon, and Donohue (2015) noted that PBIS programs can be integrated with comprehensive school counseling programs to enhance the role of the school counselor and better improve student outcomes. With knowledge of cultural diversity (Schulz, Hurt, & Lindo, 2014) and data-focused interventions to close the achievement gap (Hatch, 2013), school counselors are poised to ensure that these programs are implemented in ways that combat disproportionality. While literature exists on culturally responsive PBIS (Fallon, O’Keeffe, & Sugai, 2012) and the school counselor’s role in PBIS (Goodman-Scott, 2014), there does not exist research examining the school counselor’s role implementing culturally responsive PBIS programs, despite their role as multiculturally competent advocates for student equity. This article extends existing research on culturally
responsive PBIS by examining longitudinal data from one elementary school that intentionally engaged in culturally responsive practices within PBIS implementation, highlighting the leadership role of the school counselor. To better understand these potential relationships, we will first provide an overview of PBIS. Second, we will provide an overview of research linking PBIS to culturally responsive practice, focusing on how PBIS can combat disproportionality. Finally, we describe the case study in light of Vincent, Randall, Cartledge, Tobin and Swain-Bradway’s (2011) paper that outlines the main tenets of effective culturally responsive PBIS implementation.
Positive Behavior Interventions and Supports (PBIS)
PBIS is an educational program initiative that has great promise in helping schools promote positive behavior and engaged students. Grounded in the theory of applied behavior analysis, PBIS includes the application of a tiered system of support to change and improve behavior among students (Sugai & Horner, 2006). At the primary level (Tier 1) is the establishment of preventative systems of support, including the formation of schoolwide expectations and monitoring student behavioral data. The secondary level (Tier 2) includes the use of systematic and intensive behavior strategies for at-risk students, while the tertiary level (Tier 3) incorporates wraparound interventions for youth and families in crisis. At all levels of implementation, PBIS includes the use of evidence-based behavioral practices and formal and ongoing data-based decision making within schools (Sugai & Horner, 2006).
Next, PBIS includes a focus on four key elements: outcomes, practices, systems and data use (Horner, Sugai, Todd, & Lewis-Palmer, 2005). Student outcomes are at the foundation of any PBIS program, including behavior and academic success for students within a safe school environment. Practices include the use of evidence-based curricula, instructional practices, rewards, and contingencies that ultimately impact both teacher instruction and student behavior. Systems include an emphasis on sustained school change, including staffing, policy and training that impact how and what is done in any given school. Finally, data focuses on the continued use of school data to monitor program effectiveness. Data often used within PBIS studies includes academic achievement, school safety and behavioral indicators. Members of the PBIS team regularly analyze this data, which also is used to make subsequent decisions regarding both system and practice change.
In theory and practice, PBIS should facilitate a school environment that is more likely to promote feelings of safety and positive relationships as well as more effective teaching and learning. Recent randomized, controlled studies of PBIS implementation in elementary schools demonstrated the improved use of PBIS practices were related to feelings of safety and reading assessment results (Horner et al., 2009). In addition, schools that undertook specific schoolwide trainings were more positive and friendly than schools that did not (Bradshaw, Koth, Thornton, & Leaf, 2009). At the same time, the overall success of PBIS programs has come into question with the continued problem of disproportionality and perceived lack of cultural relevance.
Culturally Responsive Positive Behavior Interventions and Supports
Disproportionality
The question remains how and whether PBIS programs provide the same level of success for students from different racial and ethnic backgrounds. Recent researchers examined the relationship between PBIS implementation and disproportionality in discipline referrals that resulted in school removal of students. In an examination of a national sample of 364 elementary and middle schools engaged in PBIS implementation for one year, Skiba et al. (2011) noted that in comparison to Caucasian peers, African American students were overrepresented in referrals to the office and Hispanic students were underrepresented in elementary and overrepresented in middle schools. In addition, both groups of students were more likely to be suspended for offenses than their Caucasian peers. Other researchers have noted PBIS may reduce overall problem behavior as measured by the total number of office discipline referrals (ODRs), but disparities in discipline for students from minority cultures continue (Kaufman et al., 2010). Vincent, Swain-Bradway, Tobin, and May (2011) noted that the discipline gaps between Caucasian and African American students were smaller in schools implementing PBIS than those not implementing PBIS.
Integrating Culture in PBIS Programs
Recent articles have focused on further defining the nature of culture within PBIS systems. According to Fallon et al. (2012), “culturally and contextually relevant is used to describe and consider the unique variables, characteristics, and learning histories of students, educators, families, and community members involved in the implementation of PBIS” (p. 210). Sugai, O’Keeffe, and Fallon (2011) examined this definition in the context of behavioral analytic theory, positing that cultural miscommunications can occur when the behavior of one person (e.g., a teacher) serves as an antecedent for the behavior of another (e.g., a student). Individuals with different cultural learning histories may interpret the same behavior in different ways. For example, staff members may perceive walking as either strolling or strutting, which may be considered inappropriate in different classroom contexts. Fraczek (2010) found that without proper consideration of culture, PBIS programs could take a White approach, with teachers treating cultural differences among students as deficiencies rather than assets.
Culture and context, then, must be considered when planning, developing and teaching important PBIS concepts. Sugai et al. (2011) provided specific suggestions across different elements in implementation (e.g., provide opportunities for faculty to learn about cultural norms, develop lessons that are appropriate across cultural groups). Utley, Kozleski, Smith, and Draper (2002) recommended examining social behaviors from a cultural perspective (e.g., communication styles, interactional styles with adults, peers) within PBIS. Additional multicultural practices include the intentional engagement of families in the policies and expectations, particularly with diverse, urban youth. Bal, Thorius, and Kozleski (2012) extended these ideas with culturally responsive PBIS learning labs that include ongoing discussions of culture with a variety of school stakeholders (e.g., parents, staff, administration, students).
The few studies that have examined outcomes of culturally responsive PBIS programs demonstrate potential positive outcomes. Greflund et al. (2014) found no disproportionality for Aboriginal students in a diverse sample of K–8 students from British Columbia, due in part to the incorporation of Aboriginal values, language and voice in PBIS implementation (McIntosh, Moniz, Craft, Golby, & Steinwand-Deschambeault, 2014). Citing data from a number of schools in Illinois, Eber, Upreti, and Rose (2010) noted that engaging in difficult conversations and building relationships between students and staff, along with integrating data-based decision-making into the fabric of school discipline, led to positive outcomes for ethnic minority youth.
Vincent, Randall, et al. (2011) situate the integration of cultural responsiveness within key features of PBIS implementation, including data, practices, systems and outcomes (Figure 1). Only through culturally responsive practices and conversations can PBIS achieve intended outcomes. For example, while PBIS proposes that behavioral expectations are taught in an effort to increase behavioral success for all students, in a diverse school setting, these expectations would need to be taught in ways reflective of the cultural backgrounds of students. This case study will explore ways in which PBIS programs can include intentional integration of culturally responsive practices.
Case Study
Due to the lack of research in culturally responsive PBIS, this case study provides a model of culturally responsive practices within PBIS implementation. It situates PBIS implementation within the conceptual model of Vincent, Randall, et al. (2011), who suggest culturally responsive approaches serve as mediators between PBIS programs and desired outcomes (Figure 1). Specifically, culturally relevant PBIS programs will include systems emphasizing staff cultural knowledge and self-awareness, outcomes focusing on cultural equity, and data use that supports culturally valid decision making along with practices grounded in cultural validation and support (Figure 1). For example, to support culturally relevant staff behavior, schools must provide opportunities for staff to explore their own cultural awareness. Likewise, use of evidence-based practices must be grounded in knowledge and understanding of student cultural identities. Following a brief overview of the general PBIS implementation process, we outline specific culturally responsive practices as outlined by Vincent, Randall, et al. (2011).
Setting and Participants
This case study focuses on one elementary school (grades K–5) located in a suburb of a mid-sized Midwestern town from 2009–2014. The suburb had a population of approximately 10,000 residents. Median household income in 2009 was $75,000. The school district had approximately 4,900 students drawn from the suburb itself and a suburb located 10 miles away. The target school, one of 11 in the district, had an enrollment of approximately 500 students. A substantial shift in student population occurred during the first year of implementation due to redistricting. A population of approximately 130 Spanish-speaking bilingual students was transferred to the school in 2008, shifting the student demographics to 60% Caucasian, 28% Hispanic, 9% African American and 2% Asian American. Approximately 40% of students received free and reduced lunch at the time of observance.
Procedures
Given that the first author was engaged in PBIS implementation first as a school counselor and later as a consultant while the other authors are currently engaged in PBIS implementation, this article uses a participatory action research framework (Reason & Bradbury, 2008). Action research includes a planning and reflective process that is linked to action, all of which are influenced by an understanding of history, culture and local context (Baum, MacDougall, & Smith, 2006). Thus, the article includes a description of PBIS planning and action stages along with the reflective process that was involved in culturally responsive PBIS implementation.
Within the action research framework, data were used, including ODRs as a fidelity measure of PBIS. ODRs are a reliable and valid indicator of overall school climate levels (Irvin et al., 2006) and are commonly used in PBIS analysis. The PBIS Self-Assessment Survey (SAS) was used for initial and annual assessment of implementation quality of behavior support systems in the school. This online survey, completed by a cross-section of school staff, examines the “current status” and “need for improvement” of four behavior support systems: (a) schoolwide discipline systems, (b) non-classroom management systems (e.g., cafeteria, hallway, playground), (c) classroom management systems, and (d) systems for individual students engaging in chronic problem behaviors. Results give an overall implementation level as it pertains to PBIS, with 80% indicating full implementation (Sugai, Horner, Lewis-Palmer, & Todd, 2005).
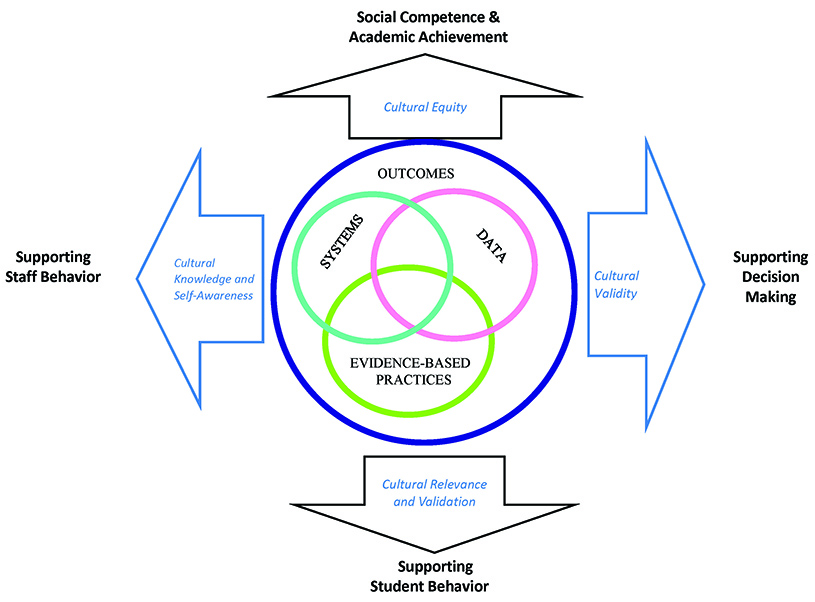
Figure 1. Integrating Schoolwide Positive Behavior Support and Culturally Responsive Practices. Reprinted from “Toward a Conceptual Integration of Cultural Responsiveness and Schoolwide Positive Behavior Support,” by C. G. Vincent, C. Randall,, G. Cartledge, T. J. Tobin, and J. Swain-Bradway, 2011, Journal of Positive Behavior Interventions, 13, 219–229.
Copyright 2011 by Sage Publishing. Reprinted with permission.
Planning: PBIS Implementation
PBIS within this school grew out of immediate concerns regarding the number of ODRs. For example, during 2006–2007, the school had 573 discipline referrals and an enrollment of 314 students. As a result of this situation, during 2007–2008 and 2008–2009 the school implemented a schoolwide goal that included the creation and implementation of a multi-component plan for integrating new students with a goal of a 50% reduction in discipline referrals. Two additional school goals focused on math and reading development. All certified staff were required to attend monthly meetings focusing on one of the goals, and results were communicated yearly to the site council, the governing body of the school and the school board.
The PBIS team formed in 2009–2010 as a way to coordinate and organize the many interventions that were attempted through the prior 2 years of work. The school counselor organized and led a summer PBIS training that included a cross-section of 25 staff members prior to the beginning of the school year.
Action: PBIS Implementation
Leadership team. At the core of the PBIS implementation process was the leadership team. The school counselor led the team along with coaches who focused on core areas of PBIS (e.g., systems, acknowledgements). The team varied in number between 15 and 25 and included a representative group of the school staff, such as classroom teachers, special teachers (e.g., music), educational assistants, special education teachers, student support staff (e.g., psychologist, social worker) and the principal. The team met on a monthly basis to discuss data, student behavior and acknowledgement. Because PBIS had not been adopted district-wide, the school hired a PBIS consultant to train and meet with the team coaches to ensure fidelity.
Behavioral expectations. The leadership team spent a considerable amount of time determining four behavioral expectations for the school at a summer workshop. The discussion included the meaning of such words as “respect” as well as the types of behaviors that would be universally expected by parents and teachers from different backgrounds. The four expectations: Be Safe, Be Kind & Respectful, Be a Problem-Solver and Be Responsible became the cornerstone behavioral expectations for the school. The team planned teacher training regarding the newly developed expectations as well as community gatherings to teach the expectations to students and families. Within this process, the school counselor played an integral role, organizing the gatherings and using expertise in social and emotional development to write the behavioral lessons known as Cool Tools. In subsequent years, the school counselor provided trainings to all new staff on PBIS.
Defining procedures. Along with expectations, the team delineated behaviors that would be handled in the classroom versus in the office (e.g., a t-chart delineating the discipline infractions that office and teaching staff respond to on a day-to-day basis). Not only were the processes outlined on paper, they were discussed in monthly staff meetings and meetings with student services staff and administration and educational assistants. For example, student services staff, including the school counselor, met with grade-level teachers each month to discuss student needs. This served as a way to reinforce key PBIS procedures. Similarly, the educational assistants who supervise students in the lunchroom, at recess and in the hallways were included as important team members through monthly meetings. These meetings, along with the monthly PBIS meeting, allowed for continuous conversation around student behavior and adult response.
Acknowledgements. Typically, PBIS programs provide a tangible, positive reinforcement system to promote appropriate behavior. These systems should include immediate feedback systems, such as verbal praise or tickets given to students demonstrating school expectations that can be turned in for prizes (e.g., pencils), as well as long-term feedback systems (e.g., quarterly schoolwide celebrations). Many staff members expressed concern about implementing an extrinsically focused ticket system, noting that this may lead to decreased intrinsic motivation. As such, a formal acknowledgement system was not immediately integrated into the PBIS program in year one. In January, the counselor had conversations with educational assistants about piloting a positive reinforcement ticket program on the playground in response to data showing an increase in ODRs. The success, measured by teacher and educational assistant perception and ODR referrals on the playground, was almost immediate. This led to staff interest in using this ticket system as a form of acknowledgement and reinforcement. Conversations at staff meetings along with printed materials, describing in detail the purpose of acknowledgements, helped the school move forward with a formal “thumbs up” ticket plan that transcended the playground to include all areas of the school. The PBIS team included student voices in the acknowledgements and leadership of PBIS, with a team of fifth-grade students assisting in the development of PBIS acknowledgement ideas in year two and beyond.
Data analysis. Data on ODRs had been collected at this school for many years. The principal sent out monthly updates on the number of discipline referrals, including referrals broken down by ethnicity. The integration of PBIS meant that the data analysis became a focus of the monthly meetings. The school counselor became actively involved in data analysis, sharing monthly updates with staff members. School staff examined types of areas of problem behavior and created plans to respond. While this data often focused on ODRs, more qualitative data also was discussed. For example, the lunchroom became an area of focus when teachers and staff shared concerns about behavior and noise. The leadership team took the qualitative data and created strategies to increase positive behavior (e.g., re-teaching, positive acknowledgement plan, community assemblies).
Family outreach. From the start, the PBIS team informed parents of the purpose of PBIS and later more fully integrated the voices of parents in the planning processes. The school counselor wrote monthly newsletters while teachers encouraged students to share their acknowledgement tickets with parents so as to share the positives happening in the school. Additionally, the team created a home behavior matrix and a Web site where parents and families could obtain additional information on PBIS at the school.
Reflection: Culturally Responsive PBIS Integration
As the team engaged in PBIS implementation, multiple situations emerged that brought culture to the forefront. Table 1 outlines several ways in which the team intentionally integrated culturally responsive practices into the PBIS program, and additional examples are illustrated below.
Table 1
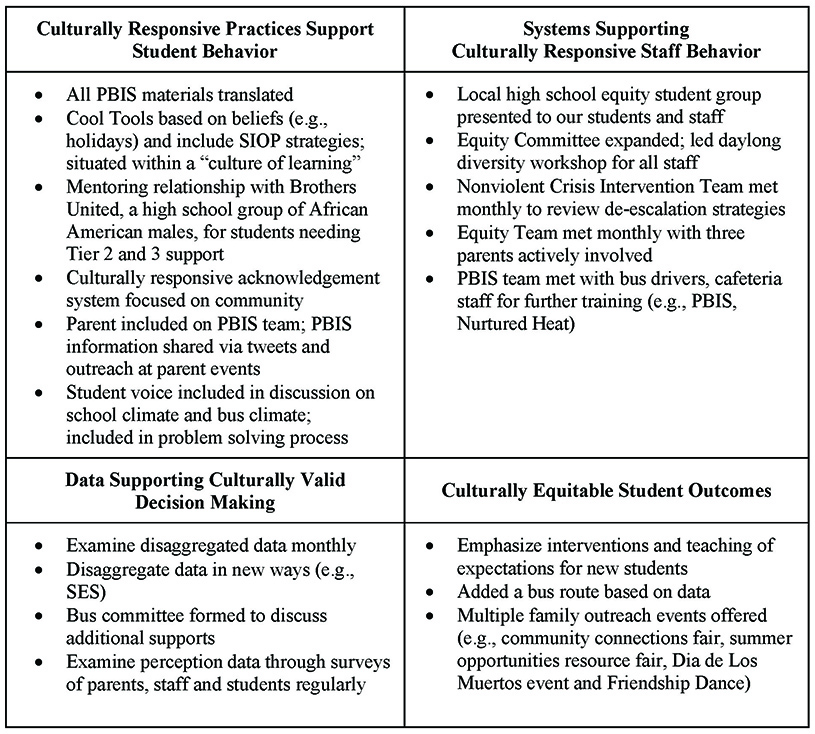
CR-PBIS Elements by Category
Systems built on cultural knowledge and awareness. From the onset of PBIS implementation, the leadership team integrated aspects of culture and cultural responsiveness into the systems. First, the PBIS team was diverse and included many different voices (e.g., bus drivers, educational assistants, bilingual and monolingual classroom teachers, special education staff). The redistricting in the first year of PBIS and the resulting change in student population led to the PBIS team having intentional discussion of important topics involving whether the expectations were culturally relevant to all students, including the Spanish-speaking students.
Further, the leadership team engaged in conversations about their own cultural biases and knowledge to inform the practices implemented within PBIS. When a team member suggested staff should teach the top 10 manners (e.g., table manners, eye contact) as part of the PBIS expectations, the team engaged in intentional conversation about whether the manners would be relevant to all students and parents. Ultimately, this team abandoned this idea due to the potential lack of cultural relevance. For example, the team discussed how eye contact during conversation may not be applicable to all families and students in the school. The principal encouraged staff learning and self-awareness that went beyond these conversations and scheduled subsequent trainings in the following years.
The team helped to create systems by which parents were informed and included in the PBIS process. For example, all information was sent to parents in multiple ways (e.g., translated) and parent voices were sought whenever possible. By year four, the leadership team included parents on the team and in year five, one of the school counselors started a Latino parent group.
The school counselor’s role changed as a result of PBIS and resource allocation was specifically addressed through the budget process at site council in the spring. Because the counselor was charged with leading the school’s PBIS efforts, the school increased the counselor full-time equivalent (FTE) from .60 to 1.20 to support this goal, thus adding a part-time bilingual counselor early in the first year of implementation.
Practices grounded in cultural validation and support. The change in school population led to more intentional conversations of culture in teaching and learning, validating the backgrounds of students and families. First and foremost, the universal practices that staff engaged in focused on community and acceptance. For example, the school principal left time in the master schedule for all classroom teachers to implement morning meetings, as recommended by the Responsive Classroom© Approach (Kriete, 2002). Daily class meetings are in line with culturally relevant practice as they lead to teachers and students knowing each other in the creation of a classroom community (Bondy, Ross, Gallingane, & Hambacher, 2007).
As the team implemented culturally responsive PBIS, the school counselor, in consultation with bilingual teaching staff, integrated Sheltered Instruction Observation Protocol (SIOP) strategies (Short, Fidelman, & Louguit, 2012) in the behavioral lessons. SIOP includes strategies in lessons that ensure that English language learners have the necessary background information to learn the material presented. As such, the team ensured that expectations were taught in culturally relevant ways. In addition, the teaching of expectations included recognition of the different backgrounds of students. For example, one of the behavioral lessons given to teachers close to winter break involved discussion of different student and staff beliefs that might be practiced over the break. Being respectful in this case transcended outside of traditional definitions of respect to include knowledge of others’ beliefs. Further, discussions among the leadership team in year three acknowledged the lack of overarching student understanding of the school expectations. For example, staff was not engaging in larger discussions about why respect can lead to success in life. As such, the team integrated the all-encompassing theme “Be A Learner” and situated the teaching of all expectations under this framework. In this way, staff, students and families could discuss how this is relevant in school and life, thus reflecting the perspectives of students and families (Swain-Bradway, Loman, & Vincent, 2014).
The PBIS team, along with school staff, discussed the inclusion of an acknowledgement system with intention. Because of the aforementioned concern about extrinsic reinforcement in the form of tickets, acknowledgement tickets were often given to groups and classrooms of students. The PBIS team placed more value on group gathering of tickets than individual. For example, each classroom had a bucket in which to collect tickets. They would bring their tickets to community gatherings to meet schoolwide goals, which would result in schoolwide celebrations focused on learning and community. For example, students would be encouraged to take part in a pajama day or be given 20 minutes on a specific day to engage in a fun activity, such as Drop Everything and Draw. These activities served to reinforce the positive behavior displayed by students.
Data that led to culturally valid decision making. The leadership team regularly used data to inform the practices taught and reinforced in the school. Total ODR data was collected each year and demonstrated decreases in overall number of referrals despite increasing enrollment (see Table 2). In addition, the school counselor regularly broke down data by grade level, socioeconomic status, race and location. This data was then discussed monthly at grade level meetings during which general problem solving could take place, whether focused on a specific student or group of students. Additionally, the data guided decisions at monthly PBIS leadership team meetings. The team regularly examined program fidelity. The SAS implementation average rose over the years, reaching fidelity of 84% in year three (see Table 3). Moreover, the PBIS leadership team used the SAS subscales to determine program strengths and weaknesses. Subscales included how well school expectations were taught and defined, and presence of a reward (or acknowledgment) system, as well as a defined way of addressing student behavior violations and infractions. In addition, the SAS included items that measured how well the team monitored areas in the building, managed the team processes and were supported at the district level. All subscales increased over the years of implementation.
Table 2
Enrollment and ODRs by Year
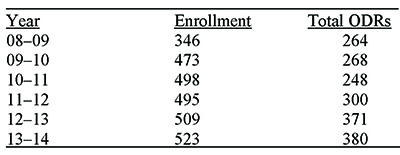
Table 3
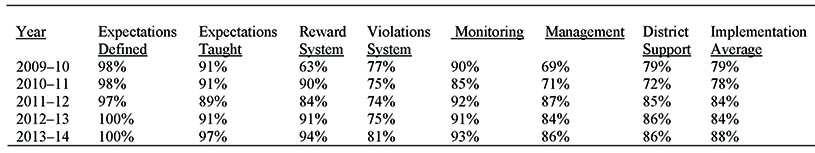
Self-Assessment Survey (SAS) Results by Year
ODR data comparing percentage enrollment to percentage of total ODRs demonstrated variability across the years (see Figure 2). ODR trends for Hispanic students shifted from over-representation to under-representation, whereas the gap for African American students went from 14% enrollment and 55% of total ODRs to a narrower gap of 7% enrollment and 31% of total ODRs. In meetings, the leadership team went beyond examination of percentages to determine which students were having difficulty. For example, during year five the team noted that students who had moved to the school in the previous year received a high percentage of total ODRs and accounted for many of the students needing Tier 2 and 3 supports. The team integrated interventions and behavioral teaching opportunities to assist new students in that transition.
In year four, a district focus on data led to the mandated formation of school equity teams at each school site. At this school, the team was comprised of 16 staff members and four parent and community members, and focused on school climate equity and parent and community outreach. This team met monthly, and in doing so disseminated climate surveys to students and staff, examined district-wide assessments to ensure cultural fairness and planned culture nights and parent orientation nights in the community.
Outcomes that demonstrate cultural equity. The more intentional focus on data disaggregation led to the ability of the PBIS leadership team to make equitable decisions. An example occurred in
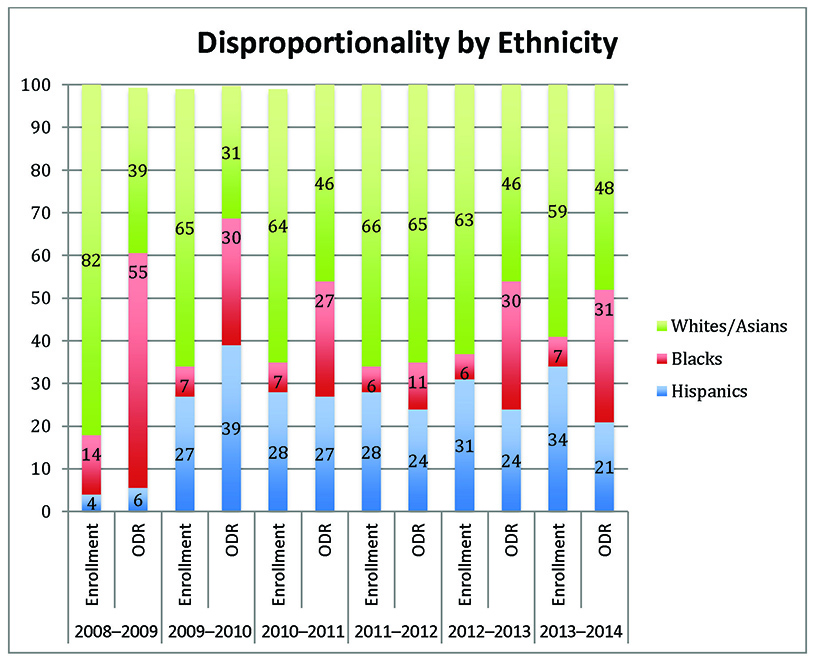
Figure 2. ODR by Ethnicity
the first year of PBIS implementation. At the start of 2009, the leadership team became concerned about behavior reported on one of the school buses. The contracted school bus driver was reporting, through written bus reports to the administration, a number of behavioral infractions on the rides to and from school. This bus included many students who received free and reduced lunch and were in racial and ethnic minority groups, traveling to and from an inner city neighborhood 10 miles away from the school. The principal worked with the general manager of the bus company and put interventions in place as part of PBIS, including meetings with the driver, principal, and translator in the cafeteria, and student–bus driver meetings, as well as letters to parents. It became apparent the problem was less about student behavior and more about equity—the bus was overcrowded. The principal shared concerns with the superintendent and the superintendent engaged in conversations with the bus company. Because the school as a whole had embraced PBIS and documenting data and steps to problem-solve, leaders at the district level were motivated to intervene. The district had funds and added a new bus route for students; bus referrals went down immediately.
Discussion
Research shows that PBIS is best implemented when considering the specific context of the school and needs of students and families (Fallon et al., 2012). The school in this case study demonstrated the intentional work that was needed to implement PBIS that was culturally responsive. The implementation of culturally responsive practices led to fewer behavioral reports for students from Hispanic backgrounds. Unfortunately, a disproportionate number of African American students received ODRs even after the implementation of culturally responsive PBIS, which is in line with previous research (Skiba et al., 2011). Thus, the intentional integration of culturally responsive PBIS practices should go beyond the examination of disaggregated data to include conversations around equity, access and success for all. The PBIS team in this school started these conversations to determine why students might not be succeeding. Because of the systems in place, staff integrated additional teaching and learning opportunities for students who were new to the school. There is still more for the team to do to reduce disproportionate representation of African American students in ODR. To that end, the leadership team recently went through PBIS Tier 2 training and the school counselors are implementing check-in/check-out, a targeted intervention program for individual students (Todd, Campbell, Meyer, & Horner, 2008) and data-driven small groups. Future research should examine whether these approaches have an impact on overall ODR data and on the continued equity conversations happening among key stakeholders in the school.
Because the results of this action research case study focus on one school’s efforts to engage in culturally responsive practice, the results should be interpreted with caution. The study is descriptive in nature and connections between the integration of culturally responsive PBIS elements and outcomes were not tested empirically. Future research should examine the relationship between intentional integration of culturally responsive PBIS components on school and student outcomes, to include outcomes beyond discipline referrals. Important work in this area is emerging and it will be imperative for school counselors to remain at the forefront of these initiatives to ensure PBIS practices take all students into consideration.
Currently, PBIS is implemented in thousands of schools in over 40 states. PBIS systems emphasize a shift from responding to problem behavior with exclusionary discipline to the use of instructional responses to problem behavior and corrective procedures to help students to identify and practice acceptable behavior instead of removing them from the classroom (McIntosh, Filter, Bennett, Ryan, & Sugai, 2010). While PBIS is an evidence-based intervention that should address disproportionality within discipline systems (Eber et al., 2010), this study and others have demonstrated that this is not always the case. As such, culture and context must be considered when planning, developing and implementing PBIS programs to make them more culturally responsive. In doing this important work, Swain-Bradway et al. (2014) recommended that school leaders systematically integrate the range of student cultural perspectives along with teacher cultural perspectives in creating disciplinary policies and practices that are nondiscriminatory. The cultural mismatch between individual teachers and students may be mitigated by the systematic implementation of school-wide systems supporting culturally responsive practices within schools. (p. 4)
Equity can only be achieved when all students and student backgrounds are considered within systemic programs implemented in a school environment and when all possible reasons for the gaps in success, including the ever increasing needs of students, disproportionate access to resources and opportunities, and mandates made on the educational system as a whole, are considered.
Conclusion and Implications
With much at stake at the national, district, school and individual levels, school counselors can play a critical role in ensuring PBIS programs are implemented with fidelity and in culturally responsive ways. School counselors can use their knowledge and recommendations (McIntosh, Girvan, Horner, Smolkowski, & Sugai, 2014) to reduce this very real problem of disproportionality in discipline practices, including implementing culturally responsive PBIS, disaggregating data and implementing accountability policies focused on discipline equity (Green et al., 2015; McIntosh, Barnes, Eliason, & Morris, 2014). Further, school counselors can use their expansive knowledge of data to extend the focus beyond just ODRs. Perception surveys focused on process rather than outcome data might be better at capturing change across time. For example, interviews with staff, parents and students examining school climate and social behavior can and should be examined within culturally responsive PBIS implementation. In that way, a clearer picture of student behavior, school climate, family perception and staff support might emerge. A recent national survey found school personnel to be supportive of the implementation of culturally and contextually responsive elements of PBIS (Fallon, O’Keeffe, Gage, & Sugai, 2015). School counselors can be champions in the process of encouraging culturally responsive practices within PBIS program implementation.
Schools play a privileged and strategic role in influencing social, emotional and academic outcomes for youth (Herman, Reinke, Parkin, Traylor, & Agarwal, 2009). School counselors can serve as leaders in conversations about equity and social justice as it pertains to student behavior and success in schools. Through continued conversations, intentional understanding of self and others, and targeted family involvement, school staff can ensure that education indeed continues to be the great equalizer for all.
Conflict of Interest and Funding Disclosure
The authors reported no conflict of interest or funding contributions for the development of this manuscript.
References
American School Counselor Association. (2014). The school counselor and multitiered system of supports. Retrieved from https://www.schoolcounselor.org/asca/media/asca/PositionStatements/PS_MultitieredSupportSystem.pdf.
Bal, A., Kozleski, E. B., Schrader, E. M., Rodriguez, E. M., & Pelton, S. (2014). Systemic transformation from the ground–up: Using learning lab to design culturally responsive schoolwide positive behavioral supports. Remedial and Special Education, 35, 327–339. doi:10.1177/0741932514536995
Bal, A., Thorius, K., & Kozleski, E. (2012). Culturally responsive Positive Behavioral Support matters. Retrieved from www.equityallianceatasu.org/sites/default/files/CRPBIS_Matters.pdf
Baum, F., MacDougall, C., & Smith, D. (2006). Participatory action research. Journal of Epidemiology & Community Health, 60, 854–857. doi:10.1136/jech.2004.028662
Benner, G. J., Kutash, K., Nelson, J. R., & Fisher, M. B. (2013). Closing the achievement gap of youth with
emotional and behavioral disorders through multi-tiered systems of support. Education and Treatment
of Children, 36(3), 15–29. doi:10.1353/etc.2013.0018
Bondy, E., Ross, D. D., Gallingane, C., & Hambacher, E. (2007). Creating environments of success and resilience:
Culturally responsive classroom management and more. Urban Education, 42, 326–348. doi:10.1177/0042085907303406
Bradshaw, C. P., Koth, C. W., Thornton, L. A., & Leaf, P. J. (2009). Altering school climate through school-wide positive behavioral interventions & supports: Findings from a group-randomized effectiveness trial. Prevention Science, 10, 100–115. doi:10.1007/s11121-008-0114-9.
Cressey, J. M., Whitcomb, S. A., McGilvray-Rivet, S. J., Morrison, R. J., & Shander-Reynolds, K. J. (2015). Handling PBIS with care: Scaling up to school-wide implementation. Professional School Counseling, 18, 90–99. doi:10.5330/prsc.18.1.g1307kql2457q668
Eber, L, Upreti, G, & Rose, J. (2010). Addressing ethnic disproportionality in school discipline through positive behavior interventions and supports (PBIS). Building Leadership, 17, 1–10.
Fallon, L. M., O’Keeffe, B. V., Gage, N. A., & Sugai, G. (2015). Brief report: Assessing attitudes toward culturally and contextually relevant schoolwide positive behavior support strategies. Behavioral Disorders, 40, 251–260. doi:10.17988/0198-7429-40.4.251
Fallon, L. M., O’Keeffe, B. V., & Sugai, G. (2012). Consideration of culture and context in school-wide positive behavior support: A review of current literature. Journal of Positive Behavior Interventions, 209–219. doi:10.1177/1098300712442242
Fraczek, M. S. (2010). Perpetuating a culture of White behavior: The experiences of non-native speaking Hispanic students in a PBIS school. (Doctoral dissertation). Retrieved from ProQuest Dissertations and Theses. (3397846)
Goodman-Scott, E. (2013). Maximizing school counselors’ efforts by implementing school-wide positive behavioral interventions and supports: A case study from the field. Professional School Counseling, 17, 111–119. doi:10.5330/prsc.17.1.518021r2x6821660
Goodman-Scott, E., Betters-Bubon, J., & Donohue, P. (2015). Aligning comprehensive school counseling programs and positive behavioral interventions and supports to maximize school counselors’ efforts.
Professional School Counseling, 19, 57–67. doi:10.5330/1096-2409-19.1.57
Green, A. L., Nese, R. N. T., McIntosh, K., Nishioka, V., Eliason, B., & Canizal Delabra, A. (2015). Key elements of policies to address discipline disproportionality: A guide for district and school teams. OSEP Technical Assistance Center on Positive Behavioral Interventions and Supports. Retrieved from https://www.pbis.org/Common/Cms/files/pbisresources/PBIS%20Disproportionality%20Policy%20Guidebook%202016-7-24.pdf
Greflund, S., McIntosh, K., Mercer, S. H., & May, S. L. (2014). Examining disproportionality in school
discipline for Aboriginal students in schools implementing PBIS. Canadian Journal of School Psychology, 29, 213–235. doi:10.1177/0829573514542214
Gregory, A., Skiba, R. J., & Noguera, P. A. (2010). The achievement gap and the discipline gap: Two sides of the same coin? Educational Researcher, 39, 59–68. doi:10.3102/0013189X09357621
Hatch, T. (2013). The use of data in school counseling. Thousand Oaks, CA: Corwin Press.
Herman, K. C., Reinke, W. M., Parkin, J., Traylor, K. B., & Agarwal, G. (2009). Childhood depression: Rethinking the role of the school. Psychology in the Schools, 46, 433–446. doi:10.1002/pits.20388
Horner, R. H., Sugai, G., Smolkowski, K., Eber, L., Nakasato, J., Todd, A. W., & Esperanza, J. (2009). A randomized, wait-list controlled effectiveness trial assessing school-wide positive behavior support in elementary schools. Journal of Positive Behavior Interventions, 11, 133–144.
Horner, R. H., Sugai, G., Todd, A. W., & Lewis-Palmer, T. (2005). School-wide positive behavior support: An alternative approach to discipline in schools. In L. M. Bambara & L. Kern (Eds.), Individualized supports for students with problem behaviors: Designing positive behavior plans (pp. 359–390). New York, NY: Guilford Press.
Irvin, L. K., Horner, R. H., Ingram, K., Todd, A.W., Sugai, G., Sampson, N. K., & Boland, J. B. (2006). Using office discipline referral data for decision making about student behavior in elementary & middle schools: An empirical evaluation of validity. Journal of Positive Behavior Interventions, 8, 10–23.
doi:10.1177/10983007060080010301
Kaufman, J. S., Jaser, S. S., Vaughan, E. L., Reynolds, J. S., Di Donato, J., Bernard, S. N., & Hernandez-Brereton, M. (2010). Patterns in office referral data by grade, race/ethnicity, and gender. Journal of Positive Behavior Interventions, 12, 44–54. doi:10.1177/1098300708329710
Kriete, R. (2002). The morning meeting book. (2nd ed.). Turners Falls, MA: Northeast Foundation for Children.
Lassen, S. R., Steele, M. M., & Sailor, W. (2006). The relationship of school-wide positive behavior support to academic achievement in an urban middle school. Psychology in the Schools, 43, 701–712.
doi:10.1002/pits.20177
Losen, D. J., & Gillespie, J. (2012). Opportunities suspended: The disparate impact of disciplinary exclusion from school. Los Angeles, CA: The Center for Civil Rights Remedies.
Luiselli, J. K., Putnam, R. F., Handler, M. W., & Feinberg, A. B. (2005). Whole-school positive behaviour
support: Effects on student discipline problems & academic performance. Educational Psychology, 25, 183–198. doi:10.1080/0144341042000301265
Mann, H. (1957). Twelfth annual report. In L. Cremin (Ed.), The republic and the school: Horace Mann on the education of free men (pp. 79–112). New York, NY: Teachers College Press.
McIntosh, K., Barnes, A., Eliason, B., & Morris, K. (2014). Using discipline data within SWPBIS to identify and
address disproportionality: A guide for school teams. OSEP Technical Assistance Center on Positive
Behavioral Interventions and Supports. Retrieved from http://www.pbis.org/Common/Cms/files/pbisresources/PBIS_Disproportionality_Data_Guidebook.pdf
McIntosh, K., Filter, K. J., Bennett, J. L., Ryan, C., & Sugai, G. (2010). Principles of sustainable prevention:
Designing scale-up of school-wide Positive Behavior Support to promote durable systems. Psychology in the Schools, 47, 5–21. doi:10.1002/pits.20448
McIntosh, K., Girvan, E. J., Horner, R. H., Smolkowski, K., & Sugai, G. (2014). Recommendations for addressing discipline disproportionality in education. OSEP Technical Assistance Center on Positive Behavior Intervention and Supports. Retrieved from https://www.pbis.org/Common/Cms/files/pbisresources/RecommendationsForAddressingDisciplineDisproportionality.pdf
McIntosh, K., Moniz, C., Craft, C. B., Golby, R., & Steinwand-Deschambeault, T. (2014). Implementing school-wide positive behavioural interventions and supports to better meet the needs of Indigenous students. Canadian Journal of School Psychology, 29, 236–257. doi:10.1177/0829573514542217
Reason, P., & Bradbury, H. (2008). The Sage handbook of action research: Participative inquiry and practice (2nd ed.)Los Angeles, CA: Sage.
Schulz, L. L., Hurt, K., & Lindo, N. (2014). My name is not Michael: Strategies for promoting cultural respon-siveness in schools. Journal of School Counseling, 12(2), 1–35.
Short, D. J., Fidelman, C. G., & Louguit, M. (2012). Developing academic language in English language learners through sheltered instruction. TESOL Quarterly, 46, 334–361. doi:10.1002/tesq.20
Skiba, R. J., Horner, R. H., Chung, C.-G., Rausch, M. K., May, S. L., & Tobin, T. (2011). Race is not neutral: A national investigation of African American and Latino disproportionality in school discipline. School Psychology Review, 40, 85–107.
Sugai, G., & Horner, R. R. (2006). A promising approach for expanding & sustaining school-wide positive behavior support. School Psychology Review, 35, 245–259.
Sugai, G., Horner, R. H., Lewis-Palmer, T., & Todd, A. (2005). School-wide positive behavior support team training manual. Eugene: Educational and Community Supports, University of Oregon.
Sugai, G., O’Keeffe, B. V., & Fallon, L. M. (2011). A contextual consideration of culture and schoolwide positive behavior support. Journal of Positive Behavior Interventions, 14, 197–208.
Swain-Bradway, J., Loman, S. L., & Vincent, C. G. (2014). Systematically addressing discipline disproportion-ality through the application of a school-wide framework. Multiple Voices for Ethnically Diverse Exceptional Learners, 14, 3–17.
Todd, A. W., Campbell, A. L., Meyer, G. G., & Horner, R. H. (2008). The effects of a targeted intervention to reduce problem behaviors: Elementary school implementation of check in—check out. Journal of Positive Behavior Interventions, 10, 46–55.
U.S. Department of Education Office of Civil Rights. (2014, March). Civil rights data collection. Washington, DC: Author. Retrieved from http://ocrdata.ed.gov/Downloads/CRDC-School-Discipline-Snapshot.pdf
Utley, C. A., Kozleski, E. B., Smith, A., & Draper, I. L. (2002). Positive behavior support: A proactive strategy for minimizing behavior problems in urban multicultural youth. Journal of Positive Behavior Interventions, 4, 196–207. doi:10.1177/10983007020040040301
Vanneman, A., Hamilton, L., Baldwin Anderson, J., & Rahman, T. (2009). Achievement gaps: How Black and White students in public schools perform in mathematics and reading on the National Assessment of Educational Progress, (NCES 2009-455). National Center for Education Statistics, Institute of Education Sciences, U.S.
Department of Education. Washington, DC. Retrieved from https://nces.ed.gov/nationsreportcard/pubs/studies/2009455.aspx
Vincent, C. G., Randall, C., Cartledge, G., Tobin, T. J., & Swain-Bradway, J. (2011). Toward a conceptual integration of cultural responsiveness and schoolwide positive behavior support. Journal of Positive Behavior Interventions, 13, 219–229. doi:10.1177/1098300711399765
Vincent, C. G., Swain-Bradway, J., Tobin, T. J., & May, S. (2011). Disciplinary referrals for culturally and linguistically diverse students with and without disabilities: Patterns resulting from school-wide positive behavior support. Exceptionality, 19, 175–190. doi:10.1080/09362835.2011.579936
Jennifer Betters-Bubon is an Assistant Professor at the University of Wisconsin-Whitewater. Todd Brunner is the Principal and Avery Kansteiner is a School Counselor at Sugar Creek Elementary School in Verona, WI. Correspondence can be addressed to Jennifer Betters-Bubon, 6039 Winther Hall, Whitewater, WI 53190, bettersj@uww.edu.
Sep 16, 2016 | Article, Volume 6 - Issue 3
Karen Harrington, Catherine Griffith, Katharine Gray, Scott Greenspan
This article provides an overview of a grant project designed to create a district-wide elementary school counseling program with a strong data-based decision-making process. Project goals included building data literacy skills among school counselors and developing the infrastructure to efficiently collect important social-emotional indicators through a revised system for recording disciplinary infractions and a new research-based behavioral component for the district’s standards-based report cards. This enhanced system for accessing and analyzing social-emotional indicators resulted in broad systemic changes in the district, including extending a number of grant initiatives to the middle and high school levels, restructuring data teams to adopt a multi-tiered system of supports, and establishing school counselors as leaders in data-driven discussions about student success.
Keywords: school counseling, data-based decision making, multi-tiered system of supports, social–emotional, elementary school
This article reports on an Elementary and Secondary School Counseling Program (ESSCP) grant project designed to build an elementary school counseling program in a district that previously had not employed school counselors at that level. The new school counseling program was organized around an innovative shift in the district’s multi-tiered system of supports (MTSS) model that expanded to integrate social-emotional and behavioral data with academic indicators. School counselors used the new social-emotional data to help answer the question of why students were struggling academically when scholastic deficiencies were not the primary cause. The grant project also focused on developing strong data literacy skills among elementary school counselors so they could serve as leaders in data-based discussions. These complementary grant goals transformed the data team process as school counselors, teachers and administrators began to use data to better understand the complex relationship between social-emotional factors and academic achievement. These practices resulted in systemic changes throughout the district as data-driven elements of the elementary school counseling program were adopted at the secondary level. The purpose of this article is to: (a) highlight the importance of engaging in data-based decision making regarding students’ social-emotional needs in schools, (b) provide an overview of the specific elements that comprised the new MTSS model in the school district as a part of this grant-funded project, and (c) underscore the importance of building human capacity to enable school-based data teams to meaningfully integrate academic and social-emotional data to promote improved student outcomes. Limitations of this project, directions for future research and implications for school counselors also are discussed.
School Counselors and Social-Emotional Data
School counselors are often advised to adopt a data-based decision-making model as part of their practice (American School Counselor Association [ASCA], 2012; Dimmitt, Carey, & Hatch, 2007). Accountability mandates require school counselors to use data to demonstrate the impact of their work and to link their interventions to academic achievement (Dahir & Stone, 2009: Isaacs, 2003; Sink & Stroh, 2003.) Moreover, data use also is central to the transformed model of school counseling, which positions school counselors as advocates in educational reform efforts such as closing the achievement gap and carrying out school improvement initiatives (Dahir, 2004; Hayes, Nelson, Tabin, Pearson, & Worthy, 2002; House & Hayes, 2002). However, institutional factors can limit the role of the school counselor in data-based decision making. Typically, data teams primarily (or even exclusively) consider academic indicators, and schools often lack the infrastructure to systematically collect the social-emotional data that more directly aligns with the work of the school counselor.
Accountability requirements of the No Child Left Behind Act of 2001 (NCLB; 2002) have strongly influenced schools’ approaches to data-based decision making (Mandinach, Honey, & Light, 2006; Marsh, Pane, & Hamilton, 2006). The pressure to demonstrate adequate yearly progress (AYP) has prioritized state standardized tests scores and other academic benchmark assessments in data-driven discussions. A tremendous amount of achievement data were routinely collected and housed by school districts to fulfill reporting demands of NCLB; these data will continue to be gathered under the new Every Student Succeeds Act (ESSA; 2015). School staff can access these data to guide instructional practices and measure student progress. However, these data are more directly linked to teachers’ work with students and primarily measure academic achievement and cognitive ability (Heckman & Rubinstein, 2001).
The role of the school counselor encompasses not only students’ academic achievement but also their social-emotional development (ASCA, 2012). Social-emotional and behavioral data are typically not collected in the same robust manner as academic achievement data and are often limited to office discipline referrals and attendance rates. These behaviors are poor proxies of student engagement and reveal little information about underlying issues that need to be addressed. Measures of motivation, perseverance, self-regulation and other factors that impact students’ ability to achieve are not present in most school districts’ data collection systems, rendering them absent also from data-driven discussions about student outcomes.
In addition, while NCLB articulated which data are considered the critical measures of academic achievement, a corresponding set of social-emotional data has not been clearly delineated. Despite growing recognition of the impact of non-cognitive factors on student achievement (Farrington et al., 2012), educators are often uncertain about which specific behaviors, attitudes and dispositions link to success in school and throughout life. Educational organizations such as The Partnership for 21st Century Skills; Collaboration for Academic, Social, and Emotional Learning (CASEL); and ASCA (2014) have suggested promoting specific mindsets, college and career-readiness skills, and prosocial behaviors, but consensus is lacking about which social-emotional or non-cognitive factors are integral to students’ academic and social skill development.
The process of data-based decision making in schools has been shaped both by a prevailing belief concerning which data are important to examine and an existing infrastructure that constrains what data are routinely collected to those of a primarily academic nature. These factors also limit the role of the school counselor in data-based discussions about student achievement. With the end of the NCLB era and the ushering in of ESSA, all educators are being asked to address non-cognitive factors and be accountable for showing gains in these areas in addition to academic areas.
A construct-based approach to school counseling. Squier, Nailor, and Carey (2014) extensively reviewed the educational and developmental psychology literature to determine what capabilities are strongly related to students’ academic achievement and later success in life. The authors intentionally chose lines of research connected to student competencies in the academic, personal/social and career domains that comprise the school counseling ASCA (2012) National Model. Squier and colleagues (2014) established four overarching constructs that explicitly link to student success: (a) motivation, the forces that compel action and direct the behavior of individuals; (b) self-knowledge, the understanding that people have about their own abilities, values, preferences and skills and a necessary precondition for effective self-regulation; (c) self-direction, being able to identify one’s own life directions, to make academic choices consistent with these directions and to connect classroom learning to life goals; and (d) relationships, the ability to establish and maintain productive, collaborative, social relationships with teachers and peers. These four constructs have been shown to be strongly associated with students’ academic achievement and well-being; they also are considered to be malleable, receptive to intervention and within the range of expertise of school counselors (Bass, Lee, Wells, Carey, & Lee, 2015).
Multi-Tiered System of Supports
Use of MTSS is the recommended process for assessing and potentially intervening with an array of academic, behavioral and social-emotional issues while promoting schoolwide systems change (Lane, Menzies, Ennis, & Bezdek, 2013). An MTSS approach aligns closely with the ASCA (2012) National Standards and the work of school counselors in implementing prevention-based initiatives at a schoolwide level while providing more targeted intervention-based supports for students in need. It should be noted that MTSS is neither overly prescriptive nor rigid and has varying implementations and utility based on school districts’ needs.
Schools use MTSS to approach issues within the student population in tiers and place students in such tiers in order to appropriately address their needs. For example, the primary tier refers to a universal intervention geared toward the general student body, whose members may not be faced with distinct difficulty, thereby focusing on prevention to reduce potential problems (Horner, Sugai, & Anderson, 2010). The secondary tier refers to interventions for at-risk students, which typically involve more small group-based and individual interventions for those students still demonstrating difficulty after receiving primary intervention and support (Horner et al., 2010). The tertiary tier refers to working with students who are faced with identified difficulties and have not responded efficiently to primary or secondary levels and are subsequently in need of significant school- and community-based supports (Horner et al., 2010).
An MTSS approach can be conceptualized as incorporating elements of Response to Intervention (RTI) and Positive Behavioral Interventions and Supports (PBIS; Sugai & Horner, 2009). While RTI brings forth opportunities for preventative approaches and early intervention for students struggling with academic skills (Sandomierski, Kincaid, & Algozzine, 2007), MTSS incorporates a broader focus on both academic and social-emotional matters. Within the PBIS framework, the primary focus is on promoting consistent behavior expectations and systems of support to incentivize behaviors of all students within a school (Bohanon, Fenning, Eber, & Flannery, 2007). Both RTI and PBIS utilize MTSS, and specifically tiered intervention delivery, to accommodate the range of student needs. These frameworks are closely aligned in regards to their prevention foci, problem solving, implementation fidelity and data-based decision making (Sugai & Horner, 2009).
Elementary and Secondary School Counseling Program Grant
The ESSCP grant was established by the U.S. Department of Education (USDOE) to provide funding for school districts that demonstrate “the greatest need for counseling services, propose the most innovative and promising approaches, and show the greatest potential for their approach to be replicated and disseminated” (Rentner & Price, 2014, p. 28). To be eligible, proposed projects must incorporate a preventative approach, and effectiveness must at least in part be measured by: (a) the reduction in school counselor-to-student ratios in the district, and (b) decreases in student discipline referrals (USDOE, 2015). Selected projects also must involve the collection, examination, and use of high-quality and timely data, including data on program participant outcomes, and improving instructional practices, policies, and student outcomes (Rentner & Price, 2014).
The current grant project was considered trailblazing in its approach to expanding the data-based decision-making process in the district through a number of initiatives, including the following: (a) identifying research-based social-emotional indicators that link to academic and behavioral school success; (b) creating a user-friendly system for routinely collecting data on these critical areas of student development; and (c) developing the data literacy skills of school counselors in order to ensure that this social-emotional data would continue to be gathered, analyzed and included in data-based discussions long after the grant project had concluded. The funds provided by the ESSCP grant to support these initiatives enhanced the existing RTI model enacted by the school district by integrating a wide range of data related to student development and thus allowed data team members to examine the relationship between social-emotional factors and academic achievement, conducive to a more effective and comprehensive MTSS approach. Through a sophisticated new data collection infrastructure, as well as school counselors’ service in a leadership role, a nuanced and more targeted system of tiered supports emerged that allows the district to respond to a wide range of non-cognitive as well as cognitive issues.
Method
The grant project, formally entitled “An Asset Building Culture,” consisted of four primary initiatives: (a) hiring school counselors in order to create more favorable counselor-to-student ratios, (b) reducing the number of disciplinary incidents, (c) establishing a robust system of strengths-based social-emotional data collection grounded in sound theory, and (d) building human capacity and the technological means to incorporate new social-emotional information in a formal data-based decision-making process. These initiatives would subsequently inform a continuum of cognitive and non-cognitive supports and services within an MTSS model. Ultimately, the goal was to create positive systemic change within the district in which school counselors serve as leaders in using data as a tool for supporting students’ social-emotional, academic and behavioral development.
Setting and Participants
The project was conducted in an urban suburb with a population of approximately 30,000, located in the Northeast region of the United States. The district served nearly 3,000 students and had four elementary schools. More than half of the students were considered low-income and 43% did not speak English as their first language, with 52% identifying as Black/African American, 17% Asian-American, 15% White/Caucasian, 12% Hispanic/Latino/a, and 4% as Multiracial. The racial diversity represented in students was not reflected in its school staff, as more than 80% identified as White/Caucasian.
The school district was awarded the ESSCP grant in 2012. The grant team, comprised of school district leadership, Unique Potential Consulting (UPC), the Ronald H. Fredrickson Center for School Counseling Outcome Research and Evaluation (CSCORE), and Sebastian Management oversaw the grant project’s objectives. UPC served as coordinator of the day-to-day operations of the grant project and provided coaching and professional development to the district’s superintendent, elementary school principals and four grant school counselors. By allocating grant resources to this coordinator position, the project had an advocate for transformed school counseling practices who kept grant priorities in focus amidst other district initiatives. As evaluator of the grant, CSCORE collected quantitative and qualitative data to measure project outcomes and provided training in evidence-based practice to school counselors and district administrators.
Improving School Counselor-to-Student Ratios
The ASCA (2012) National Standards recommend a ratio of one school counselor to every 250 students, though the national average is actually well above these recommendations at nearly 1:500 (Carey & Dimmitt, 2012). Ample research suggests that school counselors have a positive impact on students’ academic, social-emotional and behavioral outcomes (Lapan, Gysbers, & Petroski, 2001; Lapan, Gysbers, & Sun, 1997; Sink & Stroh, 2003; Webb, Brigman, & Campbell, 2005), with further research suggesting that these ratios matter a great deal in a school counseling program’s overall effectiveness (Carrell & Carrell, 2006; Lapan, Whitcomb, & Aleman, 2012). Improving these ratios is especially impactful in high-poverty school districts (Lapan, Gysbers, Stanley, & Pierce, 2012).
Prior to the ESSCP grant, the district’s elementary school staff did not include school counselors at all, resulting in very high mental health provider-to-student ratios. Hiring four school counselors at the beginning of the grant period brought the counselor caseload ratios down to 1:369. Because the district experienced economies of hiring, the grant team added a half-time school counselor in the 2013–2014 school year, further reducing the ratio of school counselor to student to 1:340 despite an increase in enrollment. Grant monies continued to fund each of the 4.5 school counseling positions in the subsequent two school years, strengthening the district’s capacity to provide a broad range of services to students and maintain ratios more closely aligned with ASCA recommendations.
Office Discipline Referral Data
Office discipline referrals (ODR) offer a measure of both individual student behavior and school climate (Clonan, McDougal, Clark, & Davison, 2007; McIntosh, Frank, & Spaulding, 2010) and convey valuable information about students’ social-emotional competencies. A primary requirement of the ESSCP grant was to reduce the number of disciplinary infractions in the district and to demonstrate this improvement through ODR data. The process of determining baseline discipline data revealed great variability in how these incidents were both defined and recorded across different schools. Collecting and using valid discipline data is essential for creating safe schools conducive to teaching and learning (USDOE, 2015), and systematic data collection offers useful information for “understanding and ameliorating individual student and school-wide disruptive behavior problems” (Rusby, Taylor, & Foster, 2007, p. 333). The grant team therefore established new protocols for collecting discipline data in the district’s elementary schools, including creating a standardized ODR form that provided detailed information about the nature and frequency of disciplinary infractions. In addition, the district moved from a paper to an electronic system of recording these data.
The revised ODR form included a comprehensive list of disciplinary infractions that teachers considered high incidence behaviors in the elementary schools. The form was divided into three tiers to delineate progressive levels of severity. Level 1 infractions, such as “failure to obey classroom rules/procedures,” were regarded as problematic behaviors to be managed within the classroom. Documenting Level 1 infractions provided a data-based mechanism for teachers to record a student’s behavioral challenges in the classroom, and this information could be used within an MTSS model to justify the need for additional support or special education services. Level 2 infractions were considered more serious and included behaviors such as “using obscene language/gestures or a repeated offense of the same Level 1 behavior.” Teachers involved the assistance of other staff, such as another teacher or the school counselor, in handling Level 2 infractions. A list of classroom management and behavioral strategies also were listed on the ODR form, and teachers were asked to indicate any strategy they employed in addressing Level 1 or Level 2 problem behaviors. Infractions at Level 3 were recognized as major offenses and warranted involvement of the building principal. Level 3 infractions were further divided into two categories so that crisis incidents demanding immediate action and state reporting, such as “possession of a weapon” or “physical attack on a student or staff,” were recorded separately. The ODR form also included name of staff making the referral, grade of student, date and time of disciplinary incident, location where infraction took place and administrative action taken. In addition, space was provided for teachers to write a brief narrative about events as they occurred, including possible motivation for observed behaviors. The ODR form was revised multiple times based on feedback from principals, teachers and school counselors and piloted during the second year of the grant project.
The Protective Factors Index
The ESSCP grant was launched at a time when district leadership was considering introducing a standards-based student report card. Standards-based report cards list specific skills and knowledge linked to learning standards in each academic subject, and classroom teachers assess a student’s proficiency in each of these areas using a rating scale instead of traditional grades (Swan, Guskey, & Jung, 2014). This shift in practice for measuring academic performance provided an opportunity to create a district-wide system for assessing students’ social-emotional development to inform a more elaborate MTSS framework. While most elementary-level report cards contain a section for behavior or deportment, these indicators may not systematically align with research on personal, social and emotional factors related to achievement and success. In addition, teachers are often asked to rate student behavior without reference to a rubric that would ensure the reliability and validity of these ratings (Squier et al., 2014). To ground the new behavioral component of the report card in the research base, the grant team used the aforementioned Construct-Based Approach to School Counseling (CBA; Squier et al., 2014).
Incorporation of CBA included the identification of four social-emotional constructs that correlate with academic achievement. The grant team broke these constructs down into 15 indicators, which they deemed protective factors. The Protective Factors Index (PFI) was created as the assessment instrument for systematically collecting social-emotional data. Furthermore, the grant team developed a number of specific and measurable competency indicators related to each construct (see Table 1). In addition to being informed by a strong research base, the grant team wanted to ensure that each indicator reflected competencies considered relevant by staff and families in the grant school district. A representative group of school counselors, teachers from each grade level, a teacher of English Language Learners, a special education teacher and the principals from each school reviewed the 15 original PFI items for developmental appropriateness and cultural sensitivity. The group expressed misgivings about two standards under the self-knowledge construct (i.e., “identifies personal feelings,” and “identifies personal strengths and abilities”). There was concern that these behaviors involved attributes valued more by the dominant culture and that benchmarking students against what families might view as culturally specific standards was not fair. These items were therefore omitted from the pilot version, leaving a total of 13 items.
Once the final version was complete, teachers assessed students’ social-emotional development on each of the PFI’s indicators when grading report cards three times a year. In order to expand the consistency of the PFI and subsequently improve inter-rater reliability in data analysis, the grant team also created a scoring rubric to assist teachers in more accurately assigning ratings to these social-emotional indicators.
Creating a scoring rubric. In order to assist teachers in assessing the behaviors and attitudes that comprise the PFI within a developmental lens, the rubric was organized into three levels (K–1st, 2nd–3rd, and 4th–5th grades) to delineate the expected progression for each PFI indicator. The rubric lists specific, observable behaviors to help teachers determine whether a student was demonstrating age-appropriate skills in each domain. For example, descriptors to assess whether a kindergarten or first grade student “works collaboratively in groups of various sizes” included the descriptor “interacts appropriately with peers in group activities,” and “contributes ideas in a group.” Descriptors for second- and third-grade students included the same two behaviors as the earlier grades as well as “shows respect for others by listening to their ideas and opinions.” For fourth- and fifth-grade students “agrees or disagrees with others in a respectful manner” was added to the rubric descriptors. The rubric helped to ensure greater accuracy and consistency in scoring behaviors across classrooms and to reduce subjectivity in teachers’ ratings.
During the first year of the project, teachers requested a simple dichotomous response set for assessing PFI indicators (i.e., “struggling” or “on target”). After a successful year of piloting the new report card and accompanying rubric, teachers requested to move to a four-item response format: meets standard, progressing toward standard, emerging, and not meeting standard. The grant team expanded the original rubric, anchoring responses in degrees of support needed for a student to successfully demonstrate a behavior. Teachers were again provided concrete examples of student behavior within the rubric and were asked to assess if a student consistently and independently displayed the behavior or whether the student needed occasional, frequent or ongoing support to meet the standard.
Table 1
Summary of Primary Constructs and Indicators in the PFI
| Primary Construct |
Indicators |
| Motivation |
Engages in class activities |
|
Demonstrates an eagerness to learn |
|
Demonstrates perseverance in completing tasks |
| Self-Knowledge |
Identifies academic strengths and abilities |
|
Identifies things he/she is interested in learning |
| Self-Direction |
Demonstrates the ability to self-regulate actions and emotions |
|
Demonstrates resilience after setbacks |
|
Makes productive use of classroom time |
| Relationships |
Works collaboratively in groups of various sizes |
|
Seeks assistance when necessary |
|
Respects and accepts authority |
|
Forms respectful, equitable relationships with peers |
Building Technological and Human Capacity
Developing a more comprehensive approach to using data requires that educators have access to meaningful and useful data (Poynton & Carey, 2006). Technology is a key component to establishing effective data use, and research has demonstrated that the state of computer systems can hinder this process in schools (Mandinach, 2012; Wayman, Jimerson, & Cho, 2012) and that easy, integrated and timely access to data facilitates the data-based decision-making process (Ikemoto & Marsh, 2007; Wayman, 2005). Staff at the grant site could readily access classroom grades, state test scores and other achievement data through the district’s Student Information System (SIS). A primary objective of the grant project was to develop the infrastructure to support the same ease of access to important social-emotional indicators. The grant’s technology consultant worked with the district to interface the PFI data recorded on the new report card with the district’s SIS. Teachers, counselors and administrators could then view information about a student’s engagement in class activities or perseverance in completing tasks in the same way they could examine a student’s academic data. The technology consultant also wrote queries to extract PFI data from the SIS into user-friendly Excel reports so that school counselors could disaggregate the data by demographic variables such as gender, grade level or subsidized lunch status. Data also were aggregated at the classroom, grade or building level. The consultant then trained the school counselors to use Excel to illustrate on graphs the number of students struggling with specific PFI indicators (e.g., self-regulation, cooperation, motivation). These graphs could be organized by grade level, school site and individual students. Building strong technological capacity and functionality provides an essential foundation for effective data use. However, translating the wealth of data collected by schools into meaningful actions to support student success within an MTSS framework also requires building human capacity in data literacy skills (Ikemoto & Marsh, 2007; Mandinach, 2012; Wayman, 2005; Wayman & Stringfield, 2006). To build these competencies among school counselors, the grant team organized monthly professional development workshops in evidence-based practice, tiered interventions, data-based decision making, data analysis, and Excel charting and graphing. Counselors learned to extract the PFI data from the SIS, conduct simple analyses to determine what issues existed at various levels within the building, and create graphs to share with teachers and other educators at building-based data team meetings (see Figure 1).
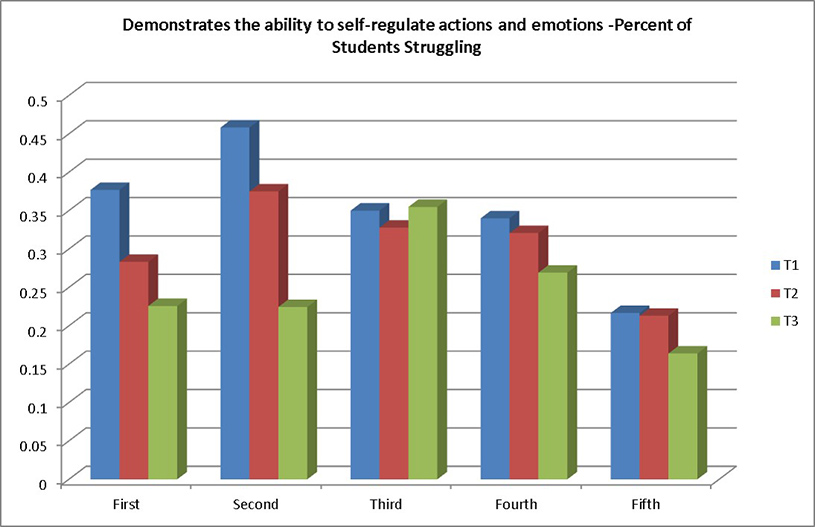
Figure 1. Sample of PFI data aggregated by a Single Indicator, Grade Level, and School Site
Results
The district’s elementary schools had previously stored hard copies of disciplinary incident forms in the principal’s office. This system did not support easy analysis of disciplinary data or examination of behavioral issues in the building. In the revised process, an administrative assistant electronically entered all information from the new ODR form into the school’s SIS database. The electronic system allowed staff to quickly determine the total number of disciplinary infractions in the building over a given period, identify patterns in the data such as a spike in infractions immediately before vacations, and disaggregate the data to determine the frequency of different problem behaviors among various subgroups of students. This streamlined method of data collection also enabled staff to identify possible trends in disciplinary infractions. If data revealed issues such as disproportionality in the district, school counselors served as advocates in establishing more equitable protocols around discipline policies. Notably, the number of disciplinary infractions dropped significantly throughout the 3-year grant program.
Data collected from the PFI provided valuable information to all stakeholders about students’ social-emotional competency development. Because teachers observe behavior and peer interactions every day, their perspective provides a keen understanding of whether a student is able to put into practice each of the indicators listed. In addition, since teachers rate students on the PFI multiple times each year through the district’s electronic report cards, educators throughout the building had access to real-time data about behavioral issues impacting individuals or groups of students. The school counseling program, which prior to this grant project had not been established, consistently reviewed these data, generated charts to determine where gaps existed in social-emotional or academic skill areas and focused their weekly classroom guidance lessons on teaching these competencies. Subsequent report card data were also analyzed to evaluate the impact of counseling lessons on students’ skill development.
Data Teams and a Multi-Tiered System of Supports
Prior to the district’s ESSCP award, data teams were operating at each elementary school and were led by the building principal. Student names were only considered for data team discussion if a teacher completed a referral form indicating a student was struggling academically in the classroom. These forms, often inconsistently completed and comprised largely of teachers’ perceptions about academic performance, served as the principal mechanism for identifying at-risk students. The only other information frequently reviewed by data teams were standardized test scores, classroom grades and serious behavioral infractions. Interventions to support students were almost exclusively academic in nature.
The grant team collaborated with staff to restructure data teams to include social-emotional data analysis. Data teams were then able to expand their RTI approach to a more expansive MTSS framework to include multi-tiered counseling interventions in addition to existing academic interventions. School counselors created graphs and charts of PFI, ODR and attendance data to illustrate such trends as common behavioral issues across grade levels or attendance patterns during certain days of the week or times of year. Data team members reviewed these graphs to identify gaps in social-emotional, behavioral or academic skill areas. Meetings shifted from an almost exclusive focus on academic data to considering multiple sources of achievement, demographic, behavioral and social-emotional variables. As teams explored the relationship across different types of data, a greater understanding began to emerge about how social-emotional factors, such as those included in the PFI, impact academic achievement. The charge of the data teams became deciding which tiered interventions (universal, targeted and intensive) were indicated to promote the development of academic competencies as well as of the protective factors to support school success for every student.
School Counselors’ Contributions to a Multi-Tiered System of Supports
Access to accurate and real-time data about student behaviors enabled school counselors to more effectively develop tiered interventions for students and environments in need of support. The PFI data were collected three times a year at the close of each marking period. Behavioral data gathered through the revised ODR form were updated in the SIS weekly. Attendance data at the elementary school sites were available daily. Access to these real-time data allowed school counselors to continuously monitor students’ social-emotional and academic progress. It also enabled counselors to easily evaluate whether their interventions were creating the desired impact. In this continuous process of data-based decision-making, the same set of data indicators, examined at different points throughout the school year, informed school counselors’ decisions about which interventions were needed and also served as outcome data to evaluate interventions at each tier.
Schoolwide, Tier 1 interventions included delivery of success classes to all students. School counselors developed a developmental guidance curriculum with 10 lessons per grade grounded in the evidence-based programs zones of regulation (Kuypers, n.d.) and second step (Low, Cook, Smolkowski, & Buntain-Ricklefs, 2015), with weekly lesson content guided by areas of improvement demonstrated in the PFI data and behavioral data represented in discipline referrals. In addition, a school counseling program “Expo” was held at the end of each year, and parents and guardians were invited to the school to see artifacts generated by students in success class. Additional schoolwide interventions included the character trait of the month project, focused on the development of positive qualities such as respect, honesty and courage, and a parent newsletter sent out by the counseling department explaining what could be done at home to enhance the development of social-emotional competencies (i.e., informing parents and guardians of the character trait of the month, suggesting a “conversation starter” about current classroom activities, and recommending related books to read with their children).
Students who were struggling academically and for whom PFI and ODR data indicated a need for additional behavioral support and social-emotional competency instruction received Tier 2 services through small group counseling sessions. School counselors facilitated groups on topics related to PFI indicators such as self-regulation, resilience and motivation throughout the year. The school counselors used discipline data, often in combination with report card indicators reflecting students’ social-emotional competencies, to determine membership in targeted small group counseling sessions and continued participation in this targeted intervention. Subsequent ODR data was reviewed to evaluate changes in students pre- to post-intervention, as these data have been demonstrated to be sensitive measures of the impact of schoolwide interventions (Irvin, Tobin, Sprague, Sugai, & Vincent, 2004; Rusby et al., 2007). School counselors also created progress monitoring tools to assess social skill development during a group cycle. As with academically focused tiered instruction, teachers were asked to briefly rate student growth so that small group instruction could be modified in a continuous formative assessment process.
The continuum of counseling services also included development of a Summer Boot Camp Transition Program. School counselors collected quantitative and qualitative survey data from sixth graders in the district about their experience in moving from elementary to middle school, which indicated that some students were anxious about this transition and wanted more support and information about the process. To proactively address these common issues, the school counselors created a series of four week-long summer boot camps that were free of charge and open to all district fifth graders. Classroom lessons and group activities for the camp were drawn from the evidence-based curricula Student Success Skills (Webb & Brigman, 2006), WhyTry (Bird, 2010) and The Real Game (Barry, n.d.) and covered topics critical to success in middle school such as perseverance, organizational skills and study strategies.
Finally, PFI, ODR and standards-based report card data also guided decisions about Tier 3 interventions. School counselors developed Behavior Improvement Plans (BIPs) for students in need of intensive behavioral support in the classroom. They also coordinated with special education or other mental health professionals when referrals were warranted.
Positive Systemic Change
The grant initiatives resulted in definitive progress and positive systemic changes throughout the district. A new policy was established which mandated that counseling groups be formed based on issues identified in the data and no longer simply by teacher request or anecdotal evidence. This more objective approach to determining which students were in need of Tier 2 social-emotional interventions ensured that students with a documented need for additional assistance received these services.
At the beginning of the grant period, the district had been declared “underperforming” by state rankings and was mandated to write an annual Accelerated Improvement Plan (AIP). Throughout the 3-year grant cycle, a number of elements from the grant project were embedded in the AIP including: (a) revising K–5 report cards to use a standards-based system, (b) integration of the PFI within the new report cards, (c) designing and delivering a developmental guidance curriculum for grades K–5, (d) collaborating with building principals to incorporate social-emotional data into data team meetings, and (e) developing tiered strategies to better address the social-emotional needs of struggling students. Officials from the State Department of Education who monitored the AIP expressed their belief that these initiatives contributed to the district’s overall improvement and began to send other struggling school systems to the grant district to learn specifically about their data-based MTSS approach and the school counselors’ role in it.
Ultimately, the success of the grant within the district can perhaps best be measured by two key administrative decisions made when grant funding ended: (a) the decision to retain the school counselors, as teachers and administrators now saw these professionals—who had not been employed at the district before the grant—as indispensable to student success; and (b) the decision to hire UPC (who had worked as project coordinator for the grant) to work to support the expansion of the grant initiatives to the middle school and high school over the next several years. At the time of this article’s publication, work was underway to identify means to collect social-emotional data at the middle and high school levels so that their multi-tiered system of supports can be as robust as that at the elementary level.
Discussion and Implications for School Counselors
Data-based decision making has become an essential component of educational practice (Mandinach, 2012). The implementation of NCLB and standards-based education have created strong pressure for schools to demonstrate improved student performance through state test scores (Ikemoto & Marsh, 2007; Marsh et al., 2006). These data often become the primary consideration of data-driven discussions as schools strive to meet state and federal requirements. Data use has the potential, however, to be more than simply a response to meeting accountability demands. The data-based decision-making process can be transformed when multiple forms of data are viewed from different professional perspectives to better describe the factors and contexts that influence student success (Mandinach, 2012). Fortunately, the new ESSA legislation stresses the importance of considering non-academic data to foster a broader vision of student success. Clearly describing what is happening for an individual or to groups of students requires “a body of relevant data, with each individual data element imparting a complementary piece of the puzzle” (National Forum on Education Statistics, 2012, p. 9).
An integrative approach to data-based decision making requires the technological capacity to organize data into user-friendly formats. It also may necessitate the collection of data beyond the scope of what is traditionally stored in district’s information systems (Poynton & Carey, 2006). Behavior in the classroom occurs within the broader context of a student’s life and developing interventions to support student success requires collecting data that reflect this context (National Forum on Education Statistics, 2012). Creating a data collection infrastructure that allows those who observe students on a daily basis (e.g., teachers) to rate social-emotional competency attainment in addition to academic competency attainment on a regular basis is a complex undertaking, but one that has very promising potential. When educators triangulate data by using multiple types and sources of data, the relationship between academic outcomes and social-emotional factors is better understood and reliance on a single data point, such as academic scores, is reduced (Marsh et al., 2006).
The grant team developed a number of initiatives designed not only to fulfill requirements of the ESSCP award, but also to create systemic changes around the culture of data use and continuum of tiered supports in the district. Each individual grant initiative aimed to improve a particular aspect of data-based decision making: incorporating research-based social-emotional indicators into the elementary school report cards, creating the infrastructure for easy and timely access to these data, developing new protocols for collecting discipline data, and building the data literacy skills of school counselors. The combined effect of each of these initiatives was a restructuring of building-based data teams that operated from a strong MTSS; these included the following: (a) coordination of schoolwide prevention efforts and systems, (b) universal screening and progress monitoring, (c) selection and use of evidence-based practices, (d) professional development that targets evidence-based practice, (e) evaluating outcomes using data-based decision making, and (f) leadership commitment from administrators and school-based teams that supports schoolwide implementation (Harn, Basaraba, Chard, & Fritz, 2015; Kame’enui, Good, & Harn, 2005; Sugai & Horner, 2009).
Notably, the grant project integrated an academic, behavioral, and social-emotional focus in the gathering of data, examined how specific behaviors and social-emotional skills impacted student achievement, and subsequently selected targeted interventions to build the competencies needed for school success. Although the majority of research and scholarly discussion has focused on using data-based decision-making models for academic concerns, researchers have proposed a similar model for social-emotional and behavioral problems (Eber, Sugai, Smith, & Scott, 2002; Fairbanks, Sugai, Guardino, & Lathrop, 2007; Gresham, 1991; Sugai, Horner, & Lewis, 2009). Though currently the majority of schools are operating these schoolwide efforts independently (McIntosh, Bohanan, & Goodman, 2010), there is a growing call for the holistic approach MTSS offers due to the known interaction of academic, behavioral and social-emotional issues in students who struggle (Mclntosh, Horner, Chard, Boland, & Good, 2006).
The grant project’s approach to adopting MTSS was also unique in the pivotal role of school counselors in the data-based decision-making process. The role of the school counselor is infrequently defined in the RTI literature (Gruman & Hoelzen, 2011) or in educational reform agendas (Dahir, 2004). School counselors have sometimes been seen as resistant to using data (Young & Kaffenberger, 2011). However, school counselors work at the intersection of the academic and social-emotional domains (ASCA, 2012) and support student development across these areas. School counselors, previously not represented on the building data teams, have now become data leaders in these schools. Because data-based decision making has focused largely on academic achievement, data use may have been seen as the charge of the classroom teacher. Through grant-based professional development workshops, the counselors developed competencies in organizing, analyzing and graphing data. These new skills have enabled the school counselors to lead data-based conversations, develop progress monitoring tools and create results reports for administrators and the school committee. Using data routinely collected through the SIS provides an efficient and timely access to not only determine which interventions are needed, but also to evaluate the impact of the schoolwide counseling curriculum, targeted small groups and other activities.
This mode of data collection represents a change from the pre/posttest method commonly employed by school counselors. Pre/posttests may provide information about whether students learned the content of a specific lesson but do not show whether students are applying these skills, attitudes or beliefs in their lives. School counselors can contribute unique insights to the data team process by going a step further and helping to determine the underlying causes for a student’s misbehavior or poor academic performance. Incorporating social-emotional indicators into data-based discussions may make the process feel more relevant to the work of the school counselor. In fact, many of the words used to describe this more comprehensive approach to data (e.g., relationships, linking, connecting, inclusion and contextualizing) sound more from the counseling lexicon than from a statistics textbook.
The overarching goal of this pilot project was to create a meaningful data-based decision-making process to promote an MTSS model based on academic and social-emotional data. Therefore, the success of this project contributes ideas as to not only what non-academic data can be analyzed, but also how to go about collecting, analyzing and incorporating findings into the planning around a continuum of supports to foster student success. Using research-based constructs, redesigning report cards, developing rubrics, identifying professional development needs, and developing human technological capacity to manage and interpret data are feasible and effective strategies to support achievement. Ultimately, discussions shifted from examining symptoms of an issue—such as disciplinary infractions, low grades and test scores, or poor attendance—to trying to unearth the underlying causes for student issues and how the school could support growth with a variety of academic and social-emotional tiered supports.
Limitations and Directions for Future Research
The grant project was not designed or implemented as an experimental study; therefore, we cannot know with certainty whether the implementation of the grant initiatives and subsequent positive outcomes share a causal relationship. Furthermore, we cannot yet know which specific elements of the grant project brought about the most positive change, or whether some elements may have been superfluous, as outcomes have been viewed as a comprehensive result of all grant-related activities. Future research involving an experimental study in which: (a) outcomes are compared to similar schools that did not received grant-funded resources; and (b) there are outcomes measures in place for each grant initiative, is recommended. Moreover, additional studies that expand these efforts to students and schools in different regions, grade levels and with a higher number of participants also is suggested.
Although the PFI is a promising new instrument for the measurement of positive social-emotional behaviors in the classroom, further research is necessary to validate its use as a universal brief screener. Bass and colleagues (2015) conducted a confirmatory factor analysis with the PFI using data gathered during the present grant project, which resulted in a three factor measurement model rather than four as hypothesized. These findings warrant further exploration with additional populations of students to determine whether they will be replicated. The PFI also relies on teacher observation, which occurs consistently at the elementary school level; therefore, it would be valuable to study its use in upper grades (i.e., middle school and high school) to verify whether the PFI is still a reliable and valid instrument in settings where teachers experience less face-to-face time with each individual student throughout the school day.
Finally, it bears noting that the research base is still emerging around social-emotional learning and which competencies best link to school success. There is not even consensus within the scholarly community on how to refer to these constructs (e.g., non-cognitive factors, non-academic skills, soft skills, grit). Further research will be necessary to determine which social-emotional learning theory or theories exhibit applicability in school settings, and the development of assessment instrumentation based on a CBA in particular is still in its early stages.
Conclusion
The ESSCP grant offered by the USDOE provides funding to establish and improve school counseling programs in high-needs school districts. The current grant project was implemented at four elementary sites in a diverse school district in an urban suburb of the Northeastern United States. Specific grant initiatives included the hiring of four full-time and one part-time school counselor in order to reduce the student-to-counselor ratio. The office discipline referral process was restructured to include greater specificity and objectivity, and the PFI was developed in order to provide an assessment tool of social-emotional competencies in the classroom. School counselors also were provided training in how to collect, analyze and include social-emotional data in the data-based decision-making process. Subsequently, the combination of a new school counseling program and data on discipline and social-emotional competencies along with existing academic data resulted in a much-improved MTSS model in the district, providing a continuum of supports for students’ needs. The study sheds light on the value of providing school counseling at the elementary level and the importance of data literacy and advocacy as a major tenet of these positions. As ESSCP grants are awarded based on their potential for replication and dissemination, the initiatives described in this manuscript represent innovative practices that hold tremendous promise at a national level.
Conflict of Interest and Funding Disclosure
The authors reported no conflict of interest or funding contributions for the development of this manuscript.
References
American School Counselor Association. (2012). The ASCA national model: A framework for school counseling programs (3rd ed.). Alexandria, VA: Author.
American School Counselor Association. (2014). Mindsets & behaviors for student success: K-12 college and career-readiness standards for every student. Alexandria, VA: Author.
Barry, B. (n.d.). The Real Game design process. Retrieved from http://www.realgame.org/process.html
Bass, G., Lee, J. H., Wells, C. W., Carey, J. C., & Lee, S. (2015). Development and factor analysis of the Protective Factors Index: A report card section related to the work of school counselors. The Professional Counselor, 5, 516–528. doi:10.15241/gb.5.4.516
Bird, B. (2010). WhyTry evaluation report 2006–2010. Churchill County Probation Report, Field Research. Retrieved from https://www.whytry.org/index.php?option=com_content&view=article&id=109
Bohanon, H., Fenning, P., Eber, L., & Flannery, B. (2007). Identifying a roadmap of support for secondary students in school-wide positive behavior support applications. International Journal of Special Education, 22, 39–52.
Carey, J., & Dimmitt, C. (2012). School counseling and student outcomes: Summary of six statewide studies. Professional School Counseling, 16, 146–153.
Carrell, S. E., & Carrell, S. A. (2006). Do lower student to counselor ratios reduce school disciplinary problems? The BE Journal of Economic Analysis & Policy, 5, 1–24.
Clonan, S. M., McDougal, J. L., Clark, K., & Davison, S. (2007). Use of office discipline referrals in school-wide decision making: A practical example. Psychology in the Schools, 44, 19–27.
Dahir, C. A. (2004). Supporting a nation of learners: The role of school counseling in educational reform. Journal of Counseling & Development, 82, 344–353. doi:10.1002/j.1556-6678.2004.tb00320.x
Dahir, C. A., & Stone, C. B. (2009). School counselor accountability: The path to social justice and systemic change. Journal of Counseling & Development, 87, 12–20. doi:10.1002/j.1556-6678.2009.tb00544.x
Dimmitt, C., Carey, J. C., & Hatch, T. (Eds.) (2007). Evidence-based school counseling: Making a difference with data-driven practices. Thousand Oaks, CA: Corwin.
Eber, L., Sugai, G., Smith, C. R., & Scott, T. M. (2002). Wraparound and positive behavioral interventions and supports in the schools. Journal of Emotional and Behavioral Disorders, 10, 171–180. doi:10.1177/10634266020100030501
Every Student Succeeds Act (2015) Pub. L. No. 114–95. Retrieved from https://www.congress.gov/bill/114th-congress/senate-bill/1177
Fairbanks, S., Sugai, G., Guardino, D., & Lathrop, M. (2007). Response to intervention: Examining classroom behavior support in second grade. Exceptional Children, 73, 288–310. doi:10.1177/001440290707300302
Farrington, C. A., Roderick, M., Allensworth, E., Nagaoka, J., Keyes, T. S., Johnson, D. W., & Beechum, N. O. (2012). Teaching adolescents to become learners – the role of noncognitive factors in shaping school performance: A critical literature review. Chicago, IL: University of Chicago Consortium on Chicago School Research.
Gresham, F. M. (1991). Conceptualizing behavior disorders in terms of resistance to intervention. School Psychology Review, 20, 23–36.
Gruman, D. H., & Hoelzen, B. (2011). Determining responsiveness to school counseling interventions using behavioral observations. Professional School Counseling, 14, 183–190.
Harn, B., Basaraba, D., Chard, D., & Fritz, R. (2015). The impact of schoolwide prevention efforts: Lessons learned from implementing independent academic and behavior support systems. Learning Disabilities: A Contemporary Journal, 13, 3–20.
Hayes, R. L., Nelson, J.-L., Tabin, M., Pearson, G., & Worthy, C. (2002). Using school-wide data to advocate for student success. Professional School Counseling, 6, 86–94.
Heckman, J. J., & Rubinstein, Y. (2001). The importance of noncognitive skills: Lessons from the GED testing program. The American Economic Review, 91, 145–149.
Horner, R. H., Sugai, G. M., & Anderson, C. M. (2010). Examining the evidence base for school-wide positive behavior support. Focus on Exceptional Children, 42(8), 1–14.
House, R. M., & Hayes, R. L. (2002). School counselors: Becoming key players in school reform. Professional School Counseling, 5, 249–256.
Ikemoto, G. S., & Marsh, J. A. (2007). Cutting through the “data-driven” mantra: Different conceptions of data-driven decision making. YSSE Yearbook of the National Society for the Study of Education, 106, 105–131. doi:10.1111/j.1744-7984.2007.00099.x
Irvin, L. K., Tobin, T. J., Sprague, J. R., Sugai, G., & Vincent, C. G. (2004). Validity of office discipline referral measures as indices of school-wide behavioral status and effects of school-wide behavioral interventions. Journal of Positive Behavior Interventions, 6, 131–147.
Isaacs, M. L. (2003). Data-driven decision making: The engine of accountability. Professional School Counseling, 6, 288–295.
Kame’enui, E. J., Good, R. G., & Harn, B. A. (2005). Beginning reading failure and the quantification of risk: Reading behavior as the supreme index. In W. L. Heward et al. (Eds.), Focus on behavior analysis in education: Achievements, challenges, and opportunities (pp. 69–89).Upper Saddle River, NJ: Prentice Hall.
Kuypers, L. (n.d.). Evidence on the Zones. Retrieved from http://www.zonesofregulation.com/research.html
Lane, K. L., Menzies, H. M., Ennis, R. P., & Bezdek, J. (2013). School-wide systems to promote positive behaviors and facilitate instruction. Journal of Curriculum and Instruction, 7, 6–31. doi:10.3776/joci.2013.v7n1pp6-31
Lapan, R. T., Gysbers, N. C., & Petroski, G. F. (2001). Helping seventh graders be safe and successful: A statewide study of the impact of comprehensive guidance and counseling programs. Journal of Counseling & Development, 79, 320–330.
Lapan, R. T., Gysbers, N. C., Stanley, B., & Pierce, M. E. (2012). Missouri professional school counselors: Ratios
matter, especially in high-poverty schools. Professional School Counseling, 16, 108–116.
Lapan, R. T., Gysbers, N. C., & Sun, Y. (1997). The impact of more fully implemented guidance programs on the school experiences of high school students: A statewide evaluation study. Journal of Counseling & Development, 75, 292–302.
Lapan, R. T., Whitcomb, S. A., & Aleman, N. M. (2012). Connecticut professional school counselors: College and career counseling services and smaller ratios benefit students. Professional School Counseling, 16, 117–124.
Low, S., Cook, C. R., Smolkowski, K., & Buntain-Ricklefs, J. (2015). Promoting social-emotional competence: An evaluation of the elementary version of Second Step. Journal of School Psychology, 53, 463–477.
Mandinach, E. B. (2012). A perfect time for data use: Using data-driven decision making to inform practice. Educational Psychologist, 47, 71–85.
Mandinach, E. B., Honey, M. & Light, D. (2006). A theoretical framework for data driven decision making. Paper presented at the annual meeting of American Educational Research Association, San Francisco, CA. Retrieved from http://cct.edc.org/sites/cct.edc.org/files/publications/DataFrame_AERA06.pdf
Marsh, J. A., Pane, J. F. & Hamilton, L. S. (2006). Making sense of data-driven decision making in education: Evidence from recent RAND research. Retrieved from http://www.rand.org/content/dam/rand/pubs/occasional_
papers/2006/RAND_OP170.pdf
McIntosh, K., Bohanan, H., & Goodman, S. (2010). Toward true integration of academic and behavior response to intervention systems: Part two—Tier 2 support. Communique, 39(3), 4–6.
McIntosh, K., Frank, J. L., & Spaulding, S. A. (2010). Establishing research-based trajectories of office discipline referrals for individual students. School Psychology Review, 39, 380–394.
McIntosh, K., Horner, R. H., Chard, D. J., Boland, J. B., & Good, R. H., III. (2006). The use of reading and behavior screening measures to predict nonresponse to school-wide positive behavior support: A longitudinal analysis. School Psychology Review, 35, 275–291.
National Forum on Education Statistics. (2012). Forum guide to taking action with education data. Washington, DC: Author.
No Child Left Behind Act of 2001. (2002). Pub. L. No. 107-110 § Title V. Retrieved from http://www2.ed.gov/
policy/elsec/leg/esea02/index.html
Poynton, T. A., & Carey, J. C., (2006). An integrative model of data-based decision making for school counseling. Professional School Counseling, 10, 121–130.
Rentner, D. S., & Price, O. A. (2014). A guide to federal education programs that can fund K-12 universal prevention and social and emotional learning activities. Center on Education Policy, 1–40.
Rusby, J. C., Taylor, T. K., & Foster, E. M. (2007). A descriptive study of school discipline referrals in first grade. Psychology in the Schools, 44, 333–350. doi:10.1002/pits.20226
Sandomierski, T., Kincaid, D., & Algozzine, B. (2007). Response to intervention and positive behavior support: Brothers from different mothers or sisters with different misters. Positive Behavioral Interventions and Supports Newsletter, 4(2), 1–4.
Sink, C. A., & Stroh, H. R. (2003). Raising achievement test scores of early elementary school students through comprehensive school counseling programs. Professional School Counseling, 6, 350–364.
Squier, K. L., Nailor, P., & Carey, J. C. (2014). Achieving excellence in school counseling through motivation, self-direction, self- knowledge, and relationships. Thousand Oaks, CA: Corwin.
Sugai, G., & Horner, R. H. (2009). Responsiveness-to-intervention and school-wide positive behavior supports: Integration of multi-tiered system approaches. Exceptionality, 17, 223–237.
Sugai, G., Horner, R., & Lewis, T. (2009). School-wide positive behavior support implementers’ blueprint and self-assessment. Eugene, OR: OSEP TA-Center on Positive Behavioral Interventions and Supports.
Swan, G. M., Guskey, T. R., & Jung, L. A. (2014). Parents’ and teachers’ perceptions of standards-based and traditional report cards. Educational Assessment, Evaluation and Accountability, 26, 289–299.
doi:10.1007/s11092-014-9191-4
Wayman, J. C. (2005). Involving teachers in data-based decision making: Using computer data systems to support teacher inquiry and reflection. Journal of Education for Students Placed at Risk, 10, 295–308. doi:10.1207/s15327671espr1003_5
Wayman, J. C, Jimerson, J. B., & Cho, V. (2012). Organizational considerations in establishing the data-informed district. School Effectiveness and School Improvement, 23, 159–178.
Wayman, J. C., & Stringfield, S. (2006). Technology-supported involvement of entire faculties in examination of student data for instructional improvement. American Journal of Education, 112, 549–571.
Webb, L. D., & Brigman, G. A. (2006). Student Success Skills: Tools and strategies for improved academic and social outcomes. Professional School Counseling, 10, 112–120.
Webb, L. D., Brigman, G. A., & Campbell, C. (2005). Linking school counselors and student success: A replication of the Student Success Skills approach targeting the academic and social competence of students. Professional School Counseling, 8, 407–413.
U.S. Department of Education. (2015). Elementary and secondary school counseling programs. Retrieved from http://www2.ed.gov/programs/elseccounseling/index.html
Young, A., & Kaffenberger, C. J. (2011). The beliefs and practices of school counselors who use data to implement comprehensive school counseling programs. Professional School Counseling, 15, 67–76.
Karen Harrington is the Assistant Director at the Center for Youth Engagement at the University of Massachusetts Amherst. Catherine Griffith is Associate Director at the Ronald H. Fredrickson Center for School Counseling Outcome Research and Evaluation and Assistant Professor at the University of Massachusetts Amherst. Katharine Gray is a leadership coach at Unique Potential Consulting and Leadership Coaching in Hopkinton, MA. Scott Greenspan is a doctoral student at the University of Massachusetts Amherst. Correspondence can be addressed to Karen Harrington, Furcolo Hall, University of Massachusetts, Amherst, MA 01003, Karen.harrington07@gmail.com.
Jul 20, 2016 | Article, Volume 6 - Issue 2
Dee C. Ray, David D. Huffman, David D. Christian, Brittany J. Wilson
The vast majority of graduate students in the social sciences, especially in mental health fields, are females (Crothers et al., 2010; Healey & Hays, 2012). In a recent report on counseling programs, an average of 76% of students admitted and graduated yearly from entry-level counseling programs were women (Schweiger, Henderson, McCaskill, Clawson, & Collins, 2012). Although counseling is one field that attracts mostly female graduate level students, a historical review indicates that males made up approximately 80% of counselor education faculties in the 1980s (Anderson & Rawlins, 1985). In recent years, as the number of females who seek doctoral degrees in counseling has increased, so has the number of female counselor educators, correlating to fewer males entering the field of counselor education. Currently, the average number of males admitted and graduated yearly from doctoral-level counseling programs has been reported at a meager 25% (Schweiger et al., 2012). As counselor educators strive to build best practices for working with diverse populations, it seems relevant to explore the experiences of male counselor educators as well as suggest practices that improve conditions for male counselor education faculty.
In the preparation of counselors, counselor educators are encouraged to build relationships with students that lead to greater self-awareness, personal development and interpersonal learning, which inform their work as counselors. Literature cites the importance of the relationships between counseling faculty and students as “paramount” (Dollarhide & Granello, 2012, p. 290), suggesting that it “stands out above all other factors” (McAuliffe, 2011, p. 32) in the education of adults. It seems reasonable to assume that if counselor educators espouse the importance of the relationship between client and counselor, they extend this value to their students, building relationships that facilitate learning. Thus, a belief that the relationship between teacher and student leads to mutual support and growth comprises the hallmark of humanistic education (Dollarhide & Granello, 2012).
Although the American Counseling Association (ACA) Code of Ethics (2014) asserted that counselor educators are restricted from sexual or romantic relationships with students, universities and counselor education programs typically do not clearly articulate boundaries when approaching the multiple roles adopted by faculty members (Owen & Zwahr-Castro, 2007). In the absence of guidelines and open discussion regarding faculty–student relationships, legal concerns can permeate the university environment. Sexual harassment suits have increased, and many universities have responded by going beyond sexual harassment policies and adding additional policies that restrict sexual or romantic consensual relationships between faculty and students (Bartlett, 2002; Kiley, 2011). Male faculty members seem especially affected by the legal environment and Nicks (1996) reported males had significantly higher concerns than females regarding unjust accusations of harassing a student. In the current environment of legality and ambiguous ethical guidelines, Kress and Dixon (2007) cautioned that counselor educators might choose to distance themselves from students to avoid the appearance of impropriety or placing themselves in complex ethical situations. However, there is a dearth of literature regarding issues of relationship dynamics based on sexuality and gender in academia over the last 20 years.
Further complicating the issue of faculty–student relationships is that female professors and students are more likely to perceive complex relationship issues as unethical when compared to their male counterparts. In a comparison between female and male counselor educators and counselor education students, Bowman, Hatley, and Bowman (1995) found that females were significantly more likely to rate activities outside the traditional student–teacher relationship as unethical. This finding has been supported in multiple studies regarding undergraduate students (Ei & Bowen, 2002; Oldenburg, 2005; Owen & Zwahr-Castro, 2007). Female undergraduate students were more likely to rate a relationship scenario as unethical when the professor was identified as a male as compared to scenarios with female professors (Oldenburg, 2005) and more likely to be negative than males about questionable scenarios such as sexual relationships, doing favors for a professor, and doing things alone with an instructor (Ei & Bowen, 2002). Owen and Zwahr-Castro (2007) found that female undergraduate students judged approximately one-third of faculty–student interaction scenarios as significantly more inappropriate than male students, identifying nonacademic-related interaction that occurred off campus as most inappropriate. Although not specifically explored, the tendency of females to find behaviors unethical when compared to the perceptions of males has been attributed in the literature to sensitivity of women to power differentials and potential for exploitation based on cultural experience (Ei & Bowen, 2002; Owen & Zwahr-Castro, 2007). In the context of current ratios in counselor education of a majority number of female faculty to a minority number of male graduate students, it is difficult to ascertain the perception of power dynamics based on gender.
The changing context of counselor education may present unique challenges for male faculty to navigate with little guidance. A review of the literature highlights a complex environment where male counselor educators engage in faculty–student relationships within a context of power differences and potential legal complications. The current study was conceived in a doctoral level clinical course in which male and female doctoral students processed their teaching experiences with master’s students. During the discussion, male doctoral students serving as instructors shared experiences regarding relationships with their students that appeared uniquely different from experiences shared by female colleagues. Concerns emerged regarding practices of male counselor educators when entering a female-prevalent field as a person in a position of power. As a result, we proposed that the following factors might influence the interactions of male counselor educators on a daily basis in their roles with students: majority of female graduate students, decreasing number of male faculty, increases in legal action, ambiguity of ethical guidelines, possible attraction between professors and students, and a contextual field that values human relationships. The purpose of this study was to discover attitudes and practices of male counselor educators regarding faculty-student relationships. Our research questions included: (a) what are the practices and attitudes of male counselor educators related to relationships with students and colleagues? and (b) what specific practices do male counselor educators employ to maintain boundaries with students?
Methodology
Participants and Data Collection
Using Schweiger et al.’s (2012) compilation of counseling program information, a member of the research team identified names typically attributed to males among listed faculty names, resulting in the identification of 330 males within the United States. The research team then matched the names with e-mails on university Web sites. An initial recruitment e-mail was sent to the identified sample asking for participation. Following the initial recruitment e-mail, 41 of the identified original sample responded as ineligible (22 contact e-mails were immediately returned as unavailable; 6 identified as female; and 13 identified as no longer working as a counselor educator or having never worked as a counselor educator). This resulted in a potential sample of 289. Two more e-mails were sent as reminders regarding participation. The final sample consisted of 163 male counselor educators who completed the survey, resulting in a response rate of 56%.
A summary of demographic characteristics of the 163 male counselor educators who completed the survey is presented in Table 1. In this sample, male counselor educators were mostly White, non-Hispanic (n=125). African American (n=14) and Hispanic (n=11) males also were represented, but only in small numbers, and Asian males (n=4) were few. Most of the sample identified as married/partnered (87%) and heterosexual (89%), with gay or bisexual males represented by approximately 10% of participants. The sample was more diverse in areas of age, rank, child status, and years as counselor educators.
Survey Development
We developed our survey in two phases. The research team brainstormed issues that emerged during discussion, such as the possible attitudes of male counselor educators, including feeling isolated or unsupported due to fewer numbers of male colleagues, or practices that might emerge in working with students of the opposite gender with the intent of ensuring a sense of safety. Based on discussion and an extensive literature review, the research team created a list of quantitative items surveying demographics, attitudes and practices of male counselor educators. We distributed the survey to a pilot group of six male counselor educators who represented diversity in age, experience, ethnicity and sexual orientation. The pilot participants reviewed each question and commented on its usefulness, acceptability and clarity. Based on pilot feedback, the research team modified the survey to include 22 demographic questions, 32 attitude and practice questions, and four open-ended questions. The survey was formatted for the Survey Research Suite (Qualtrics) and final quantitative data was transferred into SPSS for analysis.
Demographic questions included items regarding personal, family and program characteristics of the faculty members, and questions regarding the faculty members’ professional designations and teaching assignments. Attitude items (Cronbach’s α = .66) consisted of questions related to the impact of being male on both collegial and student relationships. Practice items (Cronbach’s α = .64) consisted of questions related to the participant’s actual practices in relating to students (e.g., private meetings, lunch/dinner, after class). For the full scale, Cronbach’s α was calculated at .70. Four open-ended questions addressed ethical challenges, thoughts related to being male, ways the counselor educator might act differently, and strategies used to avoid complications with students.
Table 1
Demographic Characteristics of Male Counselor Educator Participants
|
Variable
|
N
|
%
|
M
|
SD
|
Mdn
|
Range
|
| Age |
155
|
|
51.61
|
11.08
|
53
|
27–76
|
| Ethnicity |
|
|
|
|
|
|
| African American |
14
|
8.6
|
|
|
|
|
| Asian |
4
|
2.5
|
|
|
|
|
| White, Non-Hispanic |
125
|
76.7
|
|
|
|
|
| White, Hispanic |
11
|
6.7
|
|
|
|
|
| Self-Identified as Other |
8
|
4.9
|
|
|
|
|
| Relationship Status |
|
|
|
|
|
|
| Single |
14
|
8.6
|
|
|
|
|
| Married/Partnered |
142
|
87.1
|
|
|
|
|
| Divorced/Separated |
5
|
3.1
|
|
|
|
|
| Widowed |
1
|
.6
|
|
|
|
|
| Sexual Identity |
|
|
|
|
|
|
| Gay |
13
|
8.0
|
|
|
|
|
| Heterosexual |
145
|
89.0
|
|
|
|
|
| Bisexual |
3
|
1.8
|
|
|
|
|
| Status Regarding Children |
|
|
|
|
|
|
| No Children |
30
|
18.4
|
|
|
|
|
| Adult Children |
74
|
45.4
|
|
|
|
|
| Minor Children in Home |
55
|
33.7
|
|
|
|
|
| Minor Children Part Home |
1
|
.6
|
|
|
|
|
| Minor Children Not in Home |
2
|
1.2
|
|
|
|
|
| Years As Counselor Educator |
161
|
|
15.07
|
10.85
|
12
|
1–45
|
| Faculty Rank |
|
|
|
|
|
|
| Assistant |
38
|
23.3
|
|
|
|
|
| Associate |
50
|
30.7
|
|
|
|
|
| Full |
58
|
35.6
|
|
|
|
|
| Lecturer/Interim |
4
|
2.5
|
|
|
|
|
| Other |
13
|
8.0
|
|
|
|
|
| Total Number of Male Faculty |
156
|
|
4.04
|
1.81
|
4
|
1–10
|
| Total Number of Female Faculty |
155
|
|
4.27
|
2.27
|
4
|
0–13
|
| Estimated % of Male Students |
163
|
|
18.21
|
11.24
|
16
|
0–78
|
| Estimated % of Female Students |
162
|
|
77.66
|
18.55
|
80
|
0–99
|
The first three open-ended questions were used for qualitative analysis and the final question was used to create a list of strategies employed by male counselor educators to aid in their student relationships.
Analysis and Results
The research team used a parallel mixed-methods design (Teddlie & Tashakkori, 2009) to explore the experiences of male counselor educators. We utilized qualitative thematic analysis for data generated from three open-ended questions and optional comments following each quantitative survey question and quantitative statistical analysis for multiple-choice survey questions. By conducting independent quantitative and qualitative analyses in a parallel simultaneous nature, we allowed the separate analyses to inform one another and provide a more integrated understanding of the data (Teddlie & Tashakkori, 2009). Due to overlap in analysis and results consequential from a mixed-methods approach, we chose to present analyses and results categorized by method (qualitative and quantitative) in the following section.
Qualitative Analyses
Responses to the three open-ended questions and optional comments were analyzed from a perspective of transcendental phenomenology to explore the lived experiences of participants (Creswell, 2007; Moustakas, 1994). Within this qualitative tradition, we worked to bracket or set aside our own preconceptions about the phenomenon as much as possible to remain focused on the views of participants (Moerer-Urdahl & Creswell, 2004; Moustakas, 1994). The research team, consisting of two male doctoral students and one female tenured faculty member, discussed our student–teacher relationship experiences regarding gender and power differences. Through reflection and discussion, we developed greater awareness of how our experiences have influenced our views of being and working with male counselor educators. Team discussion allowed us to understand and bracket our positions in the development of data collection and analysis methods.
Because the experiences of male counselor educators have received little attention in literature and research, a phenomenological approach allowed for understanding to emerge from participants’ written reports as data was broken down into smaller units of meaning and reconstructed into broader themes that were clearly defined (Creswell, 2007; Giorgi, 1985). Following data collection, we independently coded responses to three open-ended questions, a smaller portion of the data, to identify initial concepts. Next, we met to review and compare our concepts. Silverman and Marvasti (2008) identified the appropriate use of smaller portions of data to establish preliminary categories. We discussed each unit of meaning in the text that was relevant to the focus of study (Giorgi, 1985), compared each concept to previous statements and discovered an initial list of broader themes suggesting common experiences among participants (Creswell, 2007). The research team clarified category definitions by comparing data units within each category for similarities and differences. Responses to optional comments sections in the survey were reviewed for inclusion in the text. Comments that offered information beyond the scope of the survey question referenced were included in the text for qualitative analysis. Then individual team members independently examined the entire text and coded each unit of meaning under the appropriately perceived category. Finally, we met as a group to develop consensus on final categories and to assign textural excerpts to appropriate themes. As suggested by Potrata (2010), research team members focused on exploring potential differences in coding rather than focusing on consistency when coming to consensus in order to illuminate complexities of the male counselor educator experience. Frequencies were tabulated to represent the magnitude of each category within the sample, and verbatim illustrative quotes were selected to clarify the meaning of each category. Saldaña (2013) suggested that magnitude coding adds supplemental texture to provide richer results in qualitative analysis.
Qualitative Results
In order to address our first research question regarding practices and attitudes of male counselor educators, participants were asked to respond to three open-ended questions to address their experiences and practices as male counselor educators. Seventy-one responses were recorded for the first question, “What ethical challenges, if any, are related to being male in counselor education?” One hundred responses were recorded for the second question, “What are your thoughts related to being male in counselor education?” Ninety-six responses were recorded for the third question, “What are the ways you act differently in student relationships because you are male?” We also coded additional comments of significance that followed each survey item. In all, qualitative analysis included the coding of 359 answers of varying lengths. During qualitative analysis, the research team discovered that participants’ answers appeared to be addressing similar themes across all questions. Hence, all answers were collapsed into one analysis.
The research team identified 10 distinct themes expressed by participants regarding the experiences of being a male counselor educator. We identified “modify behavior” as the most predominant theme, magnified by frequency (32%). This theme included intentional changes in action or interpersonal expression related to being male in professional relationships. Another major theme, “no difference” (frequency 23%) included beliefs and experiences that no unique relationship challenges exist in counselor education related to being male. Expressions of feeling “isolated or lonely” (frequency 11%) described participant experiences of feeling a lack of support as well as awareness of being a minority in the profession. Responses regarding “sexual attraction” (frequency 11%) involved experiences of sexual attraction in professional relationships. A theme of “perception of impropriety” (frequency 10%) included attention to the perception of others regarding appropriate behavior. Expressions of “prejudice or discrimination” (frequency 9.5%) involved experiences of negative beliefs or actions of others related to one’s gender. Additionally, qualitative data revealed themes related to participants’ “awareness” of professional relationships, “awareness of power difference” in relationships, the importance of a “caring or safe environment,” and “ethnicity or orientation” as part of one’s identity as a male counselor educator. A comprehensive presentation of all themes is included in Table 2.
Our second research question regarding specific practices of male counselor educators was addressed through our fourth open-ended survey question, which indicated participants cited over 40 different strategies they used to structure their relationships with students. In general faculty–student interactions, respondents indicated that they did not meet alone with students; only met with students on campus; interacted in groups when others were present; avoided jokes, conversations or language that could be perceived as too friendly; referred to family/significant others in class and conversation; avoided sharing too much personal information; made no physical contact; and avoided being overtly interested in students’ relationship issues. When meeting with students, respondents reported that they kept their doors open, structured meetings with an agenda, met in classrooms, ensured others were around, and avoided engaging in counseling with students. Participants also indicated that they consulted with colleagues regarding student relationships, had colleagues present for potentially problematic student interactions, addressed student relationship issues as soon as they arose, notified department chairs of any concerns and documented interactions. On a personal level, participants reported that they focused on having a balanced personal life, increased self-awareness of interactions, reminded self of boundaries, and engaged in honest and transparent interactions.
Quantitative Analyses
We used results from qualitative analysis to inform decision making regarding variables of interest for quantitative analysis. Due to the extensive data resultant from the 32-question survey of practices and attitudes and need for manuscript brevity, we narrowed survey data results to the survey items that matched qualitative theme results. We chose to explore one survey item per qualitative theme that appeared to closely match the qualitative analysis. Following final coding discussion, the research team identified five attitude and practice questions from the survey that appeared to be related to content evolving from the qualitative analysis. The qualitative theme of modifying behavior appeared most closely linked to the survey item, “I interact differently with female students than male students.” The theme represented by some respondents, that there were no differences related to being male, most closely aligned with the item, “I have unique ethical challenges related to being male in counselor education.” The item linked to the qualitative theme of avoiding the appearance of impropriety, “I structure my individual interaction with students to avoid the appearance of impropriety,” was further explored. The qualitative themes of isolation and discrimination were matched to two items: “I feel isolated in my faculty because I am male,” and “I feel discriminated against by faculty members because I am male.” Although most respondents did not agree with these final two statements, we chose to explore them further due to the distinct voices of some respondents related to ethnicity and sexual orientation within the data.
Table 2
Themes Related to Male Counselor Educators’ Experiences
| Theme |
Definition
|
Freq.
|
Responses
|
Sample Statements
|
| Modify Behavior |
Intentional changes in action or interpersonal expression related to being male |
32%
|
115
|
“. . . crucial to make sure distinct boundaries are established”“. . . have to focus on being appropriately relational”“must balance being supportive with providing clear boundaries” |
| NoDifference |
No unique challenges in counselor education related to being male |
23%
|
82
|
“No specific challenges related to my gender”“Ethics are ethics, male or female”“How I act has little to do with being male” |
| Awareness |
Indicating awareness or self-awareness regarding professional relationships |
13%
|
47
|
“. . . we need to be very aware of situations and interactions with female students”“Know one’s self”“I am now more aware of how I interact” |
| IsolatedorLonely |
Experiencing lack of support and awareness of being a minority in profession |
11%
|
39
|
“I feel a bit like an endangered species”“There are simply some things I can only talk with other men about”“I recognize males are a minority in the field” |
| Sexual Attraction |
Experiences of sexual attraction in professional relationships |
11%
|
38
|
“Dealing with feelings of attraction with students and colleagues”“I am attracted to female students but do not act on it”“I have to refocus my thoughts if I feel an attraction to a student or colleague” |
| Perception of Impropriety |
Attention to the perception of others regarding appropriate behavior |
10%
|
37
|
“. . . don’t want to give the impression of being unethical”“Avoiding any appearance of misconduct”“. . . vigilant in protecting myself from false accusations” |
| Awareness of Power Difference |
Awareness of the impact of privilege and power in relationships |
10%
|
35
|
“Being aware of my male privilege and not abusing it”“I can be male without being dominating”“I do see the same gender politics and gender roles in my profession as I see in society…” |
| PrejudiceorDiscrimination |
Experiences of negative or devaluing beliefs or actions of others related to being male |
9.5%
|
34
|
“tendency to view males as the victimizer”“. . . uniquely male issues that could arise in counseling situations are downplayed”“I sometimes experience sexism against men in the comments of my female colleagues” |
| Caringor Safe Environment |
Intention to provide support and safety to students |
6%
|
21
|
“We want to provide a caring environment”“I want students to feel comfortable around me.”“. . . do not want any female to feel anxious” |
| Ethnicityor Orientation as Part of Identity |
Influences of ethnicity and sexual identity upon male professional experiences |
4%
|
15
|
“Being a male and an ethnic minority is challenging and often lonely”“. . . being Black and male is more of a challenge than being male alone”“I feel isolated not because I am male but because I am a gay male” |
Note: Frequency = Number of participants who shared theme-related statements
Quantitative Results
Descriptive results for the five survey items are presented in Table 3. In order to explore relationships between survey items of interest, we employed Pearson product-moment correlation coefficient analyses on the five variables. There were statistically significant positive correlations between perception of unique ethical challenges and the four other variables: feeling isolated
(r = .290, n = 149, p < .001); interacting differently with female students (r = .317, n = 147, p < .001); structuring interactions to avoid appearance of impropriety (r = .190, n = 148, p = .021); and feeling discriminated against (r = .217, n = 150, p = .008). The more a male counselor educator felt there were unique ethical challenges related to being male, the more likely he was to feel isolated and discriminated against, structure interactions with students to avoid the appearance of impropriety, and interact differently with females than males. Additionally, there was a statistically significant positive correlation between feeling isolated and feeling discriminated against (r = .371, n = 149, p < .001). The more isolated a male counselor educator felt, the more likely he was to feel discriminated.
Table 3
Survey Items Related to Relationships for Male Counselor Educators
|
|
|
|
Percent of Responses
|
|
Survey Item
|
N
|
|
Σ
|
SD
1
|
D
2
|
N
3
|
A
4
|
SA
5
|
| I feel isolated in my faculty because I am male. |
149
|
1.89
|
.94
|
36.8
|
36.8
|
11.7
|
5.5
|
1.2
|
| I interact differently with female students than male students. |
147
|
2.90
|
1.02
|
6.7
|
29.4
|
21.5
|
30.7
|
1.8
|
| I structure my individual interactions with students to avoid the appearance of impropriety. |
148
|
3.76
|
.92
|
1.8
|
9.2
|
13.5
|
50.9
|
15.3
|
| I have unique ethical challenges related to being male in counselor education. |
150
|
2.79
|
1.03
|
9.2
|
30.7
|
23.9
|
26.4
|
1.8
|
| I feel discriminated against by faculty members because I am male. |
150
|
2.05
|
1.06
|
31.9
|
39.9
|
6.1
|
12.3
|
1.8
|
Note: SD=Strongly Disagree, D=Disagree, N=Neutral, A=Agree, SA=Strongly Agree
We further explored ethnicity and sexual orientation in relationship to the dependent variables of isolation and discrimination based on qualitative findings that indicated these characteristics impact the views of male counselor educators. We conducted four separate one-way between-groups analyses of variance to explore the impact of ethnicity and gender on isolation and discrimination. There was a statistically significant difference in ethnicity for isolation, F(4, 144) = 5.78, p < .001, η2 = .14. Means for ethnicity included Asian x̅ = 2.0; African American x̅ = 1.71; White/Non-Hispanic x̅ = 1.84; White/Hispanic x̅ = 1.64; Self-Identified as Other x̅ = 3.43. There was a statistically significant difference in ethnicity for discrimination, F(4, 144) = 5.25, p = .001, η2 = .13. Means for ethnicity included Asian x̅ = 2.0; African American x̅ = 2.23; White/Non-Hispanic x̅ = 1.94; White/Hispanic x̅ = 1.91; Self-Identified as Other x̅ = 3.71. There was a statistically significant difference in sexual orientation for isolation, F(2, 145) = 3.81, p = .024, η2 = .05. Means for sexual orientation included Gay x̅ = 2.58; Heterosexual x̅ = 1.83; Bisexual x̅ = 1.67. There was no statistically significant difference in sexual orientation for discrimination, F(2, 145) = .70, p = .50, η2 = .01.
Discussion
The sample in this study reasonably represents the current population of male counselor educators in CACREP-accredited programs. Although the sample reported equivalent numbers between male and female faculty, they also reported a disproportionate number of female students (78%) to male students (18%), as indicated in previous literature (Schweiger et al., 2012). The sizeable response rate to this survey, as well as its representativeness, lends credibility to findings.
Themes and Characteristics Related to Being a Male in Counselor Education
Qualitative analyses indicated that participants expressed diversity of attitudes and practices regarding the impact of being male upon professional relationships. The most predominant theme, “modify behavior,” indicated that being male influenced choices made by male counselor educators in their interactions with students. Conversely, the second dominant theme, “no difference,” indicated that some counselor educators do not feel that there is any difference in interactions with students or colleagues related to being male. A lack of consensus existed among male counselor educators regarding the influence of being male upon their professional relationships.
When male counselor educators acknowledged there were differences related to being a male in the field, qualitative analysis revealed additional themes related to isolation, discrimination, fear of appearing inappropriate, interacting differently with females than males and need for awareness. We wanted to explore characteristics related to these feelings, which prompted the correlational analyses.
Quantitative and qualitative analyses indicated that the appearance of impropriety was of considerable concern for male counselor educators. A majority of participants agreed or strongly agreed that they structured their interactions to avoid appearance of impropriety. Results revealed a statistically significant positive relationship between expressing a perception of unique ethical challenges for males and structuring interactions to avoid appearance of impropriety. Participants who perceived unique challenges as males also tended to take steps to avoid appearing inappropriate in their professional relationships. This finding supports qualitative themes of male counselor educators’ concerns regarding the appearance of impropriety and fear of the cultural myth of the lecherous professor (Bellas & Gossett, 2001).
Sexual attraction emerged as a relevant issue through qualitative analyses. A vast majority of respondents reported that they had experienced being attracted to a student, with frequency of feelings ranging from rare to a regular occurrence. Also, a majority of the sample reported experiencing a student being attracted to them. These results suggest that sexual attraction was experienced as a common phenomenon in male teacher–student relationships. However, participants often described their feelings of attraction as natural reactions that posed no threat if not acted upon.
When addressing the influence of student gender upon their behavior with students, male counselor educators reported diverse perspectives. Participants were asked if they interacted differently with female students than male students. Responses were about evenly distributed from “disagree” to “agree.” The variance in responses may reflect the larger disagreement among participants regarding the influence of gender upon professional relationships. The qualitative themes of “modify behavior” and “no difference” may provide context for understanding diverse results regarding this question. Correlational analysis revealed that the more a participant perceived unique challenges as a male counselor educator, the more he reported interacting differently with female students compared to male students.
Some participants also reported experiencing isolation related to being a male counselor educator. Qualitative data revealed unique experiences of isolation related to ethnicity and sexual orientation. Although there were a small number of participants who identified as gay, bisexual, African American, Latino, Asian, or other ethnicity, we chose to conduct quantitative analysis to further explore their voices, which were clearly articulated as unique in qualitative analyses. Further quantitative analysis indicated that participants who self-identified as “other” for ethnicity were more likely to feel isolated in comparison with other ethnicities. Likewise, gay male counselor educators also were more likely to feel isolated in the profession. However, gay males did not report higher levels of feeling discriminated against as compared to heterosexual males. Previous research indicates gay males may experience isolation related to not being out to co-workers, often motivated by fear of discrimination (Wright, Colgan, Creegany, & McKearney, 2006). Another possible interpretation could be that gay male counselor educators feel isolated due to interacting with fewer colleagues who are similar to them, but who they experience as accepting or non-discriminatory.
Linked to isolation, we also asked male counselor educators if they had faculty colleagues with whom they could discuss challenges. This point seemed especially salient due to qualitative results indicating male counselor educators rely on consultation as one intervention for dealing with student relationship issues. A majority of respondents agreed or strongly agreed to having a colleague on their faculty with whom they could discuss male-related issues. Qualitative and quantitative analyses identified ethnicity as an important contributor to the experiences of male counselor educators. Qualitative data included a small but consistent voice of African American male counselor educators who expressed increased isolation due to a combination of ethnicity and gender. Quantitative analysis also indicated that participants who identified as African American reported more frequent experiences of discrimination in their professional environment. These findings coincide with research indicating that African American males experience prejudice and discrimination in higher education due to stereotype images of African American males as underachieving, disengaged and threatening (Harper, 2009). Brooks and Steen (2010) discussed concerns related to the lack of African American male counselor educators and the obstacles they face in the academic setting. Participants who self-identified as “other” on ethnicity also showed increased experiences of discrimination as well as isolation. Correlational analysis confirmed the co-occurrence of these two themes, revealing a positive relationship between feeling isolated and feeling discriminated against. Asian males were more likely to feel isolated and structure their interactions to avoid appearances of impropriety, which reflects previous accounts of Asian professors in the literature (Culotta, 1993) in which they experienced isolation from their colleagues and increased student mentoring demands because of their minority status.
In returning to the issue of concern related to practices of male counselor educators in building humanistic and growth-inspiring relationships with students, the results of the current study provide some insight. Many male counselor educators appear to be aware and concerned that being male may influence how they are perceived by students and how they approach their relationships with students. However, results indicate that participants sought methods and strategies that allowed them to pursue relationships while also being sensitive to students’ perceptions of safety. Figure 1 provides specific strategies highlighted by participants that allow male counselor educators to engage in student–teacher relationships that recognize the power differential between student and teacher, inherent challenges with sexual attraction, and yet still allow the student and teacher to benefit from an accepting, inspiring relationship that mirrors the therapeutic relationship.
Limitations
The survey method used for this study was selected for exploratory purposes and did not involve the use of a rigorous assessment designed to interpret results through reliability and validity procedures; hence, results must be interpreted with caution. Additionally, the survey sample may not represent the views of the entire population of male counselor educators.
Figure 1.
Strategies Used by Male Counselor Educators to Build Student Relationships.
Note: General Interactions = strategies used in everyday interactions; Student Meetings = strategies used when having to meet with students individually; Interventions = strategies used when complications arise.
Due to the extensiveness of collected data, we were unable to report all findings related to the uniqueness of the sample. Respondents reported rich qualitative narratives and variations in their attitudes and practices. The variations are not fully represented in this report. The use of a one-time open-ended questionnaire precluded use of qualitative interviews that would reveal further depth of themes. Additionally, minority groups, such as specific ethnicities and those who identified as gay and bisexual, appeared to have a distinct voice in this survey. However, due to low representation, data analysis was limited in representing their experiences. We attempted to rectify this limitation by voicing those narratives in the qualitative analysis.
Implications
The purpose of this research was to reveal attitudes and practices of male counselor educators, allowing the reader an understanding of how the experience of being male influences the daily choices of male counselor educators. Implications of this research study include better understanding of the experiences of counselor educators that lead to enhanced job satisfaction for males, best practices to improve faculty–student relationships and possible areas for further investigation. Additionally, in Figure 1, we provide a list of behaviors used by male counselor educators to ensure appropriate student–teacher boundaries. This list offers male counselor educators possible strategies to address perceptions of impropriety or misconduct.
If male counselor educators experience greater job satisfaction, then more males may choose the counseling field, as they observe possible role models with whom they identify. Substantial variables identified by this study that might influence job satisfaction are feelings of isolation, discrimination, fear of appearing inappropriate and hypervigilance to behavioral interactions with students. Qualitative data revealed a desire by male counselor educators to offer a safe, caring environment, qualified by some respondents as an authentic relationship. Findings indicate that if male counselor educators feel limited by personal loneliness or concern for appearances, this will most likely interfere with their student and faculty relationships. Consultation with and support of colleagues appeared to be a process regularly utilized by many of the male counselor educators in this study. Counselor education departments would benefit from engaging in practices that promote collegiality and support among faculty members as well as formalizing mentoring processes.
Male counselor educators revealed that they take measures to modify their behaviors with students, especially female students. Our results indicate that fear of impropriety, awareness of cultural power differentials, desire to create safe relationships with students and realistic awareness of potential sexual attraction prompt male counselor educators to engage in behaviors that will provide safety for students and for themselves. These strategies reveal concrete behavioral actions taken to ensure the maintenance of boundaries with students. Kolbert, Morgan, and Brendel (2002) concluded that faculty must consider student perceptions of a relationship as the primary criterion in making decisions regarding their interactions with students. This conclusion requires considerable awareness from male counselor educators related to how they present themselves and how students perceive them. One common strategy used by male counselor educators and commonly supported in the literature (Ei & Bowen, 2002) is engaging in group activities, as opposed to one-on-one activities, in order to establish authentic relationships in a safe environment.
The most cited strategy among this sample was not being alone or out of sight from others when engaging in personal interactions with students. In a field where confidentiality is the base of intervention, this particular strategy seems incongruous, especially for professionals who value relationship in teacher–student interactions. Additionally, students may question a faculty member’s authenticity if intimacy is avoided in the relationship. However, contextual, legal and cultural considerations appear to encourage these types of restraints. Counselor education departments may benefit from discussion of these issues of behavior, relationship, philosophy and safety in an open forum among faculty and with students.
The relational experiences of male counselor educators have gone virtually unexamined in literature and research, leaving many opportunities for further inquiry. Some participants indicated that ethnicity influenced their experiences and relationships, yet sample size prevented meaningful exploration. Further research may investigate the unique experiences of African American, Latino and Asian male counselor educators. Likewise, sexual orientation emerged as a major influence for some participants. An exploration of experiences of gay male counselor educators is needed to enhance understanding of their relational experiences and the influence of gender.
Participants expressed concerns about perceptions of impropriety with students, feelings of isolation within the profession, and experiences of prejudice and discrimination in their work environments. These elements require further exploration to better understand the nature of these experiences and investigate causal factors to heighten sensitivity and identify appropriate measures for creating a safe environment for faculty and students. Participants also indicated that they alter behavior in student relationships to avoid the appearance of impropriety and maintain professional boundaries. Further research could explore the implications of those decisions for the quality of relationships with students. A study of student perspectives would greatly enhance understanding of these relational dynamics. Additionally, a study of ways in which female counselor educators approach their relationships with students, in regard to feeling restricted or limited in intimacy, is warranted.
This study provides an enhanced understanding of male counselor educators’ perceptions and experiences of their relationships with students and colleagues. Male counselor educators shared a unique voice of experience. Further research may expand understanding of male counselor educator experiences, provide insights to improve the quality of faculty–student relationships and assist in developing male role models for the future of our profession.
Conflict of Interest and Funding Disclosure
The authors reported no conflict of interest
or funding contributions for the development
of this manuscript.
References
American Counseling Association. (2014). 2014 American Counseling Association Code of Ethics. Retrieved from http://www.counseling.org/docs/ethics/2014-aca-code-of-ethics.pdf?sfvrsn=4
Anderson, J. A., & Rawlins, M. (1985). Availability and representation of women in counselor education with strategies for recruitment, selection, and advancement. Counselor Education and Supervision, 25, 56–65. doi:10.1002/j.1556-6978.1985.tb00512.x
Bartlett, T. (2002, April 5). The question of sex between professors and students. The Chronicle of Higher Education. Retrieved from http://chronicle.com/article/The-Question-of-Sex-Between/33174
Bellas, M. L., & Gossett, J. L. (2001). Love or the “lecherous professor”: Consensual sexual relationships between professors and students. The Sociological Quarterly, 42, 529–558. doi:10.1111/j.1533-8525.2001.tb01779.x
Bowman, V. E., Hatley, L. D., & Bowman, R. L. (1995). Faculty-student relationships: The dual
role controversy. Counselor Education and Supervision, 34, 232–242. doi:10.1002/j.1556-6978.1995.tb00245.x
Brooks, M., & Steen, S. (2010). “Brother where art thou?” African American male instructors’ perceptions of the counselor education profession. Journal of Multicultural Counseling and Development, 38, 142–153. doi:10.1002/j.2161-1912.2010.tb00122.x
Creswell, J. W. (2007). Qualitative inquiry & research design: Choosing among five approaches. Thousand
Oaks, CA: Sage.
Crothers, L. M., Hughes, T. L., Schmitt, A. J., Theodore, L. A., Lipinski, J., Bloomquist, A. J., & Altman, C. L. (2010). Has equity been achieved? Salary and promotion negotiation practices of a national sample of school psychology university faculty. The Psychologist-Manager Journal, 13, 40–59. doi:10.1080/10887150903553790
Culotta, E. (1993). Finding—and keeping—minority professors. Science, 262, 1091–1096.
doi:10.1126/science.262.5136.1091
Dollarhide, C. T., & Granello, D. H. (2012). Humanistic perspectives on counselor education and
supervision. In M. B. Scholl, A. S. McGowan, & J. T. Hansen (Eds.), Humanistic perspectives on contemporary counseling issues (pp. 277–303). New York, NY: Routledge.
Ei, S., & Bowen, A. (2002). College students’ perceptions of student-instructor relationships. Ethics & Behavior, 12, 177–190. doi:10.1207/S15327019EB1202_5
Giorgi, A. (1985). Sketch of a psychological phenomenological method. In A. Giorgi (Ed.),
Phenomenology and psychological research. Pittsburgh, PA: Duquesne University Press.
Harper, S. R. (2009). Niggers no more: A critical race counternarrative on black male student
achievement at predominately white colleges and universities. International Journal of Qualitative Studies in Education, 22, 697–712. doi:10.1080/09518390903333889
Healey, A. C., & Hays, D. G. (2012). A discriminant analysis of gender and counselor
professional identity development. Journal of Counseling & Development, 90, 55–62. doi:10.1111/j.1556-6676.2012.00008.x
Kiley, K. (2011, August 30). Relationship problems. Inside Higher Education. Retrieved from
https://www.insidehighered.com/news/2011/08/30/idaho_student_s_death_and_ties_to_former_
professor_highlights_difficulty_of_preventing_faculty_student_relationships
Kolbert, J. B., Morgan, B., & Brendel, J. M. (2002). Faculty and student perceptions of dual relationships within counselor education: A qualitative analysis. Counselor Education and Supervision, 41, 193–206. doi:10.1002/j.1556-6978.2002.tb01283.x
Kress, V. E., & Dixon, A. (2007). Consensual faculty–student sexual relationships in counselor
education: Recommendations for counselor educators’ decision making. Counselor Education and Supervision, 47, 110–122. doi:10.1002/j.1556-6978.2007.tb00042.x
McAuliffe, G. J. (2011). Guidelines for constructivist-developmental counselor education. In G. J. McAuliffe & K. P. Eriksen (Eds.), Handbook of counselor preparation: Constructivist, developmental,
and experiential approaches (pp. 31–48). Thousand Oaks, CA: Sage.
Moerer-Urdahl, T., & Creswell, J. W. (2004). Using transcendental phenomenology to explore the “ripple effect” in a leadership mentoring program. International Journal of Qualitative Methods, 3, 1–28.
Moustakas, C. (1994). Phenomenological research methods. Thousand Oaks, CA: Sage.
Nicks, S. D. (1996). Fear in academia: Concern over unmerited accusations of sexual harassment. The Journal of Psychology, 130, 79–82. doi:10.1080/00223980.1996.9914990
Oldenburg, C. M. (2005). Students’ perceptions of ethical dilemmas involving professors: Examining the impact of the professor’s gender. College Student Journal, 39, 129–140.
Owen, P. R., & Zwahr-Castro, J. (2007). Boundary issues in academia: Student perceptions of faculty–student boundary crossings. Ethics & Behavior, 17, 117–129. doi:10.1080/10508420701378065
Potrata, B. (2010). Rethinking the ethical boundaries of a grounded theory approach. Research Ethics, 6, 154–158. doi:10.1177/174701611000600408
Saldaña, J. (2013). The coding manual for qualitative researchers (2nd ed.). Thousand Oaks, CA:
Sage.
Schweiger, W. K., Henderson, D. A., McCaskill, K., Clawson, T. W., & Collins, D. R. (2012).
Counselor preparation: Programs, faculty, trends (13th ed.). New York, NY: Routledge.
Silverman, D., & Marvasti, A. (2008). Doing qualitative research: A comprehensive guide. Thousand Oaks, CA: Sage.
Teddlie, C. B., & Tashakkori, A. M. (2009). Foundations of mixed methods research: Integrating
quantitative and qualitative approaches in the social and behavioral sciences. Thousand Oaks, CA: Sage.
Wright, W., Colgan, F., Creegany, C., & McKearney, A. (2006). Lesbian, gay and bisexual workers: Equality, diversity and inclusion in the workplace. Equal Opportunities International, 25, 465–470. doi:10.1108/02610150610713782
Dee C. Ray, NCC, is a Professor at the University of North Texas. David D. Huffman is an Adjunct Professor at the University of North Texas. David. D. Christian is an Assistant Professor at the University of Arkansas. Brittany J. Wilson, NCC, is Assistant Director, Child and Family Resource Clinic, University of North Texas. Correspondence can be addressed to Dee C. Ray, University of North Texas, 1155 Union Circle, Box 310829, Denton, TX 76203, dee.ray@unt.edu.
Jul 20, 2016 | Article, Volume 6 - Issue 2
John M. Laux, Robin M. DuFresne, Allison K. Arnekrans, Sylvia Lindinger-Sternart, Christopher P. Roseman, Amy Wertenberger, Stephanie Calmes, Darren W. Love, Andrew M. Burck, Jim Schultz
The Substance Abuse Subtle Screening Inventory-3 (SASSI-3; Miller & Lazowski, 1999) is a substance use screen that uses logically derived, or obvious questions, as well as subtle, or empirically derived questions. The SASSI-3 can be completed, scored and interpreted in 15 minutes. Side one consists of 67 true–false items selected for their ability to statistically differentiate between a criterion group of persons with substance dependence and a control group of non-substance dependent persons. The 67 empirically derived items are used in an effort to defeat dissimulation and are similar in nature and purpose to items found on the MacAndrew Alcoholism Scale-Revised (MAC-R; MacAndrew, 1965). As such, these empirically derived items are useful with individuals who are either intentionally or unintentionally denying a substance use disorder (Laux, Piazza, Salyers, & Roseman, 2012). These comprise the Symptoms scale (SYM), which assesses the symptoms and consequences of drug and alcohol use; the Obvious Attributes scale (OAT), a measure of the obvious symptoms of substance dependence; the Subtle Attributes scale (SAT), an indirect measure of substance use that employs items with non-substance-related content; the Defensiveness scale (DEF), which measures denial or minimization; the Supplemental Addiction Measure scale (SAM), which discriminates general defensiveness from defensiveness related to substance use; the Family Versus Control Subjects scale (FAM), which identifies those who are likely to focus on the thoughts and feelings of others to their own neglect; the Correctional scale (COR), used to detect response patterns similar to those produced by persons with a history of criminal behaviors; and the Random Answering Pattern scale (RAP), designed to identify haphazard answering. Side one also includes questions about respondents’ marital status, employment status, education, ethnicity and income.
Side Two consists of 12 items specific to alcohol use and 14 items regarding use of other substances. Response options to these 26 items are never, once or twice, several times, and repeatedly. These 26 items comprise the Face Valid Alcohol (FVA) and Face Valid Other Drugs (FVOD) scales and are similar to items found on the Michigan Alcoholism Screening Test (MAST; Selzer, 1971) and the CAGE (Ewing, 1984). The SASSI-3 is interpreted using nine decision rules. The first five decision rules are based solely on the unique contributions of individual scales. The remaining four decision rules involve a combination of two or more scales. A decision rule is coded “yes” if the associated SASSI-3 scale or scales’ raw score is equal to or greater than the decision rule’s cut score. Otherwise, the decision rule is coded as “no.” The respondent is determined to have a “high probability of having a substance dependence disorder” if any of the decision rules are met (Miller & Lazowski, 1999, p. 10).
Not only does the SASSI-3 do a better job of identifying alcohol use disorders than the MAST, CAGE and MAC-R (Laux, Perera-Diltz, Smirnoff, & Salyers, 2005; Laux, Salyers, & Kotova, 2005), it provides the added benefit of screening for drug use other than alcohol. The most recent inquiry into substance use screens indicated that the SASSI-3 is the substance use screen most frequently used by Master Addictions Counselors certified by the National Board for Certified Counselors (Juhnke, Vacc, Curtis, Coll, & Paredes, 2003).
The SASSI-3 Manual (Miller & Lazowski, 1999) reported a sensitivity (true positive) rate of 94.6% and specificity (true negative) rate of 93.2%. Subsequent field research produced results consistent with the psychometric claims made in the SASSI-3 Manual (Burck, Laux, Harper, & Ritchie, 2010; Burck, Laux, Ritchie, & Baker, 2008; Calmes et al., 2013; Hill, Stone, & Laux, 2013; Laux, Perera-Diltz, Smirnoff, & Salyers, 2005; Laux, Salyers, & Bandfield, 2007; Laux, Salyers, & Kotova, 2005; Wright, Piazza, & Laux, 2008). Further, Laux et al. (2012) demonstrated that the SASSI-3’s empirical items and associated decision rules increased the instrument’s screening accuracy. In addition, persons’ willingness and ability to self-report having a substance use disorder as described in the Diagnostic and Statistical Manual of Mental Disorders, Fourth Edition, Text Revision (DSM-IV-TR; American Psychiatric Association [APA], 2000) did not negatively affect the instrument’s sensitivity. Laux et al. (2012) found that the SASSI-3 produced high sensitivity rates across varying levels of motivation to change among persons who lost parental rights due to substance use.
APA published the fifth edition of the Diagnostic and Statistical Manual of Mental Disorders (DSM-5) in 2013. This most current version of the DSM brought forward major and important changes to the way the substance use disorder (SUD) chapter is conceptualized (Dailey, Gill, Karl, & Barrio Minton, 2014). Notably, the former dichotomous substance abuse and substance dependence categories have been removed and replaced with a continuum under the heading of “Substance Use Disorders” (APA, 2013, p. 483). The criterion formerly associated with the substance abuse and substance dependence disorders have been merged onto one continuum, to which craving has been added. Clients are determined to have a mild SUD if two or three criteria are met, a moderate SUD when four to five symptoms are met, and a severe SUD when six or more symptoms are endorsed.
Because previous versions of the DSM criteria were frequently used as the gold standard against which SUD screens were compared (Ashman, Schwartz, Cantor, Hibbard, & Gordon, 2004; Lazowski, Miller, Boye, & Miller, 1998), it is of interest to investigate the degree to which the SASSI-3 accurately predicts the new DSM-5 substance use diagnostic criteria. Our literature review produced two examples of empirical comparison between the SASSI-3, or its predecessors, and DSM criteria. The first (Lazowski et al., 1998) reported on the standardization efforts that produced the instrument’s third version. This research team used the data from persons whose case files had a DSM-III-R (APA, 1987) or a DSM-IV (APA, 1994) substance use diagnosis and an administration of the SASSI-3. How the participants were diagnosed was not specified. The results of this investigation found that the SASSI-3’s overall accuracy rating was 97%, the sensitivity rating was 97% and the specificity rating was 95%. A second study (Ashman et al., 2004) sought to determine the SASSI-3’s ability to screen for substance abuse among persons with traumatic brain injury. Ashman et al. (2004) used the Structured Clinical Interview for DSM-IV (First, Spitzer, Gibbon, & Williams, 1996) as the criterion variable against which the SASSI’s results were compared. These authors concluded that while the SASSI’s overall decision and FVA scale yielded “modest accuracy, sensitivity, and specificity rates” (p. 198), the FVOD scale had high sensitivity (95%) but only moderate accuracy (83%) and specificity (82%) among persons with traumatic brain injury.
The purpose of this study was to extend this line of research and examine the SASSI-3’s ability to accurately assess the presence of an SUD using DSM-5 criteria. Specifically, the authors calculated kappa statistics to estimate the degree of agreement between the SASSI-3’s overall decision rules, its individual decision rules and counselors’ DSM-5 SUD diagnoses. This analysis is important because these decision rules directly affect the SASSI-3’s final SUD classification (i.e., high probability of substance dependence disorder/low probability). Further, we examined the SASSI-3’s specificity and sensitivity using receiver operating characteristics (ROC) curves. We hypothesized that we would find good agreement between the overall SASSI-3 score and the DSM-5 SUD diagnosis. We further expected to find good agreement between the SASSI-3 face valid scales and the DSM-5 SUD diagnosis. We expected to find a moderate to low agreement between the SASSI-3 subtle scales and the DSM-5 SUD diagnosis. Additionally, we hypothesized that the ROC analysis would provide optimal cut-off scores for each of the SASSI-3 subscales that would improve those scales’ sensitivity and specificity. Study participants were selected from an inpatient SUD treatment center, an urban university, and a community mental health center that provides court-ordered outpatient treatment for clients with substance use issues. These populations were selected in order to match the populations on which the SASSI-3 was standardized (Miller & Lazowski, 1999).
Method
Participants
This study included participants (N = 241) recruited between October 2013 and May 2014. There were 114 females (47.3%) and 127 males (52.7%). The participants’ average age was 33.63 (SD = 6.83, range = 19–47). One hundred thirty-one (54.4%) were European American, 52 (21.6%) were African American, 7 (2.9%) were Hispanic, 12 (5.0%) were biracial, and 4 (1.7%) were Asian American. Thirty-five (14.5%) provided no ethnic background information. The average number of years of education completed was 12.48 (SD = 1.79, range = 7–18). Thirty-two (13.3%) were married, 156 (64.7%) were never married, 27 (11.2%) were divorced, 16 (6.6%) were separated, 4 (1.7%) were widowed, and 6 (2.5%) did not indicate a marital status. Thirty-three (13.7%) participants listed their employment as full-time, 22 (9.1%) as part-time, 91 (37.8%) as not employed, 65 (27.0%) as student, 9 (3.7%) as home maker, 13 (5.4%) were disabled, 2 (.8%) listed retired, and 6 (2.5%) listed no employment status. The sample features fewer employed, and more unemployed and student participants than the SASSI-3 normative sample (Miller & Lazowski, 1999).
Participants were recruited from three sites in Ohio. A total of 117 (48.5% of the total sample) participants were recruited from an adults-only comprehensive community mental health substance abuse treatment center. Another 61 subjects (25.3% of the total) were recruited from a private, non-profit organization specializing in court-ordered outpatient mental health treatment. Finally, 63 students (26.1% of the sample) enrolled at a large, public, urban university in Ohio were recruited to provide a sample of individuals who were less likely to be substance users. A one-way ANOVA [F(2, 233) = 24.28, p = .000, η2 = .172] showed that the college students’ mean age (M = 23.86, SD = 9.04) was significantly lower than the inpatient substance abuse clients’ (M = 35.80, SD = 11.36) and the outpatient clients’ (M = 32.80, SD = 10.88).
Procedure and Materials
The procedures involved here were approved by the sponsoring institution’s Institutional Review Board and the data collection sites, and were consistent with the American Counseling Association’s Code of Ethics (2014). Three licensed counselors who had completed two graduate courses in testing and assessment conducted standardized interviewing and administered SASSI-3s. All three counselors completed training in SUD interviewing and SASSI-3 administration and scoring prior to the study’s beginning. All persons receiving treatment at sites 1 and 2 were asked to participate. A total of 117 of the 118 (99.2%) persons at site 1 and 61 of the 64 (95.3%) persons at site 2 agreed to participate. Sixty-three of 79 students (79.8%) enrolled in one of three separate undergraduate counseling courses agreed to participate.
Each participant met individually with a researcher who used the structured SUD questionnaire to conduct an interview and administered the SASSI-3. The SASSI-3s were scored and interpreted by a fourth researcher who had no knowledge of the interviewing researchers’ diagnostic impressions. For quality control purposes, the senior author reviewed the SASSI-3 scoring and questionnaire results.
Instruments
Structured Substance Use Disorder Questionnaire. At present, no structured guide or screen exists that was developed and normed using the current DSM-5 SUD criteria. To ensure that the counselors were uniform in their substance use interviews and that their interviews were consistent with the DSM-5 criteria, we designed a 22-item questionnaire to determine whether participants would meet criteria for a DSM-5 SUD. This questionnaire was based on the 11 criteria for an SUD from the DSM-5 (APA, 2013). These items were yes/no questions corresponding to the criteria for an SUD and were divided into two sections. The first 11 items applied to alcohol use and the second 11 items applied to the use of other drugs. Consistent with the DSM-5’s SUD section, participants who responded “yes” to two or more items in either section met criteria for a DSM-5 substance use disorder.
Endorsement of two items in the first section indicated the participant met criteria for an SUD involving alcohol use; endorsement of two items in the second section indicated the participant met criteria for an SUD involving other drugs. Severity of the SUD was based on decision rules provided in the DSM-5: 2–3 symptoms indicated a mild SUD, 4–5 symptoms indicated a moderate SUD, and 6 or more symptoms indicated a severe SUD (APA, 2013). Counselors clarified the meaning of items as needed. No distinction was made between different types of drug use (marijuana, cocaine, etc.) because the SASSI-3 does not do so. The internal consistency estimates for the alcohol and other drug use sections were high ( = .94 and = .97, respectively).
Data Analysis
The authors used two methods of statistical analysis. Cohen’s kappa was used to measure the agreement between the two dichotomous DSM-5 SUD diagnosis variables (i.e., met criteria or not) and the overall score on the SASSI-3 (high probability of substance dependence disorder/low probability). Cohen’s kappa also was used to compare the DSM-5 diagnosis of either an SUD involving alcohol or one involving other drug use to the score on the SASSI-3 subscale 1 (FVA) or subscale 2 (FVOD), respectively. It was then used to measure agreement between the DSM-5 SUD diagnosis and the scores on subscales 3–9 on the SASSI-3. The value of the kappa is between 0 and 1 and is divided into 5 levels of agreement: .01 to .20 signifies slight agreement; .21 to .40 fair; .41 to .60 moderate; .61 to .80 substantial; and .81 to .99 near perfect agreement (Landis & Koch, 1977).
Unlike the kappa, ROC curve analysis is used with continuous variables. ROC analysis allows one to measure a trade-off between specificity (true positives) and sensitivity (true negatives; Youngstrom, 2014). ROC allows the investigator to determine how specificity and sensitivity change when the cut-off value of the continuous variable is changed. ROC value is expressed as an area under the ROC curve (AUROC). ROC curves are graphically represented as the relationship between an instrument’s specificity (horizontal axis) and sensitivity (vertical axis). ROC curves are interpreted by finding the point on the graph where a scale’s sensitivity and specificity are balanced. To the naked eye, this optimal point is where the curve begins to flatten out at the top. ROC analyses are performed on individual scales, but not multiple scales. As such, ROC analyses can only be performed on those SASSI-3 decision rules that involve individual scales (decision rules 1–5). Decision rules 6–9 involve input from two or more SASSI-3 scales and are therefore not subject to ROC analysis. The ROC scores are categorized as follows: ≥ .90, excellent; ≥ .80, good; ≥ .70, fair; and < .70, poor (Youngstrom, 2014).
Results
A review of the participants’ random answering profile (RAP) scores indicated that all profiles were valid. Of the 241 participants, the SASSI-3 classified 153 (63.5%) as having a high probability of having a substance dependence disorder. Raw SASSI-3 scale scores were converted to t scores using the SASSI-3 Manual’s Appendix C (Miller & Lazowski, 1999).
Table 1
SASSI-3 Scale Descriptive Data and Internal Consistency Estimates
|
SASSI-3 Scale
|
Mean t score
|
Standard Deviation
|
Range
|
Alpha
|
|
|
|
|
|
|
FVA
|
55.67
|
15.86
|
41-110
|
0.93
|
|
|
|
|
|
|
FVOD
|
70.58
|
25
|
5-116
|
0.97
|
|
|
|
|
|
|
SYM
|
63.58
|
14.68
|
36-92
|
0.81
|
|
|
|
|
|
|
OAT
|
60.23
|
12.25
|
35-85
|
0.74
|
|
|
|
|
|
|
SAT
|
58.35
|
14.78
|
24-99
|
0.52
|
|
|
|
|
|
|
DEF
|
45.33
|
10.81
|
24-73
|
0.53
|
|
|
|
|
|
|
SAM
|
62.76
|
12.09
|
30-94
|
0.63
|
|
|
|
|
|
|
FAM
|
44.1
|
12.18
|
4-76
|
0.24
|
|
|
|
|
|
|
COR
|
61.21
|
13.74
|
36-88
|
0.63
|
Note. FVA = Face Valid Alcohol scale; FVOD = Face Valid Other Drugs scale; SYM = Symptoms scale; OAT = Obvious Attributes scale; SAT = Subtle Attributes scale; DEF = Defensiveness scale; SAM = Supplemental Addiction Measure scale; FAM = Family versus Control Subjects scale; COR = Correctional scale.
Table 1 represents each SASSI-3 scale’s mean, standard deviation, range of scores and Cronbach’s alpha. These internal consistency reliability estimates were comparable with previously reported alphas (Burck, Laux, Harper, & Ritchie, 2010; Burck et al., 2008). The counselor’s interviews indicated that 188 (78.0%) of the participants met SUD criteria as specified in the DSM-5. Of these 188, 25 (13.3%) had a mild SUD, 13 (6.9%) were moderate, and 127 (67.6%) had a severe SUD. Of the 188 participants diagnosed with an SUD, 85 participants (45.2%) had an alcohol use disorder. Of these 85, 33 (38.8%) had a mild alcohol SUD, 13 (15.3%) were moderate, and 39 (45.9%) were severe. One hundred thirty-three participants (55.2%) were positive for an SUD other than alcohol. Of these 133, 10 (7.5%) had a mild disorder, 8 (6.0%) were moderate, and 115 (86.5%) were severe.
Cohen’s kappa (κ) statistic was calculated to determine the agreement between the DSM-5 diagnosis (i.e., met criteria or not) and the SASSI-3 overall score and each of the SASSI-3’s decision rules. Table 2 presents the results of these analyses as well as the number of SASSI-3 true positive, true negative, false positive and false negative classifications. The overall SASSI-3’s agreement with the counselors’ diagnostic decisions was fair (κ = .423, p = .060). The SASSI-3 results concurred with counselors’ diagnostic interviews on 182 cases and disagreed on 59 cases. The SASSI-3’s sensitivity (true positives) and specificity (true negatives) rates were .75 and .77, respectively.
Table 2
Agreement Between Counselors’ Diagnoses and SASSI-3 Individual and Total Decision Rules
|
Rule
|
True Positive
|
True Negative
|
False Positive
|
False Negative
|
Kappa
|
|
|
|
|
|
|
|
11
|
31 (12.9%)
|
151 (62.7%)
|
5 (2.1%)
|
54 (22.4%)
|
0.383***
|
|
|
|
|
|
|
|
22
|
105 (43.6%)
|
105 (43.6%)
|
3 (1.2%)
|
28 (11.6%)
|
0.745*****
|
|
|
|
|
|
|
|
3
|
91 (37.8%)
|
47 (19.5%)
|
6 (2.5%)
|
97 (40.2%)
|
0.229***
|
|
|
|
|
|
|
|
4
|
32 (13.3%)
|
53 (22.0%)
|
0 (0%)
|
156 (64.7%)
|
0.083**
|
|
|
|
|
|
|
|
5
|
38 (15.8%)
|
53 (22.0%)
|
0 (0%)
|
150 (62.2%)
|
0.100**
|
|
|
|
|
|
|
|
6
|
62 (25.7%)
|
50 (20.7%)
|
3 (1.2%)
|
126 (52.3%)
|
0.149**
|
|
|
|
|
|
|
|
7
|
107 (44.4%)
|
48 (19.9%)
|
5 (2.1%)
|
81 (34.0%)
|
0.313***
|
|
|
|
|
|
|
|
8
|
4 (1.7%)
|
52 (21.6%)
|
1 (0.4%)
|
184 (76.3%)
|
0.001*
|
|
|
|
|
|
|
|
9
|
59 (24.5%)
|
46 (19.1%)
|
7 (2.9%)
|
129 (53.5%)
|
0.100**
|
|
|
|
|
|
|
|
SASSI-3
|
141 (58.5%)
|
41 (17.0%)
|
12 (5.0%)
|
47 (19.5%)
|
0.423****
|
Note. 1 = Rule 1 kappa tested against positive for alcohol use disorder only. 2 = Rule 2 kappa tested against all substance use disorders but alcohol use. All other kappa values are calculated for each Decision Rule’s agreement a clinical diagnosis of any substance use disorder. * = less than chance agreement, ** = slight agreement, *** = fair agreement, **** = moderate agreement and ***** = substantial agreement (Landis & Koch, 1977).
A closer examination of the kappa data indicates that the SASSI-3 and its subscales’ areas of weakness were the false negative rates. That is, the SASSI-3 failed to identify persons as likely substance dependent that the counselors judged as substance dependent (i.e., met criteria or not). Based on the kappa data, the SASSI-3 overall score incorrectly categorized 47 (19.5%) of the sample as not in need of further SUD assessment. This suggests that the decision rules’ cut scores may be too high for this sample. To test this hypothesis, the researchers investigated the SASSI-3’s FVA, FVOD, SYM, OAT and SAT scales’ specificity and sensitivity using ROC analyses (Youngstrom, 2014).
The ROC analysis of the FVA scale produced an AUROC value of .861, p = .000, standard error = .026, with a 95% confidence interval range of .811 to .912. This indicates that there is a good agreement between the FVA scale and the counselors’ alcohol use disorder diagnoses (Youngstrom, 2014). A review of the coordinates of the curve (Figure 1) demonstrates that an adjusted FVA t score cut-off of 53.5 would provide the optimal balance between sensitivity (.79) and specificity (.80). A t score of 53.5 translates into an FVA raw score of approximately 6 for both sexes. Rule 1 was recalculated using a raw score of 6 for both sexes and a kappa statistic was calculated to determine the agreement rate between this new FVA cut score and the counselors’ alcohol use disorder diagnoses. The new kappa statistic was .551, p = .000. The new Rule 1 sensitivity and specificity rates were, respectively, .81 and .77. Rule 1’s false positive rate was .19 and the false negative rate was .23. Lowering the Rule 1 cut score to 6 improved the kappa statistic by .168.
Figure 1.
ROC Curve for FVA t Score Plotted Against Counselor Alcohol Use Disorder Diagnosis
Note. Diagonal segments are produced by ties.
The ROC analysis of the FVOD scale produced an AUROC value of .965, p = .000, standard error = .013, with a 95% confidence interval range of .940 to .990. This indicates that there is an excellent agreement between the FVOD scale and the counselors’ SUD other than alcohol dependence diagnoses (Youngstrom, 2014). A review of the coordinates of the curve (Figure 2) argued against making any adjustments to the current FVOD score cut-offs for Rule 2.
Figure 2.
ROC Curve for FVOD t Score Plotted Against Counselor SUD Diagnosis
Note. Diagonal segments are produced by ties.
The ROC analysis of the SYM scale produced an AUROC value of .803, p = .000, standard error = .035, with a 95% confidence interval range of .735 to .871. This indicates that there is a good agreement between the SYM scale and the counselors’ SUD diagnoses (Youngstrom, 2014). A review of the coordinates of the curve (Figure 3) demonstrates that an adjusted SYM t score cut-off of 56.5 would provide the optimal balance between sensitivity (.761) and specificity (.774). A t score of 56.5 translates into an SYM raw score of approximately 5 for males and 4 for females. Rule 3 was recalculated using these new raw scores and a kappa statistic was calculated to determine the agreement rate between this new SYM cut score and the counselors’ overall SUD diagnoses. The kappa statistic was .437, p = .000. The new Rule 3 sensitivity and specificity rates were, respectively, .76 and .77. Rule 3’s false positive rate was .23 and the false negative rate was .24. Lowering the Rule 3 cut score to 6 improved the kappa statistic by .208.
Figure 3.
ROC Curve for SYM, OAT and SAT t Scores Plotted Against Counselor SUD Diagnosis
Note. Diagonal segments are produced by ties.
The ROC analysis of the OAT scale produced an AUROC value of .717, p = .000, standard error = .038, with a 95% confidence interval range of .643 to .791 (Figure 3). This indicates that there is fair agreement between the OAT scale and the counselors’ SUD diagnoses (Youngstrom, 2014). It was not possible to adjust the OAT t score to produce an optimal cut-off score such that a balance between sensitivity and specificity could be obtained. For example, to attain a sensitivity rating of .82, the
t score cut-off would have to be lowered to 48.5, which would produce a specificity rating of .634.
The ROC analysis of the SAT scale produced an AUROC value of .654, p = .001, standard error = .037, with a 95% confidence interval range of .582 to .727 (Figure 3). This indicates that there is poor agreement between the SAT scale and the counselors’ SUD diagnoses (Youngstrom, 2014). As with the OAT scale, no cut-off score could be determined that would provide an optimal balance between sensitivity and specificity.
The SASSI-3’s overall decision was recalculated using the lowered Rule 1 and Rule 3 cut scores. This process resulted in a total of 188 persons being classified as likely dependent on the SASSI-3, or a change in the total number of classifications by 28. A follow-up analysis comparing the SASSI-3 final decision using the adjusted scores for Rules 1 and 3 and the original cut scores for Rules 2 and 4–9 with the counselors’ decisions produced a kappa of .457 (p = .000). This kappa is slightly higher than the kappa produced using unadjusted Rule 1 and 3 cut-offs (κ = .423). The adjusted process identified 161 of the 181 (sensitivity = .89) participants whom the counselors classified as having an SUD. However, this increased sensitivity came at the cost of decreased specificity. The adjusted process identified only 33 (specificity = .55) of those participants whom the counselors determined did not have an SUD. The false positive rate and the false negative rate for this adjusted process were, respectively .45 and .11. In sum, this process increased the number of true positives by 20, decreased the number of true negatives by 8, increased the number of false positives by 8, and decreased the number of false negatives by 20. As one might expect, lowering the cut scores on these two rules increased the instrument’s ability to detect the presence of problems, but did so at the cost of possibly overdiagnosing 8 (3%) additional participants while reducing the false negative classifications by 20 (8.3%).
Discussion
The DSM-5 section on SUDs includes significant changes. Chief among these changes is the movement away from an abuse/dependence dichotomy to an SUD continuum that includes all of the criteria previously unique to abuse and dependence disorders as well as the addition of a craving criterion. The present study examined the SASSI-3’s utility in predicting counselors’ diagnostic classifications using the new DSM-5 SUD criteria. The results provided a mixed picture. The SASSI-3’s agreement with the counselors’ diagnoses was moderate. This finding prompted us to conduct a similar series of kappa analyses for each of the SASSI-3’s decision rules and ROC analyses for the first five SASSI-3 decision rules. The last four decision rules could not be analyzed with the ROC as they are each composed of more than one scale of the SASSI-3. The decision rules’ agreement with the counselors’ diagnoses varied considerably. The kappa values presented in Table 1 are below what would be expected based on previously published agreement statistics using previous versions of the DSM (Miller & Lazowski, 1999). The SASSI-3 and its decision rules’ false negative values suggested that the instrument’s modest agreement with the counselors may have been a consequence of unnecessarily high raw score cut-off points. Consistent with Clements’ (2002) findings related to adjusting cut scores, the ROC score analyses presented mixed results. The ROC analyses provided evidence that lowered FVA and SYM cut scores improved these scales’ respective sensitivity and specificity estimates. The FVOD scale’s current cut score produced high sensitivity and specificity and did not need to be improved. The OAT and SAT cut scores could not be adjusted without unwanted compromises to either scale’s associated decision rules’ sensitivity and specificity. The SASSI-3’s overall decision was recalculated using the lowered Rule 1 and Rule 3 cut scores. This process resulted in an improvement in sensitivity with a slight decrease in specificity. The net result was an improvement in the SASSI-3’s overall agreement with licensed counselors’ SUD determinations. Our FVOD scale’s sensitivity and specificity findings are consistent with those of First et al. (1997) and Lazowski et al. (1998), and suggest that the FVOD scale is useful in predicting DSM-IV-TR and DSM-5 non-alcohol SUDs. Our FVA scale findings are consistent with those of First et al. (1997) but differ from those of Lazowski et al. (1998). There are no other SASSI-3 ROC analyses available for comparison.
These results elicit deliberation about whether SUD counselors would be better served by an SUD screening instrument that over- or under-predicts SUD diagnoses. In the case of a scoring method that produces higher sensitivity but lower specificity, resource allocation might be a concern. A counselor’s diagnostic time might be unnecessarily spent ruling out clients, and clients might be unnecessarily inconvenienced by participating in a full SUD assessment. Alternatively, counselors using a scoring method with lower sensitivity but higher specificity would have fewer clients unnecessarily inconvenienced and spend less time assessing persons who do not need SUD treatment. The unfortunate trade-off is that persons with an SUD who might benefit from assessment and treatment would otherwise be sent home without an appropriate recommendation.
The health, social, psychological and legal implications of misdiagnosing clients with SUDs have been documented (Brown, Suppes, Adinoff, & Thomas, 2001; Horrigan, Piazza, & Weinstein, 1996; McMillan et al., 2008). Therefore, SUD counselors would benefit from a screening instrument with high sensitivity and specificity (Tiet, Finney, & Moos, 2008). When that goal cannot be achieved, SUD counselors and agencies may want to consider which of these two is more important.
Counselors and their agencies might consider their patient population and setting. Among populations likely to have an SUD, specificity might be less important than sensitivity. Conversely, a counselor working at a community mental health agency or college counseling center may benefit from a highly sensitive instrument to identify clients with dual diagnosis treatment needs. In sum, this study represents the first investigation of the SASSI-3’s agreement with the new DSM-5 SUD criteria. Past research (e.g., Laux et al., 2012) has demonstrated that the SASSI-3’s subtle scales improve the instrument’s diagnostic accuracy over that which is obtained using face valid approaches only. As such, we are cautious about drawing strong conclusions about the SASSI-3’s agreement with the DSM-5 criteria until a larger sample of research is available.
Limitations and Suggestions for Future Research
ROC curve analysis allows for the examination of one scale at a time. Consequently, we were unable to use these methods to examine the SASSI-3 decision rules that use more than one scale (Rules 6, 7, 8 and 9). These decision rules include data from the instrument’s subtle and obvious questions and are important contributors to the overall instrument’s sensitivity and specificity. Thus, the inability to examine these decision rules excludes results that may impact the SASSI-3 sensitivity and specificity.
This study collected data from three different locations: a university campus, an inpatient SUD treatment center and an outpatient mental health counseling center. The participants from the college sample were significantly younger, by 9 and 11 years respectively, than those from the other collection sites. Because SUDs are progressive in nature, we recommend that subsequent researchers conduct sample-specific SASSI-3 analyses to determine whether or not population-specific, rather than universal, cut-offs would be useful. Additionally, because there were very few persons in this sample whose use of drugs other than alcohol was categorized as mild, it is not clear whether the FVOD’s lower kappa value was due to the instrument itself or the sample’s homogeneity.
Finally, the DSM-5’s SUD diagnosis is on a continuum and includes severity specifiers (mild, moderate or severe). It may be more diagnostically useful to expand the SASSI-3 to address these specifiers, rather than rely solely on the current dichotomous likely/not likely dependent conclusion. Future researchers are encouraged to determine what decision rule cut scores would be associated with each of the three levels of SUD severity.
Conflict of Interest and Funding Disclosure
The authors reported no conflict of interest
or funding contributions for the development
of this manuscript.
References
American Counseling Association. (2014). 2014 American Counseling Association Code of Ethics. Alexandria, VA: Author.
American Psychiatric Association. (1987). Diagnostic and statistical manual of mental disorders (3rd ed., revised). Washington, DC: Author.
American Psychiatric Association. (1994). Diagnostic and statistical manual of mental disorders (4th ed.). Washington, DC: Author.
American Psychiatric Association. (2000). Diagnostic and statistical manual of mental disorders (4th ed., text rev.). Washington, DC: Author.
American Psychiatric Association. (2013). Diagnostic and statistical manual of mental disorders (5th ed.). Washington, DC: Author.
Ashman, T. A., Schwartz, M. E., Cantor, J. B., Hibbard, M. R., & Gordon, W. A. (2004). Screening for substance abuse in individuals with traumatic brain injury. Brain Injury, 18, 191–202. doi:10.1080/0269905031000149506
Brown, E. S., Suppes, T., Adinoff, B., & Thomas, N. R. (2001). Drug abuse and bipolar disorder: Comorbidity or misdiagnosis? Journal of Affective Disorders, 65, 105–115. doi:10.1016/S0165-0327(00)00169-5
Burck, A. M., Laux, J. M., Harper, H. L., & Ritchie, M. (2010). Detecting faking good and faking bad with the Substance Abuse Subtle Screening Inventory—3 in a college student sample. Journal of College Counseling, 12, 63–72. doi:10.1002/j.2161-1882.2010.tb00048.x
Burck, A. M., Laux, J. M., Ritchie, M., & Baker, D. (2008). An examination of the Substance Abuse Subtle Screening Inventory-3 Correctional scale in a college student population. Journal of Addictions & Offender Counseling, 29, 49–61. doi:10.1002/j.2161-1874.2008.tb00043.x
Calmes, S. M., Laux, J. M., Scott, H., Reynolds, J. L., Roseman, C. P., & Piazza, N. J. (2013). Childhood psychological trauma and its role in first-year college students’ substance dependence. Journal of Addiction and Offender Counseling, 34, 70–80. doi:10.1002/j.2161-1874.2013.00016.x
Clements, R. (2002). Psychometric properties of the Substance Abuse Subtle Screening Inventory-3. Journal of Substance Abuse Treatment, 23, 419–423. doi:10.1016/S0740-5472(02)00279-9
Dailey, S. F., Gill, C. S., Karl, S. L., & Barrio Minton, C. A. (2014). Historical underpinnings, structural alterations, and philosophical changes: Counseling practice implications of the DSM-5. The Professional Counselor, 4, 166–178. doi:10.15241/sfd.4.3.166
Ewing, J. A. (1984). Detecting alcoholism: The CAGE Questionnaire. Journal of the American Medical Association, 252, 1905–1907. doi:10.1001/jama.1984.03350140051025
First, M. B., Spitzer, R. L., Gibbon, M., & Williams, J. B. W. (1996) Structured Clinical Interview for DSM-IV Axis I Disorders, Clinician Version (SCID-CV). Washington, DC: American Psychiatric Press, Inc.
Hill, T., Stone. G., & Laux, J. M. (2013). A psychometric review of the Substance Abuse Subtle Screening Inventory-3: Using Rasch analysis. Journal of Addictions and Offender Counseling, 34, 40–50.
doi:10.1002/j.2161-1874.2013.00013.x
Horrigan, T. J., Piazza, N. J., & Weinstein, L. (1996). The Substance Abuse Subtle Screening Inventory is more cost effective and has better selectivity than urine toxicology for the detection of substance abuse in pregnancy. Journal of Perinatology, 16, 326–330.
Juhnke, G. A., Vacc, N. A., Curtis, R. C., Coll, K. M., & Paredes, D. M (2003). Assessment instruments used by addictions counselors. Journal of Addictions & Offender Counseling, 23, 66–72.
doi:10.1002/j.2161-1874.2003.tb00171.x
Landis, J. R., & Koch, G. G. (1977). The measurement of observer agreement for categorical data.
Biometrics, 33, 159–174.
Laux, J. M., Perera-Diltz, D., Smirnoff, J. B., & Salyers, K. M. (2005). The SASSI-3 Face Valid Other Drugs scale: A psychometric investigation. Journal of Addictions & Offender Counseling, 26, 15–21.
doi:10.1002/j.2161-1874.2005.tb00003.x
Laux, J. M., Piazza, N. J., Salyers, K. M., & Roseman, C. P. (2012). The Substance Abuse Subtle Screening Inventory-3 and stages of change: A screening validity study. Journal of Addictions & Offender Counseling, 33, 82–92. doi:10.1002/j.2161-1874.2012.00006.x
Laux, J. M., Salyers, K. M., & Bandfield, A. (2007). Defensiveness in female college students and its impact on their MAST and CAGE scores. Journal of Addictions and Offender Counseling, 28, 21–30. doi:10.1002/j.2161-1874.2007.tb00029.x
Laux, J. M., Salyers, K. M., & Kotova, E. (2005). A psychometric evaluation of the SASSI-3 in a college sample. Journal of College Counseling, 8, 41–51. doi:10.1002/j.2161-1882.2005.tb00071.x
Lazowski, L. E., Miller, F. G., Boye, M. W., & Miller, G. A. (1998). Efficacy of the Substance Abuse Subtle Screening Inventory-3 (SASSI-3) in identifying substance dependence disorders in clinical settings. Journal of Personality Assessment, 71, 114–128.
MacAndrew, C. (1965). The differentiation of male alcoholic outpatients from nonalcoholic psychiatric outpatients by means of the MMPI. Quarterly Journal of the Study of Alcohol, 26, 238–246.
McMillan, G. P., Timken, D. S., Lapidus, J., C’de Baca, J., Lapham, S. C., & McNeal, M. (2008). Underdiagnosis of comorbid mental illness in repeat DUI offenders mandated to treatment. Journal of Substance Abuse Treatment, 34, 320–325. doi:10.1016/j.jsat.2007.04.012
Miller, F. G., & Lazowski, L. E. (1999). The Substance Abuse Subtle Screening Inventory-3 (SASSI-3) manual. Springville, IN: The SASSI Institute.
Selzer, M. L. (1971). The Michigan Alcoholism Screening Test (MAST): The quest for a new diagnostic instrument. American Journal of Psychiatry, 127, 1653–1658.
Tiet, Q. Q., Finney, J. W., & Moos, R. H. (2008). Screening psychiatric patients for illicit drug use disorders and problems. Clinical Psychology Review, 28, 578–591. doi:10.1016/j.cpr.2007.08.002
Wright, E. E., II, Piazza, N. J., & Laux, J. M. (2008). The utility of the SASSI-3 in early detection of substance use disorders in not guilty by reason of insanity acquittees: An exploratory study. Journal of Addictions & Offender Counseling, 28, 119–127. doi:10.1002/j.2161-1874.2008.tb00037.x
Youngstrom, E. A. (2014). A primer on receiver operating characteristic analysis and diagnostic efficiency
statistics for pediatric psychology: We are ready to ROC. Journal of Pediatric Psychology, 39, 204–221. doi:10.1093/jpepsy/jst062
John M. Laux is a Professor at The University of Toledo. Robin M. DuFresne is a practicing clinical counselor at the Zepf Center in Toledo, Ohio. Allison K. Arnekrans is an Assistant Professor at Central Michigan University. Sylvia Lindinger-Sternart is an Assistant Professor at the University of Great Falls. Christopher P. Roseman is an Associate Professor at The University of Toledo. Amy Wertenberger is a doctoral candidate at The University of Toledo. Stephanie Calmes is a professional counselor at Harbor Behavioral Health in Toledo, Ohio. Darren W. Love is the Treatment Program Manager at Court Diagnostic and Treatment Center in Toledo, Ohio. Andrew M. Burck is an Assistant Professor at Marshall University. Jim Schultz is a mental health counselor at Harbor Behavioral Health in Toledo, Ohio. Correspondence may be addressed to John M. Laux, MS 119, 2801 W. Bancroft St., Toledo, Ohio, 43606, John.Laux@utoledo.edu.