Oct 31, 2023 | Volume 13 - Issue 3
Nancy Chae, Adrienne Backer, Patrick R. Mullen
All counseling graduate students participate in fieldwork experiences and engage in supervision to promote their professional development. School counseling trainees complete these experiences in the unique context of elementary and secondary school settings. As such, school counselors-in-training (SCITs) may seek to approach supervision with specific strategies tailored for the roles, responsibilities, and dispositions required of competent future school counselors. This article suggests practical strategies for SCITs, including engaging in reflection; navigating feelings of vulnerability in supervision; developing appropriate professional dispositions for school counseling practice; and practicing self-advocacy, broaching, and self-care. Counselor educators can share these strategies to help students identify their needs for their field experiences and prepare for their professional careers as school counselors.
Keywords: supervision, professional development, school counseling, school counselors-in-training, strategies
School counselors-in-training (SCITs) are trainees enrolled in graduate-level counselor education programs and receive supervision as an integral component of their training (Bernard & Goodyear, 2019). Although the supervision relationship is often characterized as hierarchical, trainees must actively participate in the supervision process to develop competency as counseling professionals (Stark, 2017). Despite this, trainees in counseling programs generally receive little guidance on understanding their roles in supervision or how to make the most of their supervision experience to contribute to their learning (Pearson, 2004; Stark, 2017). Although Pearson (2004) offered suggestions for mental health counseling students to optimize their supervision experiences, there is limited literature about how school counseling students can maximize their supervision experiences. The intention of this article is to share strategies for SCITs to take the initiative to approach supervisors with questions and ideas about their overall supervision experience, though these suggestions are not limited to SCITs and may also be useful for trainees across other counseling disciplines.
School counseling site supervision is distinguishable from supervision in other helping professions in that the roles and responsibilities of professional school counselors extend beyond the individual and group counseling services that their community counseling partners provide (American School Counselor Association [ASCA], 2019a, 2021; Quintana & Gooden-Alexis, 2020). For example, comprehensive school counseling programming encompasses direct counseling services with students and families in addition to broader systemic consultation, advocacy, and support for school communities (ASCA, 2019a). School counselors encounter unique challenges in schools regarding student and staff mental health, issues related to equity and access, and navigating the political landscapes of school systems (Bemak & Chung, 2008). Even with an understanding of these distinct themes in school counseling, there is a lack of significance placed on supervision in school counseling within research and in practice to adequately respond to contemporary school counseling issues (Bledsoe et al., 2019). Examining how SCITs can approach supervision and their roles as trainees can ensure their own learning and developmental needs are met, along with the needs of their school communities.
Contexts of School Counseling Supervision
Supervision for SCITs is provided by experienced professional school counselors and characterized by an intentional balance of hierarchy, evaluation, and support during their practicum and internship fieldwork experiences (Bernard & Goodyear, 2019; Borders & Brown, 2005). School counselor supervision serves three primary purposes: (a) promoting competency in effective and ethical school counseling practice; (b) facilitating SCITs’ personal and professional development; and (c) upholding accountability of services and programs for the greater profession and the schools, students, and families receiving services (ASCA, 2021; L. J. Bradley et al., 2010). School counseling site supervisors utilize their training and experiences to guide SCITs through their induction to the profession and development of initial skills and dispositions.
ASCA (2021) compels school counseling supervisors to address the complexities specific to educational settings as they support the professional development of SCITs, which sets school counseling supervision apart from supervision in other clinical counseling disciplines. School counselors facilitate instruction and classroom management, provide appraisal and advisement, and support the developmental and social–emotional needs of students through data-informed school counseling programs (ASCA, 2019a). Within school and community settings, they also navigate systems with an advocacy and social justice orientation and attend to cultural competence and anti-racist work. Although there are school counseling–specific supervision models that address some of the complexities inherent in the work of school counselors (e.g., Lambie & Sias, 2009; Luke & Bernard, 2006; S. Murphy & Kaffenberger, 2007; Wood & Rayle, 2006), there is currently a gap in the school counseling literature about effectively addressing the unique supervision needs of SCITs. Therefore, school counselor practitioners and counselor educators may refer to professional standards for supervision to inform how they supervise and support the developmental needs of SCITs, which may also help SCITs to understand what they might expect to encounter in graduate-level supervision.
Professional Standards for School Counseling Supervision
School counseling professional standards underscore the need for school counselor supervisors to seek supervision and training (ASCA, 2019b; Council for Accreditation of Counseling and Related Educational Programs [CACREP], 2015; Quintana & Gooden-Alexis, 2020). Professional associations and accrediting organizations (e.g., ASCA, CACREP) promote adherence to and integration of school counselor standards and competencies related to leadership, advocacy, collaboration, systemic change, and ethical practice (ASCA, 2022; CACREP, 2015; Quintana & Gooden-Alexis, 2020). As such, school counseling supervision facilitates ethical and professional skill development through school counselor standards and competencies, such as the ASCA School Counselor Professional Standards & Competencies (ASCA, 2019c) and the ASCA Ethical Standards for School Counselors (ASCA, 2022).
School counseling supervisors can support SCITs’ professional growth and development by aligning supervision activities with specific standards and competencies (Quintana & Gooden-Alexis, 2020). For example, a supervisor seeking to model the school counselor mindset and behavior standards focused on collaborative partnerships (i.e., M 5, B-SS 6; ASCA, 2019c) might provide opportunities for SCITs to develop relationships with stakeholders (e.g., families, administrators, community) while supporting student achievement. Similarly, an example of aligning supervision activities with ethical standards might involve guiding an SCIT through the process of utilizing an ethical decision-making model to resolve a potential dilemma (see Section F; ASCA, 2022).
Supervision in School Counseling
Supervision in school counseling ensures that new professionals enter the field prepared to understand and support the needs of students by effectively applying ethical standards and best practices of the profession. As such, gatekeeping is a crucial component of supervision. As gatekeepers, counselor educators or supervisors exercise their professional authority to take action that prevents a trainee who does not enact the required professional dispositions and ethical practices from entering the profession of counseling (Bernard & Goodyear, 2019). When a trainee is identified as unable to achieve counseling competencies or likely to harm others, ethical practice guides counselor educators to provide developmental or remedial services to work toward improvements before dismissal from a counseling program (American Counseling Association [ACA], 2014; Foster & McAdams, 2009).
Although supervised fieldwork experiences during graduate education and training are needed for accreditation (CACREP, 2015) and state certification, professional school counselors employed in the field may not be required to participate in any form of post-master’s clinical supervision for initial school counseling certification or renewal of their certification, unlike professional clinical mental health counselors, who require post-master’s supervision to attain licensure (Dollarhide & Saginak, 2017; Mecadon-Mann & Tuttle, 2023). Administrative supervision provided by a school administrator is more common for school counselors than clinical supervision, which promotes the competence of counselors by focusing on the development and refinement of counseling skills (Herlihy et al., 2002). In other words, though school counselors routinely encounter complex situations that involve supporting students with acute needs and responding to crises, they likely do not receive the clinical supervision needed to enhance their judgment, skills, and ethical decision-making (Bledsoe et al., 2019; Brott et al., 2021; Herlihy et al., 2002; McKibben et al., 2022; Sutton & Page, 1994). Given the reality that school counselors may not access or receive opportunities for postgraduate clinical supervision, it is important that SCITs experience robust supervision during their graduate training programs with the support of qualified site and university supervisors. This sets the stage for SCITs to effectively engage with the challenges of their future school counseling careers.
Expectations of Site and University Supervisors
For SCITs who are new to the experience of supervision in their fieldwork, it is helpful to understand what they may expect from their respective site and university supervisors. Borders et al. (2014) recommended that supervisors initiate supervision, set goals with trainees, provide feedback, facilitate the supervisory relationship, and attend to diversity, as well as engage in advocacy, ethical consideration, documentation, and evaluation. Supervisors select supervision interventions that attend to the developmental needs of trainees, and they also serve as gatekeepers for the profession (Bernard & Goodyear, 2019; Borders et al., 2014). Furthermore, supervisors facilitate an effective relationship with their trainees, characterized by empowerment, encouragement, and safety (Dressel et al., 2007; Ladany et al., 2013; M. J. Murphy & Wright, 2005). Supervisors provide a balance of support and challenge in their feedback and interactions with trainees (Bernard & Goodyear, 2019) and attend to multicultural issues by broaching with their trainees about their intersecting identities and experiences of power, privilege, and marginalization (Dressel et al., 2007; Jones et al., 2019; M. J. Murphy & Wright, 2005). Supervisors also validate trainees’ experiences by acknowledging any emergent issues of vicarious trauma and encouraging self-care (K. Jordan, 2018).
Supervisors and trainees have mutual responsibilities to facilitate an effective supervision experience. Although supervisors may hold a more significant stake of power in the relationship, trainees’ willingness to take an active role also matters. School counseling trainees are not passive bystanders in the learning process; instead, they can be thoughtful learners yearning to take full advantage of the growth from their clinical experiences. To help illuminate the opportunities and expectations SCITs can seek during supervision, the subsequent strategies from school counseling supervision research serve as suggested approaches for SCITs to make the most of this fundamental and practical learning experience.
Strategies for School Counseling Trainees
School counseling trainees can take an active role to ensure that their supervision experiences are relevant to their personal and professional development. The following approaches do not constitute an all-encompassing list but provide a foundation and guidelines rooted in existing research to get the most out of the supervision experience, including engaging in reflection and vulnerability, practicing self-advocacy, broaching, and maintaining personal wellness.
Reflection in Supervision
Reflection is key to school counselor development, especially in supervision. Researchers have reported that continuous reflection helps novice counselors move toward higher levels of cognitive complexity and expertise (Borders & Brown, 2005; Skovholt & Rønnestad, 1992). A reflective trainee demonstrates openness to understanding; avoids being defensive; and engages in profound thought processes that lead to changes in their perceptions, practice, and complexity (Neufeldt et al., 1996). Through reflection, trainees consider troubling, confusing, or uncertain experiences or thoughts and then reframe them to problem-solve and guide future actions (Ward & House, 1998; Young et al., 2011). Further, by developing relationships with supervisors, trainees become open to receiving and integrating feedback to support their development (Borders & Brown, 2005). Reflection becomes an ongoing process and practice throughout trainees’ academic and field experiences and postgraduation.
Trainees can engage in self-reflective practices in various ways over the course of their graduate training. First, trainees can use a journal to record thoughts, feelings, and events throughout their school counseling field experiences. Research has shown that written or video journaling can help trainees to reflect on the highs and lows of counseling training and foster self-awareness (Parikh et al., 2012; Storlie et al., 2018; Woodbridge & O’Beirne, 2017). For example, trainees can connect their practical experiences with knowledge from academic learning to note discrepancies and consistencies (e.g., learning about the ASCA National Model and the extent to which a school chooses to implement the model; navigating the bureaucracy of school systems that often dictate roles and responsibilities of school counselors). Trainees can also challenge their thoughts by exploring difficult experiences using reflective journaling. They can journal about the different perspectives of those involved in the situation (e.g., students, parents/guardians, teachers, administrators), process ethical dilemmas, and gauge and manage any emotional experiences attached to grappling with challenges. Trainees desiring structured prompts can consider writing about specific developmental, emotional, and interpersonal experiences to process events related to counselor and client interactions (Storlie et al., 2018).
Second, trainees can consult with their supervisors to seek guidance and constructive feedback about challenging experiences (Borders & Brown, 2005). Hamlet (2022) recommended using the S.K.A.T.E.S. form to reflect on issues related to trainees’ Skills, Knowledge, Attitudes, Thoughts, Ethics, and Supervision needs. Using S.K.A.T.E.S., for example, a school counseling intern may reflect on how they incorporated motivational interviewing counseling skills to support a student struggling with their declining grades (North, 2017). They might seek supervision about a challenging crisis response at the school and process how they might have responded differently. Even after supervision sessions, trainees should engage in continued self-reflection and apply new learning to their clinical practice.
Third, trainees can utilize the Johari window as a tool to reflect upon the knowledge, awareness, and skills required for school counseling practice (Halpern, 2009). Trainees work with supervisors to consider questions or experiences to identify: (a) open areas (i.e., things known to everyone, such as critically discussing school- and district-wide policies that contribute to inequitable access to college preparatory courses); (b) hidden areas (i.e., things only known to the trainee to be shared in supervision, such as the trainee’s hesitations about leading a group counseling session with middle school students independently for the first time); (c) blind spots (i.e., things that the supervisor is aware of that the trainee may not be, such as personal biases, prejudices, stereotypes, and discriminatory attitudes that may affect the trainee’s conceptualizations and interactions with students and families); and (d) undiscovered potential (i.e., things that the supervisor and trainee can experience and learn together, such as engaging in professional learning together to align school counseling programming with a school-wide movement toward implementing restorative justice practices). This strategy also compels trainees to align their supervision goals with ethical codes (see A.4.b., F.8.c., and F.8.d in the ACA Code of Ethics) and standards for professional practice (ACA, 2014). Trainees can feel empowered to utilize the Johari window with supervisors and peers to guide conversations, generate questions, and develop insights to inform school counseling practice and explore ethical dilemmas.
Vulnerability in Supervision
Vulnerability is an essential yet challenging experience within the hierarchical nature of supervision. Being vulnerable involves feelings of uncertainty, reluctance, and exposure; hence, trainees require a sense of psychological safety and support to explore their needs and areas of weakness (Bradley et al., 2019; Giordano et al., 2018; J. V. Jordan, 2003). Although site supervisors hold the primary responsibility for facilitating supervision relationships characterized by safety and support (Bernard & Goodyear, 2019), trainees can feel empowered to advocate for supervision environments that encourage authenticity and vulnerability, which are conducive to growth and development.
First, trainees can discuss with their supervisors and peers to define feelings of vulnerability and create group norms to promote supported vulnerability (Bradley et al., 2019). With a shared understanding, trainees, supervisors, and peers create an environment for continued growth and risk-taking. For example, during the first group supervision meeting, trainees can suggest norms that will individually and collectively sustain a safe classroom community for sharing and learning. A lack of clear norms about how to communicate feedback may result in experiences of shame and affect trainees’ confidence (J. V. Jordan, 2003; Ratts & Greenleaf, 2018). To mitigate this, trainees, supervisors, and peers can collaboratively discuss appropriate and preferred ways of giving and receiving feedback that is supportive, productive, and meaningful (Ladany et al., 2013). For example, trainees may prefer specific comments rather than general praise: “When the client expressed their frustration, you did well to remain calm and reflect content and feelings in that moment,” instead of “You did a great job.” This exchange among trainees, supervisors, and peers offers a constructive and engaging experience in which individuals can appropriately support and challenge one another.
Second, reviewing recordings offers a learning opportunity for trainees to reflect upon and critique their own skills and dispositions (Borders & Brown, 2005). When presenting recorded case presentations, trainees can practice vulnerability by selecting and presenting recordings that highlight challenging areas that may require constructive feedback (i.e., show their worst rather than their best). Trainees can identify portions of recordings that exemplify where they need the most help, such as a challenging experience during an individual counseling session with a student. Further, when presenting their recordings, trainees can also ask for suggestions to improve consultation work with caregivers when discussing college and career planning issues or innovative instructional strategies for teaching a classroom lesson in response to challenging situations. Vulnerability also occurs when trainees seek support from supervisors and peers about blind spots and areas of strength and growth regarding skill development and self-awareness issues in the recorded session or role-play. For instance, a trainee may express concern about the increasing academic counseling referrals of ninth-grade students who are struggling with the transition to high school and ask for guidance about how to more effectively respond systemically and individually.
Self-Advocacy in Supervision
Self-advocacy is another empowering practice for trainees to identify their needs and seek support. Researchers have defined self-advocacy as understanding one’s rights and responsibilities, communicating needs, and negotiating for support, which helps trainees proactively approach supervision (Astramovich & Harris, 2007; Pocock et al., 2002). Although supervision is characterized as hierarchical, it is also a relationship based on mutual participation, with inherent expectations for trainees (Stark, 2017). Within the evaluative nature of a supervision relationship, trainees may reasonably feel intimidated about practicing self-advocacy. However, trainees can feel empowered to self-advocate when building rapport with supervisors in an environment characterized by safety and support.
To prepare to self-advocate, trainees should continue engaging in self-reflection on their gaps in knowledge, awareness, and skills related to school counseling practice and then consider the types of resources and supports needed from their supervisor to bridge such gaps. In alignment with their learning goals, trainees can self-advocate by taking the initiative to request support for what they would like to achieve during the supervision experience (Storlie et al., 2019). For example, trainees may inquire about logistical concerns, such as seeking guidance about appropriate and creative ways to ensure that they earn sufficient direct and indirect hours, or evaluative concerns, like asking how to improve in specific school counseling skill areas after mid- and end-of-semester evaluations. Trainees can also seek support with conceptualization (e.g., applying a theoretical orientation when understanding the potential contributors to a student’s feeling of anxiety), skill development (e.g., experience with advocating for students receiving special education services in an Individualized Educational Plan [IEP] meeting), and countertransference issues (e.g., emotional reactions that may arise when supporting a grieving student coping with a loss; Pearson, 2004). Trainees should prepare specific questions that communicate their needs and explicitly request resources, opportunities, or next steps for continued improvement and development.
Trainees may also self-advocate through positive communication, which is a critical skill for helping professionals and in maintaining relationships (Biganeh & Young, 2021). Positive communication may involve actively listening to their supervisor’s insights, presenting statements that paraphrase their supervisor’s key points, and asking open-ended questions to elicit mutual exploration of topics of interest. For instance, after observing a crisis response to a student expressing suicidal ideation, the trainee can debrief about their experiences with their supervisor by summarizing key observations and protocol followed, while also asking what steps could be added or reconsidered if the trainee were leading the crisis response. Additionally, practicing communication skills in the context of supervision may enhance trainees’ competence and confidence when interacting with students and stakeholders, including caregivers, teachers, and administrators (Heaven et al., 2006). For example, trainees can request to observe and later role-play how they might facilitate a consultation meeting with a student and their parent to discuss the importance of consistent attendance and academic development.
Trainees can get the most out of their supervision experience by self-advocating and taking initiative to describe their unique learning styles and needs (Storlie et al., 2019). This provides an opportunity for trainees to proactively convey their goals and concerns about students and stakeholders at their sites (Baltrinic et al., 2021; Cook & Sackett, 2018). For example, if the trainee has become increasingly comfortable with co-leading a group counseling session, the trainee can communicate a desire to design and independently lead a group counseling session and then seek feedback about the curriculum plans or recordings of the session for continued improvement in group facilitation skills. Ultimately, engaging in self-advocacy skills during fieldwork helps trainees prepare for their careers as school counselors, in which self-advocacy is necessary when seeking professional development, resources for school counseling program development, and navigating school systems and politics to support their students and school counseling programs (Oehrtman & Dollarhide, 2021).
Broaching
Broaching is an ongoing behavior in which counselors invite conversations to explore race, ethnicity, and culture with clients, which can strengthen the counseling relationship and enhance cultural responsiveness and therapeutic benefits (Day-Vines et al., 2007, 2013). Likewise, in supervisory relationships, broaching helps supervisors and trainees to understand how cultural factors affect the supervisory relationship (Jones et al., 2019). Without broaching, both supervisors and trainees may miss meaningful contexts and realities, potentially rupturing the supervisory relationship (Jones et al., 2019). Broaching is also a key demonstration of commitment to culturally informed clinical supervision that promotes cultural humility and anti-racist counseling and supervision practice (Cartwright et al., 2021).
Although supervisors are charged with the responsibility of broaching based on the hierarchical nature of the supervisory relationship and its inherent power dynamics, they may not consistently incorporate broaching as part of their regular supervision behaviors (Bernard & Goodyear, 2019; King & Jones, 2019). Trainees who feel empowered to discuss issues of identity and power in supervision are more likely to initiate broaching conversations with their supervisors (King & Jones, 2019). As such, trainees should feel encouraged to engage in discussions with their supervisors to openly address cultural identities that may impact the supervisory relationship and their work with students and stakeholders in schools. King and Jones (2019) suggested that trainees can broach topics that they feel comfortable discussing within the context of their supervision relationship. It is necessary to note that the process and outcome of broaching in supervision are not only contingent upon the diverse sociocultural and sociopolitical contexts of individuals, but also on where the trainee and supervisor lie within the continuum of broaching styles and their own racial identity development as well as the power and hierarchy dynamics of the supervisory relationship (Bernard & Goodyear, 2019; Day-Vines et al., 2007; Jones et al., 2019). Just as for any novice counselor and individuals in the early stages of the broaching styles continuum, there may be hesitation, anxiousness, misunderstanding, or intimidation about engaging in broaching skills, especially considering the power dynamic of supervision. Trainees can self-assess their broaching style by using the Broaching Attitudes and Behavior Survey (Day-Vines et al., 2007, 2013), which might provide them with insight about their own level of comfort with broaching in supervision.
Trainees can seek continuing education and support from supervisors and peers about developing and strengthening their understanding of cultural diversity, race, oppression, and privilege related to school counseling. If a trainee feels nervous about broaching with their supervisor, the trainee can express their desire to practice broaching and seek feedback from their supervisor after broaching has taken place (e.g., “I would like to try broaching about a student’s cultural identities, and I was wondering if you could share your thoughts with me.”). Trainees can also directly express curiosities, observations, or questions about how any cultural differences and similarities between the supervisor and trainee may impact and inform the supervisory relationship. For example, a trainee and supervisor can discuss prior supervisory relationships, such as in academic or employment experiences, and identify the shared or different intersectional cultural identities to understand how this new supervisory relationship can be a meaningful relationship and safe space for learning. This exercise demonstrates cultural humility in which trainees engage in respectful curiosity, a stance of openness, and cultural awareness that enhances the supervisory working alliance (Watkins et al., 2019).
Broaching can also help school counseling trainees move beyond the nice counselor syndrome—a phenomenon in which stakeholders may often view school counselors as harmonious and unengaged in conflict, which supersedes their position as social justice advocates and instead perpetuates the status quo and reinforces inequities (Bemak & Chung, 2008). Because broaching invites discussion about multicultural and social justice issues, trainees can initiate conversations about personal obstacles (e.g., apathy, anxiety, guilt, discomfort) and professional obstacles (e.g., professional paralysis, resistance, job security) during supervision (Bemak & Chung, 2008). For example, a trainee can seek guidance about how to present a proposal to administrators about an affinity group for LGBTQ+ students and allies in the school. They can discuss potential personal and professional obstacles, how to overcome such obstacles to promote the group, and how to advocate for inclusion of LGBTQ+ students. It is important for trainees to engage in advocacy during their fieldwork experiences because social justice is inherent to school counselor identity and comprehensive school counseling programs (Glosoff & Durham, 2010).
Personal Well-Being
Self-care and personal wellness are necessary not only for counseling practice but also for supervision experiences; these contribute to personal and professional development and ethical practice, promote positive outcomes with students/clients, and mitigate issues of burnout and turnover (Blount et al., 2016; Branco & Patton-Scott, 2020; Mullen et al., 2020). For trainees, it is typical yet challenging to balance an academic workload; the demands of fieldwork; and other personal, social, and emotional experiences. Trainees can utilize supervision to maintain accountability for self-assessing their wellness practices that support their continued effective and ethical counseling practice. Marley (2011) found that self-help strategies can reduce emotional distress and offer coping skills to manage difficulties, which can help trainees maintain their self-care and develop skills for continued wellness.
Blount et al. (2016) suggested developing a wellness identity in supervision. Trainees can develop a wellness identity by acknowledging the wellness practices they already engage in and continuing practices that help to maintain self-care. Moreover, Mullen et al. (2020) found that engaging in problem-solving pondering (e.g., planning or developing a strategy to complete a task or address a problem within fieldwork), as opposed to negative work-related rumination, supported well-being, higher job satisfaction, and work engagement for school counselors. For example, rather than ruminating about a disagreement with a teacher regarding recommending a student for the gifted program, the trainee can consider ways to turn future conversations into partnership opportunities with the teacher—while also consulting with the supervisor, administrator, and parent about considering additional data points to advocate for the student’s enrollment in the gifted program.
Another way for trainees to support their well-being is to acknowledge their strengths (Wiley et al., 2021) related to their clinical knowledge, awareness, and skills in live and recorded sessions with students. This can be challenging yet empowering for trainees who are quick to self-criticize. For instance, before jumping to areas for improvement, trainees are encouraged to first ask, “What did I do well here?” and also request recommendations for additional wellness strategies to strengthen their school counseling practice. Additional resources, such as readings or role-plays, may help trainees
re-center themselves after difficult or challenging scenarios. For example, after making their first report to child protective services about a suspected physical abuse case, the trainee can process with their supervisor and discuss potential self-care strategies and resources to manage the difficult emotions arising from the challenging experience.
Moreover, researchers suggested utilizing self-compassion as a means of self-care for counseling graduate students (Nelson et al., 2018). Trainees can intentionally practice being kind to oneself; normalizing and humanizing the experience of challenges; and being aware of one’s own feelings, thoughts, and reactions, which can enhance their well-being and reduce potential fatigue and burnout (Nelson et al., 2018; Pearson, 2004). For example, after hearing difficult feedback from their supervisor about improving a lesson plan, a trainee can try reframing weaknesses as areas for continued growth. Or, when reviewing a mid- or end-of-semester evaluation with their supervisor, a trainee can practice being present and open to feedback while also monitoring and taking the initiative to share feelings, insights, and questions. After a supervision session or evaluative experience, a trainee can also engage in journaling or compassionate letter writing (Nelson et al., 2018) to be mindfully aware of their emotions and normalize the challenging growth experiences of a developing counselor.
Overall, trainees deserve meaningful, supportive, and responsive supervision, yet they commonly (mis)perceive themselves as in positions of less power in supervision and their fieldwork sites. Trainees should feel empowered to consult with others at their sites and universities to address issues of concern and seek clarification from supervisors about the expectations of supervision; this supports an effective, collaborative supervision experience. Together with supervisors, trainees can review the strategies throughout supervision sessions. With guidance and support, trainees can attempt such strategies within the safety of the supervisory relationship.
Implications for Site Supervisors and Counselor Educators
There are several implications for site supervisors and counselor educators when considering strategies to empower trainees to maximize their supervision experience. Although trainees can take the initiative to implement such strategies independently, some suggestions may require additional collaborative support and guidance from site supervisors and counselor educators. For example, site supervisors and counselor educators could consider introducing the strategies posed in this article during supervision sessions or as assigned reading for discussion. Altogether, engaging in and facilitating these strategies contributes to the development of important dispositional characteristics required of professional school counselors.
Site supervisors and counselor educators have the responsibility to facilitate a supervision environment in which trainees feel empowered to utilize the suggested strategies. This requires them to intentionally balance safety and support with challenge and high expectations (Stoltenberg, 1981). When trainees lack a sense of safety, they may be less likely to self-disclose dilemmas or concerns and more likely to feel shame, which jeopardizes the overall supervision experience and relationship (J. V. Jordan, 2003; Murphy & Wright, 2005). When trainees experience inclusivity in their training programs and move past the discomfort of vulnerability, they can experience growth, strengthen the supervisory relationship, and address their learning goals (Bradley et al., 2019; Giordano et al., 2018). For example, although trainees can take the initiative to suggest norms for supervision, we encourage supervisors to invite or prompt discussions related to trainees’ learning needs and expectations for the supervisory relationship.
Reflection and vulnerability also require rapport and trust for trainees to self-advocate. Further, when trainees can communicate with their supervisors about their needs, supervisors can respond by appropriately facilitating their request for support (Stoltenberg, 1981). During supervision, supervisors also model, teach, and monitor wellness strategies to support trainees’ ethical and professional school counseling practice (Blount et al., 2016). For instance, site supervisors and counselor educators may need to introduce the Johari window framework as a structured reflective exercise, if trainees are not already aware of this tool (Halpern, 2009).
Finally, broaching within supervision may offer a proactive means of exploring dynamics, power, and cultural differences that can bolster the quality and longevity of the supervision experience. However, the onus is typically on supervisors to initiate broaching conversations after they have facilitated a supervision relationship characterized by trust, acceptance, and inclusion (Jones et al., 2019). Supervisors model how to broach topics of race and culture within the dynamics of the supervisory relationship so that trainees can feel empowered to incorporate broaching as an ongoing professional disposition during and beyond supervision. For example, trainees and supervisors are encouraged to explore, model, and role-play recommendations from Bemak and Chung (2008) to move beyond nice counselor syndrome in school counseling practice.
Limitations and Future Research
Although this article provided a variety of practical strategies for SCITs to navigate supervision, it is not intended to be comprehensive and is not without limitations. The suggested strategies have been informed by research to support the supervision process and overall trainee development but may not necessarily be empirically supported. In addition, the strategies may not apply across all supervision contexts, relationships, and circumstances; thus, we encourage trainees to use their best judgment to consider which strategies may be most feasible and useful within their given contexts. Although this article attempted to provide examples specific to the unique work environment and responsibilities that SCITs will encounter, several suggestions provided herein may also apply to counseling trainees working outside of school counseling contexts. Knowing that supervision is an evaluative and hierarchical process, there may be dynamics of power and privilege present that may intimidate or hinder trainees from autonomously attempting and engaging in such strategies. Thus, the power dynamics of supervision may present a barrier for some trainees to self-advocate.
Future research is needed about the characteristics and contributions of trainees that can enhance the supervisory relationship and competence of the supervisor. Researchers could consider a qualitative study to explore SCITs’ experiences of autonomously implemented strategies during supervision as well as a quantitative intervention study to assess the effectiveness of specific strategies to enhance trainee and supervisor development, self-efficacy, and competence. Researchers could also consider strategies specific to site- and university-based supervision that offer evidence for trainees’ growth and competence and later longitudinal impacts of such strategies on personal and professional development.
Conclusion
Considering that supervision is a time-limited experience, these suggested strategies for approaching supervision can inform SCITs (and trainees from other counseling disciplines) about ways to advocate for a quality supervision experience. When trainees are prepared for supervision, they may feel less anxious and more empowered to approach and shape supervision to meet their developmental needs. When trainees are mindful of and actively engaged in reflection, vulnerability, self-advocacy, broaching, and wellness, they can feel empowered to seek support and resources to bridge gaps in their learning and development during the supervision experience. Site supervisors and counselor educators can also share these strategies with trainees and encourage trainees to implement them in fieldwork and university contexts.
Conflict of Interest and Funding Disclosure
The authors reported no conflict of interest
or funding contributions for the development
of this manuscript.
References
American Counseling Association. (2014). ACA code of ethics. https://www.counseling.org/resources/aca-code-of-ethics.pdf
American School Counselor Association. (2019a). The ASCA national model: A framework for school counseling programs (4th ed.).
American School Counselor Association. (2019b). ASCA standards for school counselor preparation programs. https://www.schoolcounselor.org/getmedia/573d7c2c-1622-4d25-a5ac-ac74d2e614ca/ASCA-Standards-for-School-Counselor-Preparation-Programs.pdf
American School Counselor Association. (2019c). ASCA school counselor professional standards & competencies. https://www.schoolcounselor.org/getmedia/a8d59c2c-51de-4ec3-a565-a3235f3b93c3/SC-Competencies.pdf
American School Counselor Association. (2021). The school counselor and school counselor supervision. https://www.schoolcounselor.org/Standards-Positions/Position-Statements/ASCA-Position-Statements/The-School-Counselor-and-School-Counselor-Supervis
American School Counselor Association. (2022). ASCA ethical standards for school counselors. https://www.schoolcounselor.org/getmedia/44f30280-ffe8-4b41-9ad8-f15909c3d164/EthicalStandards.pdf
Astramovich, R. L., & Harris, K. R. (2007). Promoting self-advocacy among minority students in school counseling. Journal of Counseling & Development, 85(3), 269–276. https://doi.org/10.1002/j.1556-6678.2007.tb00474.x
Baltrinic, E. R., Cook, R. M., & Fye, H. J. (2021). A Q methodology study of supervisee roles within a counseling practicum course. The Professional Counselor, 11(1), 1–15. https://doi.org/10.15241/erb.11.1.1
Bemak, F., & Chung, R. C.-Y. (2008). New professional roles and advocacy strategies for school counselors: A multicultural/social justice perspective to move beyond the Nice Counselor Syndrome. Journal of Counseling & Development, 86(3), 372–381. https://doi.org/10.1002/j.1556-6678.2008.tb00522.x
Bernard, J. M., & Goodyear, R. K. (2019). Fundamentals of clinical supervision (6th ed.). Pearson.
Biganeh, M., & Young, S. L. (2021). Followers’ perceptions of positive communication practices in leadership: What matters and surprisingly what does not. International Journal of Business Communication, 0(0).
https://doi.org/10.1177/2329488420987277
Bledsoe, K. G., Logan-McKibben, S., McKibben, W. B., & Cook, R. M. (2019). A content analysis of school counseling supervision. Professional School Counseling, 22(1), 1–8. https://doi.org/10.1177/2156759X19838454
Blount, A. J., Taylor, D. D., Lambie, G. W., & Anwell, A. N. (2016). Clinical supervisors’ perceptions of wellness: A phenomenological view on supervisee wellness. The Professional Counselor, 6(4), 360–374.
https://doi.org/10.15241/ab.6.4.360
Borders, L. D., & Brown, L. L. (2005). The new handbook of counseling supervision (1st ed.). Routledge.
Borders, L. D., Glosoff, H. L., Welfare, L. E., Hays, D. G., DeKruyf, L., Fernando, D. M., & Page, B. (2014). Best practices in clinical supervision: Evolution of a counseling specialty. The Clinical Supervisor, 33(1), 26–44. https://doi.org/10.1080/07325223.2014.905225
Bradley, L. J., Ladany, N., Hendricks, B., Whiting, P. P., & Rhode, K. M. (2010). Overview of counseling supervision. In N. Ladany & L. J. Bradley (Eds.), Counselor supervision (4th ed.). Routledge.
Bradley, N., Stargell, N., Craigen, L., Whisenhunt, J., Campbell, E., & Kress, V. (2019). Creative approaches for promoting vulnerability in supervision: A relational-cultural approach. Journal of Creativity in Mental Health, 14(3), 391–404. https://doi.org/10.1080/15401383.2018.1562395
Branco, S. F., & Patton-Scott, V. (2020). Practice what we teach: Promoting wellness in a clinical mental health counseling master’s program. Journal of Creativity in Mental Health, 15(3), 405–412.
https://doi.org/10.1080/15401383.2019.1696260
Brott, P. E., DeKruyf, L., Hyun, J. H., LaFever, C. R., Patterson-Mills, S., Cook Sandifer, M. I., & Stone, V. (2021). The critical need for peer clinical supervision among school counselors. Journal of School-Based Counseling Policy and Evaluation, 3(2), 51–60. https://doi.org/10.25774/nr5m-mq71
Cartwright, A. D., Carey, C. D., Chen, H., Hammonds, D., Reyes, A. G., & White, M. E. (2021). Multi-tiered intensive supervision: A culturally-informed method of clinical supervision. Teaching and Supervision in Counseling, 3(2), Article 8. https://doi.org/10.7290/tsc030208
Cook, R. M., & Sackett, C. R. (2018). Exploration of prelicensed counselors’ experiences prioritizing information for clinical supervision. Journal of Counseling & Development, 96(4), 449–460. https://doi.org/10.1002/jcad.12226
Council for Accreditation of Counseling and Related Educational Programs. (2015). 2016 CACREP standards. http://www.cacrep.org/wp-content/uploads/2017/08/2016-Standards-with-citations.pdf
Day-Vines, N. L., Bryan, J., & Griffin, D. (2013). The Broaching Attitudes and Behavior Survey (BABS): An exploratory assessment of its dimensionality. Journal of Multicultural Counseling and Development, 41(4), 210–223. https://doi.org/10.1002/j.2161-1912.2013.00037.x
Day-Vines, N. L., Wood, S. M., Grothaus, T., Craigen, L., Holman, A., Dotson-Blake, K., & Douglass, M. J. (2007). Broaching the subjects of race, ethnicity, and culture during the counseling process. Journal of Counseling & Development, 85(4), 401–409. https://doi.org/10.1002/j.1556-6678.2007.tb00608.x
Dollarhide, C. T., & Saginak, K. A. (2017). Comprehensive school counseling programs: K-12 delivery systems in action (3rd ed.). Pearson.
Dressel, J. L., Consoli, A. J., Kim, B. S. K., & Atkinson, D. R. (2007). Successful and unsuccessful multicultural supervisory behaviors: A Delphi poll. Journal of Multicultural Counseling and Development, 35(1), 51–64. https://doi.org/10.1002/j.2161-1912.2007.tb00049.x
Foster, V. A., & McAdams, C. R., III. (2009). A framework for creating a climate of transparency for professional performance assessment: Fostering student investment in gatekeeping. Counselor Education & Supervision, 48(4), 271–284. https://doi.org/10.1002/j.1556-6978.2009.tb00080.x
Giordano, A. L., Bevly, C. M., Tucker, S., & Prosek, E. A. (2018). Psychological safety and appreciation of differences in counselor training programs: Examining religion, spirituality, and political beliefs. Journal of Counseling & Development, 96(3), 278–288. https://doi.org/10.1002/jcad.12202
Glosoff, H. L., & Durham, J. C. (2010). Using supervision to prepare social justice counseling advocates. Counselor Education and Supervision, 50(2), 116–129. https://doi.org/10.1002/j.1556-6978.2010.tb00113.x
Halpern, H. (2009). Supervision and the Johari window: A framework for asking questions. Education for Primary Care, 20(1), 10–14. https://doi.org/10.1080/14739879.2009.11493757
Hamlet, H. S. (2022). School counseling practicum and internship: 30+ essential lessons (2nd ed.). Cognella Academic Publishing.
Heaven, C., Clegg, J., & Maguire, P. (2006). Transfer of communication skills training from workshop to workplace: The impact of clinical supervision. Patient Education and Counseling, 60(3), 313–325.
https://doi.org/10.1016/j.pec.2005.08.008
Herlihy, B. J., Gray, N., & McCollum, V. (2002). Legal and ethical issues in school counselor supervision. Professional School Counseling, 6(1), 55–60.
Jones, C. T., Welfare, L. E., Melchior, S., & Cash, R. M. (2019). Broaching as a strategy for intercultural understanding in clinical supervision. The Clinical Supervisor, 38(1), 1–16.
https://doi.org/10.1080/07325223.2018.1560384
Jordan, J. V. (2003). Valuing vulnerability: New definitions of courage. Women in Therapy, 31(2–4), 209–233. https://doi.org/10.1080/02703140802146399
Jordan, K. (2018). Trauma-informed counseling supervision: Something every counselor should know about. Asia Pacific Journal of Counseling and Psychotherapy, 9(2), 127–142. https://doi.org/10.1080/21507686.2018.1450274
King, K. M., & Jones, K. (2019). An autoethnography of broaching in supervision: Joining supervisee and supervisor perspectives on addressing identity, power, and difference. The Clinical Supervisor, 38(1), 17–37. https://doi.org/10.1080/07325223.2018.1525597
Ladany, N., Mori, Y., & Mehr, K. E. (2013). Effective and ineffective supervision. The Counseling Psychologist, 41(1), 28–47. https://doi.org/10.1177/0011000012442648
Lambie, G. W., & Sias, S. M. (2009). An integrative psychological developmental model of supervision for professional school counselors-in-training. Journal of Counseling & Development, 87(3), 349–356.
https://doi.org/10.1002/j.1556-6678.2009.tb00116.x
Luke, M., & Bernard, J. M. (2006). The School Counseling Supervision Model: An extension of the Discrimination Model. Counselor Education and Supervision, 45(4), 282–295. https://doi.org/10.1002/j.1556-6978.2006.tb00004.x
Marley, E. (2011). Self-help strategies to reduce emotional distress: What do people do and why? A qualitative study. Counselling and Psychotherapy Research, 11(4), 317–324. https://doi.org/10.1080/14733145.2010.533780
McKibben, W. B., George, A. L., Gonzalez, O., & Powell, P. W. (2022). Exploring how counselor education programs support site supervisors. Journal of Counselor Preparation and Supervision, 15(2). https://digital
commons.sacredheart.edu/jcps/vol15/iss2/1
Mecadon-Mann, M., & Tuttle, M. (2023). School counselor professional identity in relation to post-master’s supervision. Professional School Counseling, 27(1), 1–11. https://doi.org/10.1177/2156759X221143932
Mullen, P. R., Backer, A., Chae, N., & Li, H. (2020). School counselors’ work-related rumination as a predictor of burnout, turnover intentions, job satisfaction, and work engagement. Professional School Counseling, 24(1), 1–10. https://doi.org/10.1177/2156759X20957253
Murphy, M. J., & Wright, D. W. (2005). Supervisees’ perspectives of power use in supervision. Journal of Marital and Family Therapy, 31(3), 283–295. https://doi.org/10.1111/j.1752-0606.2005.tb01569.x
Murphy, S., & Kaffenberger, C. (2007). ASCA National Model: The foundation for supervision of practicum and internship students. Professional School Counseling, 10(3), 289–296.
https://doi.org/10.1177/2156759X0701000311
Nelson, J. R., Hall, B. S., Anderson, J. L., Birtles, C., & Hemming, L. (2018). Self-compassion as self-care: A simple and effective tool for counselor educators and counseling students. Journal of Creativity in Mental Health, 13(1), 121–133. https://doi.org/10.1080/15401383.2017.1328292
Neufeldt, S. A., Karno, M. P., & Nelson, M. L. (1996). A qualitative study of experts’ conceptualizations of supervisee reflectivity. Journal of Counseling Psychology, 43(1), 3–9. https://doi.org/10.1037/0022-0167.43.1.3
North, R. A. (2017). Motivational interviewing for school counselors. Independently Published.
Oehrtman, J. P., & Dollarhide, C. T. (2021). Advocacy without adversity: Developing an understanding of micropolitical theory to promote a comprehensive school counseling program. Professional School Counseling, 25(1), 1–9. https://doi.org/10.1177/2156759X211006623
Parikh, S. B., Janson, C., & Singleton, T. (2012). Video journaling as a method of reflective practice. Counselor Education and Supervision, 51(1), 33–49. https://doi.org/10.1002/j.1556-6978.2012.00003.x
Pearson, Q. M. (2004). Getting the most out of clinical supervision: Strategies for mental health. Journal of Mental Health Counseling, 26(4), 361–373. https://doi.org/10.17744/mehc.26.4.tttju8539ke8xuq6
Pocock, A., Lambros, S., Karvonen, M., Test, D. W., Algozzine, B., Wood, W., & Martin, J. E. (2002). Successful strategies for promoting self-advocacy among students with LD: The LEAD group. Intervention in School and Clinic, 37(4), 209–216. https://doi.org/10.1177/105345120203700403
Quintana, T. S., & Gooden-Alexis, S. (2020). Making supervision work. American School Counselor Association.
Ratts, M. J., & Greenleaf, A. T. (2018). Multicultural and social justice counseling competencies: A leadership framework for professional school counselors. Professional School Counseling, 21(1b), 1–9.
https://doi.org/10.1177/2156759X18773582
Skovholt, T. M., & Rønnestad, M. H. (1992). Themes in therapist and counselor development. Journal of Counseling & Development, 70(4), 505–515. https://doi.org/10.1002/j.1556-6676.1992.tb01646.x
Stark, M. D. (2017). Assessing counselor supervisee contribution. Measurement and Evaluation in Counseling and Development, 50(3), 170–182. https://doi.org/10.1080/07481756.2017.1308224
Stoltenberg, C. (1981). Approaching supervision from a developmental perspective: The counselor complexity model. Journal of Counseling Psychology, 28(1), 59–65. https://doi.org/10.1037/0022-0167.28.1.59
Storlie, C. A., Baltrinic, E., Fye, M. A., Wood, S. M., & Cox, J. (2019). Making room for leadership and advocacy in site supervision. Journal of Counselor Leadership and Advocacy, 6(1), 1–15.
https://doi.org/10.1080/2326716X.2019.1575778
Storlie, C. A., Giegerich, V., Stoner-Harris, T., & Byrd, J. (2018). Conceptual metaphors in internship: Creative journeys in counselor development. Journal of Creativity in Mental Health, 13(3), 331–343.
https://doi.org/10.1080/15401383.2018.1439790
Sutton, J. M., Jr., & Page, B. J. (1994). Post-degree clinical supervision of school counselors. The School Counselor, 42(1), 32–39. https://www.jstor.org/stable/23901709
Ward, C. C., & House, R. M. (1998). Counseling supervision: A reflective model. Counselor Education and Supervision, 38, 23–33. https://doi.org/10.1002/j.1556-6978.1998.tb00554.x
Watkins, C. E., Jr., Hook, J. N., Mosher, D. K., & Callahan, J. L. (2019). Humility in clinical supervision: Fundamental, foundational, and transformational. The Clinical Supervisor, 38(1), 58–78.
https://doi.org/10.1080/07325223.2018.1487355
Wiley, E. D., Phillips, J. C., & Palladino Schultheiss, D. E. (2021). Supervisors’ perceptions of their integration of strength-based and multicultural approaches to supervision. The Counseling Psychologist, 49(7), 1038–1069. https://doi.org/10.1177/00110000211024595
Wood, C., & Rayle, A. D. (2006). A model of school counseling supervision: The Goals, Functions, Roles, and Systems Model. Counselor Education and Supervision, 45(4), 253–266.
https://doi.org/10.1002/j.1556-6978.2006.tb00002.x
Woodbridge, L., & O’Beirne, B. R. (2017). Counseling students’ perceptions of journaling as a tool for developing reflective thinking. The Journal of Counselor Preparation and Supervision, 9(2), Article 12.
https://doi.org/10.7729/92.1198
Young, T. L., Lambie, G. W., Hutchinson, T., & Thurston-Dyer, J. (2011). The integration of reflectivity in developmental supervision: Implications for clinical supervisors. The Clinical Supervisor, 30(1), 1–18. https://doi.org/10.1080/07325223.2011.532019
Nancy Chae, PhD, NCC, NCSC, ACS, LCPC, is an assistant professor at the University of San Diego. Adrienne Backer, PhD, is an assistant professor at Texas A&M University–Corpus Christi. Patrick R. Mullen, PhD, NCC, NCSC, ACS, is an associate professor and department chair at Virginia Commonwealth University. Correspondence may be addressed to Nancy Chae, University of San Diego, Mother Rosalie Hill Hall, 5998 Alcalá Park, San Diego, CA 92110, nchae@sandiego.edu.
Aug 24, 2023 | Volume 13 - Issue 2
Chloe Lancaster, Michelle W. Brasfield
The COVID-19 pandemic led to an unparalleled disruption of student learning, disengaged students from school and peers, increased exposure to trauma, and had a negative impact on students’ mental health and well-being. School counselors are the most accessible mental health care professionals in a school, providing support for all students’ social and emotional needs and academic success. This study used an exploratory survey design to investigate the perspectives of 207 school counselors in Tennessee regarding students’ COVID-19–related mental health, academic functioning, and interpersonal skills; interventions school counselors have deployed to support students; and barriers they have encountered. Results indicate that students’ mental health has significantly declined across all grade levels and is interconnected with academic, social, and behavioral problems; school counselors have provided support consistent with crisis counseling; and caseload and non-counseling duties have created significant barriers in the provision of care.
Keywords: COVID-19, school counselors, student mental health, interventions, barriers
The psychological cost of the COVID-19 pandemic has been profound and wide-reaching. Although the K–12 population has been less susceptible to the adverse physical effects of COVID-19, for many, the pandemic has left an indelible mark on their mental health (Karaman et al., 2021). Before the outbreak of COVID-19 in 2020, youth mental health had become an issue of national concern, with one in six minors struggling with mental illness (Whitney & Peterson, 2019). Research has emerged to indicate that COVID-19 has further elevated the mental health problems of K–12 students across the nation (Ellis et al., 2020; Karaman et al., 2021; Magson et al., 2021). The end of COVID-19 lockdown restrictions may have alleviated immediate issues associated with social isolation and online learning; however, for those students experiencing COVID-19–related trauma and crisis, symptomatology has persisted beyond school reentry (Centers for Disease Control and Prevention [CDC], 2022; Patterson, 2022). As frontline helping professionals with training in mental health and school systems, school counselors are often the first responders to students in crisis (Karaman et al., 2021; Lambie et al., 2019), yet researchers have not explored reentry problems from the school counselor’s perspective. We conducted this study to understand school counselors’ experience of COVID-19–related student issues, their strategies to assist students, and their encountered barriers. We theorized that persistent problems related to the organizational structures within which counselors work, such as large caseloads, assignment of non-counseling duties, and under-resourced schools and communities (Lambie et al., 2019), may have greatly impacted their ability to meaningfully help students in high need of mental health support.
Literature Review
Students and COVID-19–Related Distress
From the outset of the COVID-19 pandemic, scholars predicted that disruptions to schooling, COVID-19–related stress, family conflict, and frequent media exposure to the pandemic would amplify mental health problems in children and youth (Imran et al., 2020). Empirical studies published in 2020 and 2021 have substantiated this concern, with findings indicating that COVID-19 restrictions adversely affected youth in multiple ways, including the development of unhealthy eating habits, increased screen time, reduced physical activity, sleep disturbances, academic delays, social problems, and an overall escalation in mental health concerns (Ellis et al., 2020; Karaman et al., 2021; Magson et al., 2021). The preponderance of research focused on adolescents, particularly as extended time in social isolation disrupted their developmental reliance on peer interactions for social and emotional support (Imran et al., 2020). Multiple studies found that not feeling connected to friends, high social media usage, and general COVID-19–related fears were associated with higher levels of depression and anxiety (Ellis et al., 2020; Karaman et al., 2021; Magson et al., 2021).
Although less is known about the impact of COVID-19 on younger children, evidence is emerging to indicate that the COVID-19 pandemic has elevated adverse childhood experiences (ACEs; Bryant et al., 2020). From a developmental perspective, children are less able to communicate and process their thoughts and feelings and are greatly affected by the emotional state of their caregivers (Zimmer-Gembeck & Skinner, 2011). Thus, exposure to parental anxieties related to housing, food, and economic insecurity likely exerted a destabilizing effect on children during the stay-at-home mandate and beyond (Imran et al., 2020). Further, children in poverty may be particularly vulnerable to an amplification of ACEs due to their families being disproportionately impacted by economic hardships and family mortality during the pandemic (Bryant et al., 2020).
Students’ Mental Health Pre-Pandemic
The COVID-19 pandemic increased intra-family adversity, which has long-term implications for the well-being of children and adolescents (CDC, 2022). However, in pre–COVID-19 times, with the rise in school shootings and teen suicide, the mental health of K–12 populations had already become a public health concern. According to the National Alliance on Mental Illness, one in six children aged 6–17 experienced a mental health disorder (Whitney & Peterson, 2019). Since reentry following COVID-19 shutdowns, indicators suggest the COVID-19 pandemic has worsened children’s mental health (CDC, 2022; Karaman et al., 2021), with widespread reports of student learning gaps, chronic absenteeism, declines in social skills, and increased behavior problems (CDC, 2022; Patterson, 2022). Further, previous research on children’s responses to a variety of traumatic events has found that children and adolescents can develop long-term mental illness following a traumatic experience, which is unlikely to abate without intervention (Udwin et al., 2000). For youth, the experience of mental health problems increases their risk factors in other areas, such as a decline in academic performance, poor decision-making, drug use, and high-risk sexual behaviors (CDC, 2022). In this regard, the responsiveness of schools to flex their organizational resources to address the psychological changes in their student body seems instrumental in assuaging the long-term effects of COVID-related trauma and the mitigation of adverse educational outcomes (Savitz-Romer et al., 2021).
School Counselors’ Role in Provision of Mental Health Services
Schools have long been discussed as a primary access point for mental health services, given that children spend much of their day in school, and children and adolescents in need of mental health care are more likely to receive assistance in a school as opposed to a clinical setting (Lambie et al., 2019). Conversations about students’ access to mental health care in school settings segue to the role of school counselors and students’ access to school counseling services. School counselors are the most accessible mental health care professionals in schools, with 80.7% of schools employing full-time or part-time school counselors (Lambie et al., 2019). By contrast, only 66.5% employ a school psychologist, and 41.5% employ a school social worker (National Center for Educational Statistics, 2016). Further, school counselors are trained in crisis prevention and responsive services, including individual and group counseling; consultation with administrators, teachers, parents, and professionals; and coordination of services within a multi-tiered system of supports (MTSS; Pincus et al., 2020).
Evidence to support school counselors’ work in times of crisis comes from multiple sources. Salloum and Overstreet (2008) found that a school counselor–led small group implemented after Hurricane Katrina improved PTSD symptoms among elementary school students. Similarly, Udwin and colleagues (2000) found that students who received psychological support at school following a national crisis experienced a reduction in PTSD symptomology. Additionally, scholars have proposed that school counselors utilize their skill set in assessment to administer universal mental health screenings to identify students at greater risk of having or developing mental health concerns (Lambie et al., 2019; Pincus et al., 2020).
Barriers School Counselors Face in the Provision of Services
Although school counselors have the training and skills necessary to assist students transitioning back to school from a disruption like COVID-19, they face multiple barriers to their work. Most notably, they struggle with unmanageable caseloads. The American School Counselor Association (ASCA) recommends that counselor-to-student ratios not exceed 1:250 (ASCA, 2019). Yet, the average ratio in the United States is 1:455, with Tennessee experiencing an average ratio of 1:450 (Patel & Clinedinst, 2021). Research indicates that large school counselor caseloads adversely affect student outcomes, insofar as attendance, graduation, and disciplinary problems are more prevalent in schools with high school counselor caseloads (Parzych et al., 2019). Unfortunately, minority students in under-resourced schools are disproportionately impacted by high counselor ratios (Whitney & Peterson, 2019) and are more likely to experience adverse educational outcomes, as well as unmet mental health needs (Kaffenberger & O’Rorke-Trigiani, 2013). These findings raise concern for students whose mental health and academics have declined since the emergence of COVID-19 who attend schools with overstretched counselors struggling to meet the needs of their student body. This study was conducted in part to explore if caseload correlates to school counselors’ perceived ability to attend to students’ COVID-related problems and if differences were more pronounced in schools with lower socioeconomic status (SES).
In addition to ratios, ASCA recommends that school counselors spend 80% of their time providing direct and indirect services to students. Program elements within direct service include curriculum delivery, individual student planning, and responsive services. Indirect services include referrals to other agencies and programs within and outside the school system and consultation and collaboration with stakeholders, particularly for crisis response (ASCA, 2019). Researchers have documented the favorable effects on student academics and behaviors when school counselors follow these national guidelines for time and role allocations (Cholewa et al., 2015). Nonetheless, school counselors are often assigned non-counseling duties by their campus and district administrators (Gysbers & Henderson, 2012), preventing them from fulfilling their appropriate roles. These duties include test coordination, record keeping, attendance monitoring, substitute teaching, and student discipline (ASCA, 2019). Data indicate that non-counseling duties may be more problematic at the secondary level, with high school counselors over-reporting non-counseling duties, when compared to elementary school counselors (Chandler et al., 2018). Geographic differences have also been documented, with rural school counselors reporting higher levels of non-counseling duties in comparison to urban school counselors (Chandler et al., 2018). In the current study, we were curious to understand the impact of non-counseling duties on school counselors’ response to students’ COVID-19 concerns and to explore the intersection of counselor responsiveness to COVID-19 by non-counseling duties, grade level, and geographic region (e.g., urban, suburban, rural), respectively.
School Responses to COVID-19 in Tennessee
In response to the COVID-19 pandemic, Tennessee’s governor ordered all Tennessee public schools closed from March 20 until March 31, 2020, and extended this closure through the end of the 2019–2020 school year. To complete the school year outside of the physical educational space, districts created their own plans to address student learning, often dependent on available technology and resources (Tennessee Office of the Governor, 2020). Districts made decisions for returning in the fall 2020 semester based on guidelines from the Tennessee Department of Education (DOE), which included social distancing, smaller class size, assigned seats, and alternating in-person days with distance learning (Tennessee DOE, 2020). To provide further context to our survey responses, in 2019, the state DOE (Tennessee State Board of Education, 2017) updated its school counseling policy and standards to require school counselors to spend 80% of their time in direct service to students, a specification consistent with the ASCA National Model for allocation of school counselor time. Although the policy stated counselor ratios should not exceed 1:500 in elementary and 1:350 in secondary schools, this specification falls short of the ASCA 1:250 recommendation. Further, because of the state funding formula that permits school districts to hire administrators in lieu of school counselors, depending on school needs, we expected many of the school counselors would have caseloads that exceeded DOE policy.
Purpose of Study
School counselors are uniquely positioned to assist students with their mental health, including COVID-19–related concerns, in a school context (Pincus et al., 2020). Yet, even before the COVID-19 pandemic, school counseling programs were frequently under-equipped to meet the magnitude of students’ mental health needs (DeKruyf et al., 2013). This study was conducted to understand, from the perspective of school counselors in Tennessee, the ongoing impact of COVID-19 upon students’ mental health, examine strategies they have deployed to assist students, and discover barriers encountered in providing care to meet their students’ needs. Because poor mental health manifests in a plethora of academic, behavior, and social skill adjustment issues for children and adolescents (CDC, 2022), we also examined school counselors’ perceptions of changes in those domains from pre-pandemic to current times. Given documented patterns of variability in school counselor programs, we also investigated school counselors’ perceived barriers to assisting students by location, SES, and assigned non-counseling duties. To address the aim of the study, we posited three related research questions (RQs):
| RQ1: |
How has COVID-19 affected students’ mental health, academics, and social skills in Tennessee? What issues presented the greatest concern, and how did interventions differ by grade level (elementary, middle, or high school)? |
| RQ2: |
What interventions do school counselors in Tennessee use to assist students with their COVID-19–related concerns, and how do interventions differ by grade level (elementary, middle, or high school)? |
| RQ3: |
What barriers do school counselors in Tennessee report as interfering with their ability to address students’ COVID-19 concerns? Do reported barriers differ by grade level (elementary, middle, or high), location (urban, suburban, or rural), socioeconomic status, non-counseling duties, size of caseload (small, medium, or large), or following the state guideline for spending 80% of the time in student services? |
Method
Study Design and Instrumentation
Given the absence of research examining school counselors’ perspectives of how the pandemic has affected student mental health, their response to students’ COVID-19 issues, and barriers encountered in their efforts, we employed an exploratory research design. Exploratory designs are used when there is limited prior research to warrant the examination of a directional hypothesis (Swedberg, 2020). Within the framework of an exploratory design, we developed a non-standardized instrument to answer the three research questions. Although this constitutes a limitation of the study, we endeavored to address validity concerns by following the principles of the tailored design method of survey research (Dillman, 2007). Prior to constructing the survey, we reviewed the extant literature on students’ COVID-19–related issues, school counselors’ roles, and professional issues, in addition to conducting a focus group (N = 7) with school counselors and school counseling supervisors from across the state in which the study was conducted to explore their perceptions in changes to student functioning, strategies they have deployed to assist students, and obstacles they have encountered. Focus group data were used to inform the development of survey items and ensure the instrument covered relevant content. For example, the focus group provided expert insight into the non-counseling duties that are frequently assigned to counselors in the state, as well as the nature of students’ psychological, academic, and behavioral problems witnessed since the onset of COVID-19. Before launching the survey, we piloted the survey with 19 school counselors in Tennessee to elicit feedback about the flow and coverage of the survey. Based on their responses, we added an item addressing universal intervention and edited language on multiple items to align with state-specific terminology (e.g., “MTSS coordination” was expanded to “RTI2B/MTSS/PBIS coordinator” to reflect more state-recognized school counselor titles when operating in these capacities).
The final survey consisted of 64 items in predominantly binary, checkbox, and Likert scale formats. Demographic items were informed by categories outlined by the U.S. Census, the Tennessee DOE, and inclusive practices for data collection (Fernandez et al., 2016). Twenty-one items gathered demographic data related to school counselor characteristics (e.g., age, race, gender), counseling program variables (e.g., caseload, division of time, non-counseling duties, fair-share responsibilities), and school variables (e.g., school level, Title I status, location, staffing patterns). SES was measured using a school’s designated Title I status, with response categories of “yes,” “no,” and “unsure.” Likewise, to determine if school counselors dedicated 80% of their time to direct service, we created a multiple-choice item with the options of “yes,” “no,” and “unsure.” A concise description of the state guidelines was embedded into the survey to promote accurate responses to this item. We gathered data on counselors’ perspectives of their students’ current functioning in areas of mental health, academics, social skills, and behaviors through multiple-choice items with a 5-point range of “much better” to “much worse.” For each area of functioning, school counselors were required to indicate the areas of concern via a checkbox item. Additionally, checkbox items were used to identify school counselors’ strategies to assist students, barriers encountered, and needed resources. As noted, these response categories were based on extant literature and expert input.
Cronbach’s alphas were computed to determine the reliability of the survey items in indicating overall post–COVID-19 functioning of students according to school counselors. These values indicate that these four areas were moderately related with acceptable consistency (α = .653). When making additional comparisons among the four constructs, two areas—behavior and social skills—were found to be more consistent (α = .705; Sheperis et al., 2020). Further, reliability scores likely reflect the exploratory design, which requested participants respond to conceptually related but not converging constructs (e.g., academics, mental health, social skills, and behavior). For example, a change in student academics would not necessarily signify a change in student mental health and vice versa. Thus, participant responses would not necessarily be uniform across items measuring students’ mental health, academics, and social skills, and overall instrument consistency would not be affected in turn.
Participants
We recruited a state-level sample of professional school counselors employed in K–12 public schools in Tennessee. Following the pilot study, in December 2021, we recruited participants through an anonymous Qualtrics link utilizing multiple platforms: the state school counselor association’s listserv, social media, respondent referrals, and dissemination via school counseling supervisors. Participants were eligible to complete the survey if they were currently employed in a K–12 public school in Tennessee. Upon examination of our survey data, we found 276 total responses with 220 complete for a completion rate of 79.7%. Because the survey was distributed through the above-mentioned methods, we were unable to calculate the response rate without knowing how many of the approximately 2,000 public school counselors in Tennessee received the survey. Upon further examination of the survey respondents, we removed one school counseling supervisor; four school counselors whose students were remote/hybrid; and eight school counselors in private, charter, or alternative schools to maintain focus on the experiences of traditional public school counselors working with students in person during the ongoing COVID-19 pandemic for a final sample of 207 participants. An examination of the respondents’ demographics revealed a sample that was predominantly female and White/Caucasian and worked in Title I, suburban, or rural elementary schools. The sample’s mean years serving as a school counselor was 11.7 (SD = 7.5), with mean years at current school of 6.8 (SD = 6.4). See Table 1 for more demographic information. For analysis purposes, we divided the school counselors into three groups by the size of their reported caseload. These categories were informed by a national study of school counselor ratios (National Association of College Admission Counselors, 2019) and consisted of ratios in the range of small (1:100–1:300; 14.0%, n = 29), medium (1:301–1:550; 69.6%, n = 144), and large (1:551 and higher; 15.0%, n = 31).
Table 1
Demographic Characteristics of the Sample
| Characteristic |
n |
% |
| Age |
|
|
| 18–24 years |
3 |
1.4 |
| 25–44 years |
99 |
47.8 |
| 45–64 years |
102 |
49.3 |
| 65 years plus |
3 |
1.4 |
| Race/Ethnicity |
|
|
| Black/African American |
17 |
8.2 |
| Latinx/Hispanic |
1 |
0.5 |
| White/Caucasian |
183 |
88.4 |
| American Indian/Alaskan Native |
1 |
0.5 |
| Other |
5 |
2.4 |
| Gender |
|
|
| Female |
192 |
92.8 |
| Male |
15 |
7.2 |
Note. N = 207.
Data Analysis
We ran a post hoc power analysis using the G*Power 3.1.9.7 statistical software to determine if our sample size was sufficient at the .80 power level with α = .05 and found that a minimum sample size of 100 was required for our analyses. Given our sample size of 207 participants, the power analysis indicated that our sample size was sufficient (Faul et al., 2007). We utilized SPSS version 26 to calculate the following analyses for this study: (a) descriptive statistics; (b) Fisher’s exact test for two dichotomous nominal variables; (c) an extension of Fisher’s exact test, the Freeman-Halton exact test, for one dichotomous nominal variable and one nominal variable with three levels; and (d) point-biserial correlation analysis for one nominal variable and one interval variable (Frey, 2018). We also examined effect size to determine practical importance using the following levels for examining nominal data (Rea & Parker, 1992), precedence for which has been established by complementary studies in educational research (K. Erickson & Quick, 2017; Kotrlik et al., 2011): negligible [0, .1), weak [.1, .2), moderate [.2, .4), relatively strong [.4, .6), strong [.6, .8), and very strong [.8, 1.0). Phi (ϕ) indicates the effect size for the exact tests, and the correlation is the effect size for the point-biserial correlation. We only included statistical analyses that resulted in moderate associations or higher. Three school counselors (1.4%) who reported caseloads that were unusually small (< 100) and outside our specified caseload parameters were removed from the analysis. Additionally, we excluded school counselors who indicated “unsure” in the categories of location (rural, suburban, urban), Title I status, and adherence to state policy for direct service to students. See Table 2 for school characteristics.
Results
Research Question 1
RQ1 examined school counselors’ perspectives of the impact of COVID-19 on students’ mental health, academics, and social skills as well as variation by grade level (elementary, middle, or high school). When asked about the mental health changes they have witnessed in their students post–COVID-19 pandemic, 93.7% (n = 194) of school counselors reported negative changes with 42.5% (n = 88) reporting “much worse” and 51.2% (n = 106) reporting “somewhat worse” changes. Specifically, school counselors reported issues regarding anxiety (92.8%, n = 192), depression (77.3%, n = 160), family dysfunction (71.0%, n = 147), COVID-19–related grief and loss (63.8%, n = 132), technology addiction (52.7%, n = 109), suicidality (50.7%, n = 105), fear of COVID-19 (49.8%, n = 103), substance use issues (21.7%, n = 45), and other issues (12.6%, n = 26) such as separation anxiety, self-harm, and anger. The Freeman-Halton exact test revealed a significant relationship between grade level (n = 183) and depression (p < .001, ϕ = .301) with a moderate positive association, suicidality (p < .001, ϕ = .499) with a relatively strong positive association, and substance use (p < .001, ϕ = .583) with a relatively strong positive association. For depression, 90.0% (n = 54) of high school counselors and 85.7% (n = 36) of middle school counselors reported this issue as compared to 63.0% (n = 51) of elementary school counselors. For suicidality, 76.2% (n = 32) of middle school counselors and 71.7% (n = 43) of high school counselors reported this concern as compared to 23.5% (n = 19) of elementary school counselors. For substance use, 58.3% (n = 35) of high school counselors and 20.0% (n = 8) of middle school counselors reported this concern as compared to 1.2% (n = 1) of elementary school counselors. All other mental health concerns were not significant with grade level.
When queried regarding academic changes post–COVID-19, 90.3% (n = 187) of school counselors reported negative changes to students’ academics with 35.3% (n = 73) reporting “much worse” and 55.1% (n = 114) reporting “somewhat worse” changes. School counselors reported an overall decline across all subjects (80.7%, n = 167). Additionally, school counselors reported non-cognitive factors regarding lack of motivation (84.1%, n = 174), lack of parental support during the school day (75.4%, n = 156), attention issues (71.0%, n = 147), poor mental health (64.7%, n = 134), sleep deprivation (41.1%, n = 85), limited technology during virtual learning (33.3%, n = 69), lack of space to work at home during virtual learning (30.4%, n = 63), poor physical health (17.9%, n = 37), and other (3.9%, n = 8). The Freeman-Halton exact test revealed a significant relationship between grade level (n = 183) and lack of motivation (p = .001, ϕ = .265), poor mental health (p = .001, ϕ = .269), and attention issues (p = .009, ϕ = .232), all with positive moderate associations. For lack of motivation, 96.7% (n = 58) of high school counselors and 88.1% (n = 37) of middle school counselors reported this issue as compared to 75.3% (n = 61) of elementary school counselors. For poor mental health, 78.3% (n = 47) of high school counselors and 69.0% (n = 29) of middle school counselors reported this outcome as compared with 49.4% (n = 40) of elementary school counselors. For attention issues, 79.0% (n = 64) of elementary school counselors and 73.8% (n = 31) of middle school counselors reported concerns as compared to 55.0% (n =33) of high school counselors.
Table 2
School/Program Characteristics
| Characteristic |
n |
% |
| Location |
|
|
| Urban |
31 |
15.0 |
| Suburban |
95 |
45.9 |
| Rural |
72 |
34.8 |
| Unsure |
9 |
4.3 |
| Title I Status |
|
|
| Yes |
121 |
58.5 |
| No |
57 |
27.5 |
| Unsure |
29 |
14.0 |
| Grade Level |
|
|
| Elementary |
81 |
39.1 |
| Middle |
42 |
20.3 |
| High |
60 |
29.0 |
| Other |
24 |
11.6 |
| Follows 80% Direct Service Guideline |
|
|
| Yes |
112 |
54.1 |
| No |
65 |
31.4 |
| Unsure |
30 |
14.5 |
| School Counselor-to-Student Ratio (caseload) |
|
|
| 1:1–1:300 |
29 |
14.0 |
| 1:301–1:550 |
144 |
69.6 |
| 1:551 and higher |
31 |
15.0 |
| Other |
3 |
1.4 |
Note. N = 207
When asked about behavioral changes, 87.4% (n = 181) of school counselors reported negative changes to behaviors with 30.4% (n = 63) reporting “much worse” and 57.0% (n = 118) reporting “moderately worse” changes. Comparably, when asked about social skills changes, 87.0% (n = 180) of school counselors reported negative changes to students’ social skills with 36.2% (n = 75) reporting “much worse” and 50.7% (n = 105) reporting “moderately worse” changes. Specifically, school counselors reported trouble socializing with peers (84.1%, n = 174), absence of social flexibility (58.0 %, n = 120), increase of physical aggression (55.1%, n = 114), increase in relational aggression (50.7%, n = 105), increase in cyberbullying (23.7%, n = 49), increase in bullying (19.3%, n = 40), and other (8.2%, n = 17) such as issues with conflict resolution and preference for technology. The Freeman-Halton exact test revealed a significant relationship between grade level (n = 183) and cyberbullying (p = .003, ϕ = .255), with a moderate positive association with 42.9% (n = 18) of middle school counselors, 23.3% (n = 14) of high school counselors, and 14.8% (n = 12) of elementary school counselors reporting an increase in this area. All other social skills changes were not significant with grade level.
Research Question 2
RQ2 examined the interventions that school counselors used in assisting students with their COVID-19–related concerns and if this differed by grade level. School counselors reported the various supports that they provided to their students who struggled with COVID-19–related issues, including individual counseling (95.7%, n = 198), consultation with parents/teachers (85.5%, n = 177), referrals (80.7%, n = 167), collaboration with other school-based helpers (77.3%, n = 160), coping skills instruction (71.5%, n = 148), group counseling (44.0%, n = 91), universal health screenings (17.9%, n = 37), and other interventions (4.3%, n = 9) such as food programs, holiday donation programs, peer support, and academic support meetings. We used the Freeman-Halton exact test to examine the relationship between grade level (n = 183) and these supports and found that small group counseling (p < .001, ϕ = .405) and coping skills instruction (p = .028, ϕ = .200) were significant, both with moderate positive association. For small group counseling, 63.0% (n = 51) of elementary school counselors and 45.2% (n = 19) of middle school counselors provided this support as compared to 16.7% (n = 10) of high school counselors. For coping skills instruction, 77.8% (n = 63) of elementary school counselors and 71.4% (n = 30) of middle school counselors reported this intervention as compared to 56.7% (n = 34) of high school counselors.
Research Question 3
RQ3 examined the barriers school counselors encountered in their ability to provide services and if this differed by grade level, SES, location, number of non-counseling duties, caseload size, and following the state guideline to spend 80% of time providing student services. When asked if they had encountered barriers to assisting their students with their COVID-19–related needs, 54.6% (n = 113) of school counselors reported that they had experienced barriers, and 45.4% (n = 94) reported that they had not. For those counselors who answered “yes,” barriers included: high caseload (44.4%, n = 92), number of non-counseling duties (20.3%, n = 42), lack of administrator support (12.1%, n = 25), being included on master schedule for guidance classes (10.1%, n = 21), lack of training to address COVID-19 needs (8.2%, n = 17), too much time coordinating the MTSS program (7.7%, n = 16), and other reasons (9.7%, n = 20). Examples of other reasons include students’ attendance, lack of resources (both space and personnel), and focus on academics over mental health. Of note, 47.3% (n = 98) of school counselors reported an increase in non-counseling duties since COVID-19, ranging from a substantial to a slight increase.
We used the Freeman-Halton exact test to examine the aforementioned barriers by grade level (n = 183) and found that being on the master schedule (p < .001, ϕ = .297) was significant with moderate positive association with 19.8% (n = 16) of elementary school counselors reporting this task as compared to 2.4 % (n = 1) of middle school counselors and 1.7% (n = 1) of high school counselors. We used point-biserial correlation analysis to examine how the number of new post–COVID-19 non-counseling duties related to the perceived barriers to providing services to students and found this to be significant (rpb = .211, p = .002) with a positive moderate association. School counselors who reported barriers to providing services had been allocated more non-counseling duties since the pandemic (n = 113, M = 1.22, SD = 1.49) than those who did not report barriers (n = 94, M = .66, SD = 1.04). We used a Freeman-Halton exact test to examine the specific barriers by caseload (n = 204) and found school counselors with a high caseload reported significantly more difficulty in addressing students’ COVID-19–related needs (p < .001, ϕ = .284), with a moderate positive association for large (58.1%, n =18) and medium (47.2%, n = 68) caseloads, as compared to those with a small (10.4%, n = 3) caseload. Investigating the state DOE guideline for 80% of time in service to students (n = 177), excluding those who were unsure, revealed that 63.3% (n = 112) followed the guideline and 36.7% did not (n = 65). We used a Fisher’s exact test to examine the relationship between following the 80% guideline and specific barriers and found that reporting too many non-counseling duties (p < .001, ϕ = -.358) was significant, with a moderate negative association for those who did not follow the guideline (41.5%, n = 27) in comparison to those who did follow the 80% guideline (10.7%, n = 12). All other barriers were not significant with grade level, SES, location, number of non-counseling duties, caseload size, and following the 80% state guideline. We used a Fisher’s exact test to examine SES by Title I (n = 178) classification and found that it was not significant with any of the barriers.
Discussion
Our results render a disturbing picture of students’ post–COVID-19 mental health functioning and school counselors’ perceived ability to effectively meet their students’ needs since a return to in-person learning, as reported by this sample of 207 school counselors in Tennessee. For RQ1, over 93% of our respondents indicated that their students’ mental health had worsened, with anxiety and depression identified as the most pronounced psychological concern, followed by family dysfunction, grief, technology addiction, and suicidality. These results confirm our predictions that the COVID-19 pandemic would exert a harmful impact on the mental health of children and adolescents (Bryant et al., 2020; Cénat & Dalexis, 2020). Depression and suicidality were significant concerns for middle and high school counselors, and substance abuse was significant at the high school level. The reported spike in diagnosable mental health problems by secondary school counselors aligns with research indicating that half of all mental health and substance use disorders begin at 14 (Quinn et al., 2016). The CDC recently reported that depression, substance abuse, and suicide have increased among adult populations since COVID-19, with young adults presenting the most significant risk (Czeisler et al., 2020). Our results provide preliminary evidence indicating that COVID-19–related trends have similarly impacted adolescents. Further, given the relationship between ACEs and substance misuse (CDC, 2022; Quinn et al., 2016), it may be reasonable to conjecture that an increase in family dysfunction, grief, fear of COVID-19, and severance of social relationships underscored a rise in substance use problems, particularly among high school students.
In addition to mental health, student academics notably declined according to school counselors in Tennessee, with 90.3% of participants reporting negative changes to students’ academics. Previous research attributed students’ COVID-19 pandemic–related academic issues to the vagaries of online instruction, a lack of parental supervision, inadequate technology, and limited workspace, among other factors (Ellis et al., 2020; Karaman et al., 2021; Magson et al., 2021). Our results aligned with these findings by explicitly connecting delays in students’ academic progress to psychological factors. Of note, we found a significant relationship between grade level, lack of motivation, poor mental health, and attention issues, with middle and high school counselors reporting greater concerns in the areas of motivation and mental health, and elementary and middle school counselors identifying attention problems as the greatest concern. The developmental onset of mental health disorders (Lambie et al., 2019) likely accounts for increased student mental health problems reported by middle and high school counselors. However, motivation and attentional issues across the grades were problematic, and because both are symptomatic of depression and anxiety, they raise a red flag for the mental health of all K–12 students in Tennessee.
Alongside academics, 87.0% of school counselors reported negative changes in students’ social skills and 87.4% reported worsened behaviors among students, with trouble socializing with peers, absence of social flexibility, and an increase in physical and relational aggression being the most pronounced problems. Declines in students’ ability to get along with peers may be uniquely linked to social isolation during lockdown (Ellis et al., 2020; Karaman et al., 2021); however, of great concern is the increase in all forms of bullying, with cyberbullying being particularly problematic in middle school. Youth aggression is a long-term consequence of ACEs and has implications for overall school safety, with victimization and perpetration both positively associated with school violence (Forster et al., 2020).
RQ2 investigated what interventions school counselors used to assist students with their COVID-19–related concerns and examined interventions by grade level. The preponderance of school counselors relied on individual counseling (95.7%), consultation (85.5%), referrals (80.7%), collaboration with other school-based helpers (77.3%), and coping skills instruction (71.5%), all of which are consistent with crisis-level supports. Nonetheless, only 44% of the sample, primarily elementary school counselors, had used small group counseling, despite its proven efficacy with children exposed to trauma (Salloum & Overstreet, 2008). The underutilization of group work at the high school level presents a concern, given that group work provides context for peer support and social learning, both considered critical therapeutic factors for adolescents (Gysbers & Henderson, 2012). Nonetheless, this finding resonates with previous results that high school counselors are more apt to assume administrative roles in place of the provision of direct student services (Chandler et al., 2018). Universal assessment has been proffered as an efficient and empirically grounded method for the early identification of at-risk students in need of COVID-19–related interventions (A. Erickson & Abel, 2013; Karaman et al., 2021; Pincus et al., 2020). Unfortunately, only 17.9% of the sample reported administering universal mental health screeners, a finding aligned with other studies that indicate schools have resisted adopting mental health screeners because of inadequate resources and related concerns about following up with students identified as being at risk (Burns & Rapee, 2022).
For RQ3, we explored the school counselors’ perspectives of the barriers they have encountered in assisting their students with their COVID-19 concerns. The proliferation of barriers reported by school counselors (high caseload, non-counseling duties, lack of administrator support, being on the master schedule for guidance classes, and a lack of training) verifies our concern that school counselors in Tennessee did not receive the support instrumental to their ability to provide effective student services at this critical time. Our state-level findings resonate with studies conducted in other states that indicate school counselors’ non-counseling duties increased during the pandemic while administrator support declined (Savitz-Romer et al., 2021). Other studies have also drawn attention to widespread staffing shortages associated with COVID-related absences and a reduced pool of substitute teachers (Patterson, 2022). Although we did not examine staff resources explicitly, with almost 50% of our Tennessee sample witnessing an increase in their non-counseling duties, it would be reasonable to infer that campus administrators are deploying school counselors to triage critical gaps in staffing patterns. Interestingly, despite a widespread increase in non-counseling duties post–COVID-19, only 20.3% of counselors reported non-counseling duties as a barrier to providing care. The discrepancy between these two results may be indicative of the phenomenon of role diffusion in school counseling, a problem that emerges when school counselors begin to integrate non-counseling duties as part of their accepted role and thus do not perceive them as antithetical to their professional identity (Astramovich et al., 2013). Furthermore, neither SES (Title I) nor location (rural, suburban, urban) were significant with barriers, and although this could reflect our relatively small sample, it could also be indicative of staff shortages adversely affecting the role of school counselors across all settings, regardless of the school’s demographic status.
The most notable barrier reported by respondents was a large caseload. School counselors with large and medium-sized caseloads reported more barriers and were less likely to follow the 80% guideline. Thus, those students who were negatively impacted by large counselor caseloads before COVID-19 faced further obstacles in accessing their school counseling services despite an overall increase in their mental health and academic needs. Further, elementary school counselors listed on the master schedule for guidance classes faced additional barriers to addressing their students’ needs outside of their prevention-focused (Tier 1) activities. Classroom guidance is considered helpful in elementary school for building social skills and study habits; however, when counselors are placed on the master schedule, it can impact their ability to provide responsive student services (Gysbers & Henderson, 2012) which seemed to be the case with our respondents.
Implications for Professional Advocacy
The results of this study illustrate a decline in student functioning, pronounced in the area of mental health, and have implications for school counselor advocacy in the areas of policy and practice. Advocating for policy change takes time and is beyond the individual efforts of school counselors, who are often beholden to their principal’s limited understanding of school counselors’ appropriate role and function (Lancaster & Reiner, 2022) and subsumed by untenable caseloads in under-resourced schools (Lambie et al., 2019). We, therefore, assert that advocacy is the professional imperative for all vested school counseling professionals (state counseling associations, school counselor educators, school counseling supervisors, and school counselors), all of whom could be working in tandem to advance the profession.
At the policy level, state and national counseling associations should reconsider the important role school counselors play in supporting students’ mental well-being and re-examine policies that delineate the appropriate use of school counselors’ time. Currently, the state school counseling model (Tennessee Policy 5.103) mirrors the national model (ASCA, 2019), perennially focusing on school counselors’ role in supporting student academics and delimiting their counseling role to prevention services, crisis counseling, and referrals to other mental health professionals. For state and national counseling associations, positioning school counselors as primarily focused on student academics demonstrated their value during the No Child Left Behind Act (NCLB; 2001) era, which prioritized unidimensional outcome measures of student success, particularly in math and reading (Savitz-Romer, 2019). However, the Every Student Succeeds Act (ESSA) replaced NCLB in 2015 and emphasizes more holistic aspects of student development and school climate. Many scholars argue that the ESSA (2015) combined with the rise in mental health issues has created a policy window for school counselors, led by their state and national professional associations (Savitz-Romer, 2019), to focus on the non-cognitive aspects that undergird healthy student development and to reclaim mental health as a domain central to school counselor practice (Lambie et al., 2019).
Redefining school counselors’ role in terms of mental health would require them to receive more clinical supervision (Lambie et al., 2019). In comparison to counselors in clinical settings, school counselors receive little to no supervision for their clinical efforts, which affects their clinical identity and weakens their counseling skills over time (Lancaster & Reiner, 2022). To address this gap, symbiotic partnerships could be formed with counselor education programs, particularly those that offer doctoral degrees in counselor education and supervision, to provide clinical supervision to local school counselors. Progress in this area may be forthcoming in the state, as institutions of higher education that operate school counseling, school psychology, and school social work programs have been invited to apply for grants funded through COVID-19 relief funding to support student internships in high-need schools. In addition, funds are available to support clinical supervision experiences that extend beyond students’ graduate training programs (Tennessee DOE, 2023).
MTSS programs also offer a promising prevention and intervention framework for meeting students’ comprehensive needs, including mental health, and align to both state and national school counseling models (Goodman-Scott et al., 2019). Further, the Tennessee DOE (2018) has developed a resource guide based on a tiered model for supporting students’ differential mental health needs, which school counselors could efficiently implement within their existing MTSS programs. Of note, within the Tennessee model, Tier 1 mental health practices build a foundation for mental wellness for all students. Advanced supports at Tiers 2 and 3 provide students who are at risk because of behavioral and/or mental health concerns with access to small groups and mental health interventions. One dimension of the state’s tiered mental health model is universal screening to identify students with internalizing behavioral disorders. Although few counselors in this study utilized universal screening, we recommend school counselors and their supervisors leverage the preexisting Tennessee DOE guidelines to petition their districts to adopt universal mental health screening.
Although the state mandated reduced counselor ratios in 2017 (Policy 5.103.), the funding formula allowed for uneven adoption of this policy (Tennessee Comptroller of the Treasury, n.d.), and target ratios fell short of national recommendations (ASCA, 2019). Thus, a function of this research was to utilize results in policy contexts to advocate for ratio realignments. In partnership with the state school counselor association, we produced a one-page results summary, written in simple language, to disseminate to state politicians to illuminate the acuity of mental health issues faced by K–12 students and proposed a solution through increased school counselor access. An advocacy effort led by the state association resulted in proposed legislation TN HB0364/SB0348, which would require one licensed full-time professional school counselor position for every 250 students and is currently advancing through the state Senate and House committees. A significant takeaway from this study is the importance and potency of coordinated partnerships between researchers, state counseling associations, and school counselors—an alliance that could be replicated in other states by school counselor stakeholders to advocate for the profession.
Limitations
The generalizability of these findings is limited because of the use of a state-level sample and a non-standardized, self-report survey. First, self-report surveys are sensitive to respondents’ tendency to rate themselves more favorably. Thus, it would be reasonable to conjecture that school counselors overestimated their adherence to the state guideline to spend 80% of their time in service to students and underreported their non-counseling duties. Second, although the items were informed by previous research on the psychological issues faced by children and adolescents during COVID-19 (Ellis et al., 2020; Karaman et al., 2021; Magson et al., 2021) and those factors that affect school counselors’ ability to provide direct services (Kaffenberger & O’Rorke-Trigiani, 2013; Parzych et al., 2019; Whitney & Peterson, 2019), the use of an ad hoc survey precluded us from performing more robust analyses (e.g., regression analysis). Third, because we only gathered data on students’ mental health issues and academic functioning post–COVID-19 pandemic, we have no benchmark data of students’ pre–COVID-19 functioning with which to make objective comparisons.
Fourth, although the sample was large enough to find some significant results, it was a small percentage of the state’s total population of public school counselors, which is estimated to be over 2,000. A larger sample would have increased the generalizability of findings and impacted the significance levels and practical importance of the results. Fifth, our sample lacks racial and gender diversity; however, it does align with the state’s overall population of educators (Tennessee DOE, 2021). Finally, regarding data analysis, interpreting correlations on a small population sample needs to be performed cautiously because of the possibility of sampling error. Additionally, point-biserial correlation can be impacted by the dichotomous nature of one of the variables, which constrains the variability of the results (Hinkle et al., 2002). Nonetheless, correlational analyses of ordinal and nominal variables in small-scale research are consistent with our exploratory design, and the results provide evidence that the variables examined share some type of relationship and provide direction for future research.
Future Research
Given that we conducted this study in the aftermath of the COVID-19 pandemic and have utilized data and policy to advocate for expanded student access to school counseling services in Tennessee, this study design could be replicated by future researchers in the event that another pandemic or crisis of similar scale affects K–12 populations. Nonetheless, our exploratory design is an inherent limitation with the preponderance of our findings based on correlational analysis of largely non-parametric data. Future studies could explore dimensions of students’ mental health utilizing student data from empirical inventories. Rather than relying on school counselor perception data, researchers could use results from universal screenings, such as the Behavior Assessment System for Children-3rd edition (BASC-3), to better understand the nature of student issues and examine differential risk by demographic factors (e.g., age, gender, ethnicity), which could be used to inform evidence-based interventions with at-risk and high-risk populations. Further, researchers could employ quasi-experimental designs to assess outcomes of school counselor-led interventions, such as small groups, with students who have scored as being at risk based on universal screening. Studies of this nature can help build a case for the efficacy of school counselors and, in turn, protect them from role misallocation. Qualitative research could also be conducted in those schools in which school counselors implement a universal screening, intervention, and referral system to glean an implementation blueprint practical to other school counselors within and outside the state.
Conclusion
With elevated rates of depression, anxiety, substance use, and bullying, it is reasonable to conjecture that students in Tennessee have experienced COVID-19–related trauma, which according to research is unlikely to abate without intervention (CDC, 2022; Savitz-Romer et al., 2021). Although our state-level respondents indicated that they provided services consistent with crisis counseling (e.g., individual counseling, group counseling, consultation, and referrals), almost 50% of the counselors had been burdened with additional non-counseling duties, which could reduce their capacity to work with students at different levels of risk. Large caseload was a significant barrier, leaving counselors struggling to provide an appropriate level of care. This finding raises considerable concern about the risk faced by students who have experienced deterioration in their mental health and academics since the onset of COVID-19, yet attend schools in Tennessee with elevated school counselor-to-student caseloads. Nationally and at the state level, school counselors are the most prevalent mental health professionals in schools and are trained in crisis response (National Center for Education Statistics, 2016). Unfortunately, Tennessee school counselors appear to be facing barriers in the provision of student services related to high caseload and non-counseling duties, which presents cause for professional advocacy within the state and beyond.
Conflict of Interest and Funding Disclosure
The authors reported no conflict of interest
or funding contributions for the development
of this manuscript.
References
American School Counselor Association. (2019). ASCA national model: A framework for school counseling programs (4th ed.).
Astramovich, R. L., Hoskins, W. J., Gutierrez, A. P., & Bartlett, K. A. (2013). Identifying role diffusion in school counseling. The Professional Counselor, 3(3), 175–184. https://doi.org/10.15241/rla.3.3.175
Bryant, D. J., Oo, M., & Damian, A. J. (2020). The rise of adverse childhood experiences during the COVID-19 pandemic. Psychological Trauma: Theory, Research, Practice, and Policy, 12(S1), S193–S194.
https://doi.org/10.1037/tra0000711
Burns, J. R., & Rapee, R. M. (2022). Barriers to universal mental health screening in schools: The perspective of school psychologists. Journal of Applied School Psychology, 38(3), 1–18.
https://doi.org/10.1080/15377903.2021.1941470
Cénat, J. M., & Dalexis, R. D. (2020). The complex trauma spectrum during the COVID-19 pandemic: A threat for children and adolescents’ physical and mental health. Psychiatry Research, 293, 113473.
https://doi.org/10.1016/j.psychres.2020.113473
Centers for Disease Control and Prevention. (2022, March 31). New CDC data illuminate youth mental health threats during the COVID-19 pandemic [Press release]. https://tinyurl.com/yckv6v9d
Chandler, J. W., Burnham, J. J., Riechel, M. E. K., Dahir, C. A., Stone, C. B., Oliver, D. F., Davis, A. P., & Bledsoe, K. G. (2018). Assessing the counseling and non-counseling roles of school counselors. Journal of School Counseling, 16(7), 1–33. https://files.eric.ed.gov/fulltext/EJ1182095.pdf
Cholewa, B., Burkhardt, C. K., & Hull, M. F. (2015). Are school counselors impacting underrepresented students’ thinking about postsecondary education? A nationally representative study. Professional School Counseling, 19(1), 144–154. https://doi.org/10.5330/1096-2409-19.1.144
Czeisler, M. É., Lane, R. I., Petrosky, E., Wiley, J. F., Christensen, A., Njai, R., Weaver, M. D., Robbins, R., Facer-Childs, E. R., Barger, L. K., Czeisler, C. A., Howard, M. E., & Rajaratnam, S. M. W. (2020). Mental health, substance use, and suicidal ideation during the COVID-19 pandemic. Morbidity & Mortality Weekly Report, 69(32), 1049–1057. https://www.cdc.gov/mmwr/volumes/69/wr/mm6932a1.htm
DeKruyf, L., Auger, R. W., & Trice-Black, S. (2013). The role of school counselors in meeting students’ mental health needs: Examining issues of professional identity. Professional School Counseling, 16(5), 271–282. https://doi.org/10.1177/2156759X0001600502
Dillman, D. A. (2007). Mail and internet surveys: The tailored design method (2nd ed.). Wiley.
Ellis, W. E., Dumas, T. M., & Forbes, L. M. (2020). Physically isolated but socially connected: Psychological adjustment and stress among adolescents during the initial COVID-19 crisis. Canadian Journal of Behavioural Science/Revue canadienne des sciences du comportement, 52(3), 177–187.
https://doi.org/10.1037/cbs0000215
Erickson, A., & Abel, N. R. (2013). A high school counselor’s leadership in providing school-wide screenings for depression and enhancing suicide awareness. Professional School Counseling, 16(5), 283–289.
https://doi.org/10.1177/2156759X1201600501
Erickson, K., & Quick, N. (2017). The profiles of students with significant cognitive disabilities and known hearing loss. The Journal of Deaf Studies & Deaf Education, 22(1), 35–48.
https://doi.org/10.1093/deafed/enw052
Every Student Succeeds Act, Pub. L. No. 114–95 § 114 Stat. 1177 (2015, Dec. 10). https://www.congress.gov/114/plaws/publ95/PLAW-114publ95.pdf
Faul, F., Erdfelder, E., Lang, A.-G., & Buchner, A. (2007). G*Power 3: A flexible statistical power analysis for the social, behavioral, and biomedical sciences. Behavior Research Methods, 39, 175–191.
https://doi.org/10.3758/bf03193146
Fernandez, T., Godwin, A., Doyle, J., Verdin, D., Boone, H., Kirn, A., Benson, L., & Potvin, G. (2016). More comprehensive and inclusive approaches to demographic data collection. School of Engineering Education Graduate Student Series. Paper 60. https://tinyurl.com/2p9p2ct7
Forster, M., Gower, A. L., McMorris, B. J., & Borowsky, I. W. (2020). Adverse childhood experiences and school-based victimization and perpetration. Journal of Interpersonal Violence, 35(3–4), 662–681.
https://doi.org/10.1177/0886260517689885
Frey, B. B. (2018). The SAGE encyclopedia of educational research, measurement, and evaluation. SAGE.
Goodman-Scott, E., Betters-Bubon, J., & Donohue, P. (Eds.). (2019). The school counselor’s guide to multi-tiered systems of support. Routledge.
Gysbers, N. C., & Henderson, P. (2012). Developing and managing your school guidance and counseling program (5th ed.). American Counseling Association.
Hinkle, D. E., Wiersma, W., & Jurs, S. G. (2002). Applied statistics for the behavioral sciences (5th ed.). Houghton Mifflin Company.
Imran, N., Zeshan, M., & Pervaiz, Z. (2020). Mental health considerations for children & adolescents in COVID-19 pandemic. Pakistan Journal of Medical Sciences, 36(COVID19-S4), S67–S72.
https://doi.org/10.12669/pjms.36.COVID19-S4.2759
Kaffenberger, C. J., & O’Rorke-Trigiani, J. (2013). Addressing student mental health needs by providing direct and indirect services and building alliances in the community. Professional School Counseling, 16(5), 323–332. https://doi.org/10.1177/2156759X1201600505
Karaman, M. A., Eşici, H., Tomar, İ. H., & Aliyev, R. (2021). COVID-19: Are school counseling services ready? Students’ psychological symptoms, school counselors’ views, and solutions. Frontiers in Psychology, 12. https://doi.org/10.3389/fpsyg.2021.647740
Kotrlik, J. W., Williams, H. A., & Jabor, M. K. (2011). Reporting and interpreting effect size in quantitative agricultural education research. Journal of Agricultural Education, 52(1), 132–142.
https://doi.org/10.5032/jae.2011.01132
Lambie, G. W., Stickl Haugen, J., Borland, J. R., & Campbell, L. O. (2019). Who took “counseling” out of the role of professional school counselors in the United States? Journal of School-Based Counseling Policy and Evaluation, 1(3), 51–61. https://doi.org/10.25774/7kjb-bt85
Lancaster, C., & Reiner, S. (2022). Supervision in K–12 school settings. In A. S. Lenz & B. Flamez (Eds.), Practical approaches to clinical supervision across settings: Theory, practice, and research (pp. 223–241). Pearson.
Magson, N. R., Freeman, J. Y. A., Rapee, R. M., Richardson, C. E., Oar, E. L., & Fardouly, J. (2021). Risk and protective factors for prospective changes in adolescent mental health during the COVID-19 pandemic. Journal of Youth and Adolescence, 50(1), 44–57. https://doi.org/10.1007/s10964-020-01332-9
National Association for College Admission Counseling. (2019). State-by-state student-to-counselor ratio maps by school district: Data visualizations. https://public.tableau.com/profile/nacac.research#!
National Center for Education Statistics. (2016). National teacher and principal survey. https://nces.ed.gov/surveys/ntps
No Child Left Behind Act of 2001, Pub. L. No. 107–110, 115 Stat. 1425 (2002). https://www.congress.gov/107/plaws/publ110/PLAW-107publ110.htm
Parzych, J. L., Donohue, P., Gaesser, A., & Chiu, M. M. (2019). Measuring the impact of school counselor ratios on student outcomes. ASCA Research Report. https://tinyurl.com/3sbuk5dd
Patel, P., & Clinedinst, M. (2021). State-by-state student-to-counselor ratio maps by school district. National Association for College Admission Counseling. https://files.eric.ed.gov/fulltext/ED615227.pdf
Patterson, J. (2022, March 4). School counselors and social workers struggle to meet student needs. National Education Association Today. https://tinyurl.com/yckwhhc4
Pincus, R., Hannor-Walker, T., Wright, L., & Justice, J. (2020). COVID-19’s effect on students: How school counselors rise to the rescue. NASSP Bulletin, 104(4), 241–256. https://doi.org/10.1177/0192636520975866
Quinn, K., Boone, L., Scheidell, J. D., Mateu-Gelabert, P., McGorray, S. P., Beharie, N., Cottler, L. B., & Khan, M. R. (2016). The relationships of childhood trauma and adulthood prescription pain reliever misuse and injection drug use. Drug and Alcohol Dependence, 169, 190–198. https://doi.org/10.1016/j.drugalcdep.2016.09.021
Rea, L. M., & Parker, R. A. (1992). Designing and conducting survey research: A comprehensive guide. Jossey-Bass.
Salloum, A., & Overstreet, S. (2008). Evaluation of individual and group grief and trauma interventions for children post disaster. Journal of Clinical Child & Adolescent Psychology, 37(3), 495–507.
https://doi.org/10.1080/15374410802148194
Savitz-Romer, M. (2019). Fulfilling the promise: Reimagining school counseling to advance student success. Harvard Education Press.
Savitz-Romer, M., Rowan-Kenyon, H. T., Nicola, T. P., Alexander, E., & Carroll, S. (2021). When the kids are not alright: School counseling in the time of COVID-19. AERA Open, 7. https://doi.org/10.1177/23328584211033600
Sheperis, C., Drummond, R. J., & Jones, K. D. (2020). Assessment procedures for counselors and helping professionals (9th ed.). Pearson.
Swedberg, R. (2020). Exploratory research. In C. Elman, J. Gerring, & J. Mahoney (Eds.), The production of knowledge: Enhancing progress in social science (pp. 17–37). Cambridge University Press.
Tennessee Comptroller of the Treasury. (n.d.). Tennessee basic education program: Handbook for computation. https://tinyurl.com/twazjrut
Tennessee Department of Education. (2018). Tennessee comprehensive school-based mental health resource guide. https://tinyurl.com/2bfetw3t
Tennessee Department of Education. (2020). Reopening schools: Overview guide for LEAs. https://tinyurl.com/2hry8hs6
Tennessee Department of Education. (2021). TDOE, TERA releases 2021 Tennessee Educator Survey results. https://tinyurl.com/523b5hmn
Tennessee Department of Education. (2023). Project RAISE internship opportunities. https://web.cvent.com/event/c34c10c7-31e5-48ec-aaa2-7d343e00af77/websitePage:fa84d4fc-c565-4872-98eb-86552d79a670
Tennessee Office of the Governor. (n.d.). COVID-19 timeline. https://www.tn.gov/governor/covid-19/covid19timeline.html
Tennessee State Board of Education. (2017). School counseling model & standards policy 5.103. https://tinyurl.com/39a7jhyx
Udwin, O., Boyle, S., Yule, W., Bolton, D., & O’Ryan, D. (2000). Risk factors for long-term psychological effects of a disaster experienced in adolescence: Predictors of post traumatic stress disorder. Journal of Child Psychology & Psychiatry, 41(8), 969–979. https://doi.org/10.1111/1469-7610.00685
Whitney, D. G., & Peterson, M. D. (2019, February 11). US national and state-level prevalence of mental health disorders and disparities of mental health care use in children. JAMA Pediatrics, 173(4), 389–391.
https://doi.org/10.1001/jamapediatrics.2018.5399
Zimmer-Gembeck, M. J., & Skinner, E. A. (2011). Review: The development of coping across childhood and adolescence: An integrative review and critique of research. International Journal of Behavioral Development, 35(1), 1–17. https://doi.org/10.1177/0165025410384923
Chloe Lancaster, PhD, is an associate professor at the University of South Florida. Michelle W. Brasfield, EdD, LPSC, is an assistant professor at the University of Memphis. Correspondence may be addressed to Chloe Lancaster, 422 E. Fowler Ave, EDU 105, Tampa, FL 33620, clancaster2@usf.edu.
Aug 24, 2023 | Volume 13 - Issue 2
Amy Biang, Clare Merlin-Knoblich, Stella Y. Kim
Although researchers have found that patient weight bias negatively impacts health care professionals, research is limited on client weight bias toward counselors. Given that a client’s perception of their counselor impacts the therapeutic alliance, more research is needed to understand client weight bias toward counselors. To fill this research gap, we conducted a quasi-experimental study examining people’s weight bias toward a hypothetical counselor who was overweight, average weight, or underweight. Participants (N = 189) received a random assignment to a questionnaire featuring one of the three hypothetical counselors. Participants indicated their willingness to trust them, select them as a counselor, and follow their counsel. Results from a Welch ANOVA analysis showed a statistically significantly greater preference for average-weight and overweight counselors than those who are underweight. Additionally, the participants were less willing to follow counsel from overweight and underweight counselors. Implications for counselors are discussed.
Keywords: client weight bias, overweight, underweight, average weight, counselors
Body weight can inform a client’s perception of a health professional’s level of authority, trust, and competence (Hutson, 2013; Schwartz et al., 2006). Researchers have found that overweight bias toward health professionals like fitness instructors and medical physicians results in negative impressions (Hutson, 2013; Puhl et al., 2013; Puhl & Heuer, 2010). Clients may perceive lower competence, conscientiousness, personal grooming, and intrapersonal ability for overweight individuals compared to average-weight ones (Allison & Lee, 2015). When people seek mental health treatment, these perceptions may hinder their selection of a counselor who is perceived as overweight. Additionally, research on underweight bias has emerged that shows adverse outcomes toward underweight individuals (Allison & Lee, 2015; Beggan & DeAngelis, 2015; Davies et al., 2020a). Despite research on overweight and underweight bias in health professionals, limited research on either topic exists in the counseling profession.
Research on weight bias is necessary for counseling given that counselor attributes have the potential to be an integral part of a client’s decision-making and change process (Hauser & Hays, 2010). Attributes of a counselor that may affect client impressions, such as attractiveness (Grimes & Murdock, 1989) or race (Kim & Kang, 2018; Meyer & Zane, 2013), illuminate the social influence process of counseling (McKee & Smouse, 1983). Social influence is pervasive in the judgments of people everywhere. Weight bias continues to be a product of social influence and, as such, weaves stereotypes into the minds of those who consume the message of weight as a moral indiscretion (Beggan & DeAngelis, 2015). As clients search for, build trust with, and consider life changes with a counselor, weight bias ought to be explored as a potential issue for counselors.
In the past 35 years, researchers published only one study about weight perceptions toward overweight counselors (Moller & Tischner, 2019). Furthermore, there were no published studies about underweight counselors found. This gap in research is notable, as body weight can influence clients’ first impressions of a counselor and their expectations of the ensuing relationship (Moller & Tischner, 2019). Understanding how weight bias may impact this relationship is vital to building an authentic therapeutic relationship, which may otherwise be hindered by weight bias, which inaccurately frames a counselor’s competence (McKee & Smouse, 1983). Thus, we examined client weight bias toward overweight, underweight, and average-weight counselors in the current study.
Literature Review
Weight Bias
The term weight bias indicates a negative attitude about the perceived weight of an individual (Christensen, 2021). Historically, weight bias has been directed at people perceived as overweight; however, recent evidence suggests that underweight bodies generate weight bias as well (Allison & Lee, 2015; Beggan & DeAngelis, 2015; Christensen, 2021; Davies et al., 2020a, 2020b). Weight bias is pervasive throughout the United States (McHugh & Kasardo, 2012; Puhl et al., 2014). Negative stereotypes associated with being overweight include laziness, lack of motivation, psychological instability, social rejection, and incompetence in the workforce (Hinman et al., 2015; Lewis et al., 1997; Moller & Tischner, 2019). Likewise, incorrect stereotypes about underweight people include psychological instability or weakness (Marini, 2017). Body weight is not explicitly identified as an issue in the multicultural and social justice competencies (Ratts et al., 2016). However, weight bias is similar to sexism, racism, and classism in its harmful impact on people (Bucchianeri et al., 2013). It is still a common form of prejudice (McHugh & Kasardo, 2012).
Weight bias has become a social justice issue because of how it negatively impacts the lived experiences of people across social contexts (Nutter et al., 2018). Similar to other identities that elicit prejudice, weight bias impacts an individual’s opportunities in the workforce (Hutson, 2013), quality of mental health care (Puhl et al., 2014), and interpersonal relationships (Puhl & Heuer, 2010). Oppression from weight bias may deter a person from forming relationships or making connections with others out of fear of rejection or discrimination based on weight. Likewise, a person with weight bias may struggle to overlook the body of their counselor because of their worldview of weight and health. Even if the client remains in counseling, this initial bias may impede the therapeutic alliance process.
Therapeutic Alliance
The therapeutic alliance is a key variable in predicting client outcomes in counseling (Ackerman & Hilsenroth, 2001). This alliance represents the degree to which the client and counselor are engaged in collaboration, their commitment to one another, and their understanding of the counseling process (Allen et al., 2017; Lorr, 1965). Clients are as important as counselors in building this alliance, which involves their impression of and reaction to the counselor (Tudor, 2011). Disruptions in the therapeutic alliance can be generated from the client’s adverse reaction to the counselor, which thus impacts client outcomes (Ackerman & Hilsenroth, 2001). Weight can be a disruption, as some clients see a counselor being overweight as a barrier to opening up and engaging in counseling (Moller & Tischner, 2019). As the therapeutic alliance impacts clients remaining in counseling (Sharf et al., 2010), biases toward the counselor may hinder building the relationship, leading to early termination. Clients discriminating against counselors may limit capable counselors who fall outside socially acceptable weights from co-building the therapeutic alliance (McKee & Smouse, 1983).
Even with weight bias possibly diminishing the initial therapeutic relationship, Allen et al. (2017) found that communication on tasks/goals was a predictor of a strong therapeutic alliance and activation (i.e., the clients’ readiness and willingness to take on the management of their mental health care). Allen et al. found that alliance around the tasks/goals of therapy had long-term benefits, while an initial therapeutic bond was only associated with activation at the beginning of therapy. These findings suggest that despite client bias, a strong alliance may still form if there is a connection between counselor and client on their treatment goals and plan.
Despite a client and counselor’s mutual investment in a counseling relationship, research about weight bias in counseling has focused solely on counselors’ perceptions of clients’ weight and its influence on the therapeutic alliance (Kinavey & Cool, 2019; McHugh & Kasardo, 2012; Puhl et al., 2014). Thus, research has insufficiently examined how a counselor’s weight may hinder this alliance (Moller & Tischner, 2019). This gap is further concerning given that researchers have found that professionals in other disciplines identified as overweight or underweight face discrimination in the workplace (Beggan & DeAngelis, 2015; Hutson, 2013).
Overweight Bias Toward Counselors
Researchers have found that counselors are subject to weight bias from clients. Moller and Tischner (2019) examined client perceptions of counselors by specifically examining counselor weight. They conducted a qualitative story completion task with students from Great Britain aged 15–24 (N = 203) and found that participants perceived overweight counselors as incompetent. Counselors’ competence came into question because of the perception that being overweight implies a lack of emotional stability, personal discipline, and mental stability (Moller & Tischner, 2019). Participants also reported perceiving overweight counselors as distracting because of their physical appearance. Additionally, participants viewed an overweight counselor as having poor psychological health. Some participants noted that being overweight suggested an eating disorder (ED), such as bulimia or binge eating disorder. Furthermore, responses indicated that weight bias would impact the therapeutic relationship, and many participants would not want to work with an overweight counselor (Moller & Tischner, 2019).
These results are striking, and further research is needed to corroborate their value, as they point to a high level of bias toward overweight counselors. These types of inaccuracies can perpetuate prejudice and discrimination that may also hurt potential clients who would otherwise not have access to a counselor. Stereotypes and biases impact those who choose to work in this profession and could struggle to feel they belong in the helping professions.
Underweight Bias
Research geared toward overweight bias is well established in the health professions; however, evidence suggests that underweight health professionals also experience bias and discrimination (Allison & Lee, 2015; Beggan & DeAngelis, 2015; Davies et al., 2020a, 2020b). Researchers have noted stereotypes suggesting that extreme thinness may indicate a lack of wellness or the presence of a mental health issue like anorexia (Davies et al., 2020a). Furthermore, implicit bias toward underweight people may also come from the survival instinct that hunger, poverty, and war create underfed people, and we want to be with those who can help us survive (Marini, 2017).
Interestingly, scholars have noted that if being underweight is not perceived as stemming from health issues or an ED, people possess more favoritism toward underweight persons, limiting institutional discrimination toward them (Allison & Lee, 2015; Beggan & DeAngelis, 2015). In some social settings, a slender appearance of health follows socially accepted norms and may supersede the importance of actual health (Moller & Tischner, 2019). This leads to what is known as thin privilege; hence the possibility that there is enough benefit to being thin that it negates any negative attitudes or behaviors by others.
This thin privilege allows others to overstep the concept of civil inattention, which is how people are recognized appropriately in polite society. Civil inattention warrants people to be discrete in commenting on or noticing differences among those around them (e.g., those with disabilities, obesity, low socioeconomic status, or other marginalized identities). Some people believe that being underweight may invite a breakdown of civil inattention (Beggan & DeAngelis, 2015). This breakdown may lead a client to comment on a counselor’s body, such as “You are so skinny; how can you understand anything I am feeling about my body” or “If I were as thin as you, I would…” These types of comments are seen as acceptable because they infer a compliment about a socially desirable attribute. However, they can invite feelings of judgment and unease for the counselor, perpetuating a rupture in the therapeutic alliance. As we continue to understand that weight bias exists along a spectrum, counselors may feel prepared to broach the topic of weight regardless of where they fall.
One last finding that significantly impacts weight bias toward counselors comes from a qualitative study of adults (N = 18) with an average female body mass index (BMI) of 18.80 or male BMI of 21.68, both of which fall within the normal range of 18.5 to 24.9 (Centers for Disease Control and Prevention [CDC], 2022). Beggan and DeAngelis (2015) found that participants believed that underweight people lack empathy for others who struggle with weight. Such a belief would be impactful for a counselor, given that empathy is integral for a successful counseling relationship (Clark, 2010).
Empathy
Empathy is one of the six core conditions necessary for client change and contributes significantly to therapeutic outcomes. Clients can perceive empathy from counselors when counselors act in ways consistent with their frame of reference (Feller & Cottone, 2003).
Empathy is a deep understanding of the client’s circumstances. When there is weight bias, the client may not believe their counselor can understand their frame of reference if they are of differing body weights, especially if the client is coming in for body image concerns or health concerns. Even though the counselor has empathy, the client may not accept this as truth, hindering the building of a solid therapeutic alliance.
Weight as Credibility
Whether professionals are overweight or underweight, their bodies are part of their résumé. The term bodily capital describes one’s credibility as portrayed by the body and can influence how professionals are judged by their physical appearance (Hutson, 2013; Moller & Tischner, 2019). The body can be viewed as a symbolic container that indicates the investment of time and resources into health and well-being (Hutson, 2013). Previous scholars have asserted that the healthier a professional appears, the more likely clients and patients will accept their advice and trust their counsel (Hutson, 2013; Puhl et al., 2013). Health expectations are amplified for health professionals, as overweightness can be seen by some as a moral transgression and an inadequacy that may translate into their work (Beggan & DeAngelis, 2015). Some people believe that to be psychologically healthy, a person must appear to be of an appropriate weight; this indicates willpower, discipline, and self-control (Tischner, 2019). Though these ideas are inaccurate for psychological health, they may influence how clients see counselors on the far ends of the weight spectrum.
Antifat Attitudes
Antifat attitudes are a different but related construct to weight bias. An antifat attitude is “a negative attitude toward (dislike of), belief about (stereotype), or behavior against (discrimination) people perceived as being ‘fat’” (Meadows & Daníelsdóttir, 2016, p. 47). Weight bias refers to a negative attitude toward any size body (Christensen, 2021), whereas antifat attitudes describe dislike and discrimination toward people perceived as overweight (Meadows & Daníelsdóttir, 2016). Antifat attitudes have created a marginalized group that faces external stigma throughout society, with some individuals feeling internal stigma due to personal experiences.
Despite encounters with prejudice, some clients who are overweight will still prefer an average-weight counselor because of their own bias toward being overweight (Moller & Tischner, 2019) and will have similar antifat attitudes as average-weight individuals (Schwartz et al., 2006). Contingencies of self-worth encompass the domains in a person’s life that create self-esteem (Clabaugh et al., 2008). When body weight is a domain, success or failure in their ability to lose or gain weight can lead to lower self-worth. Because of weight bias, working with a counselor who mirrors the client’s undesired body weight may impact the client’s willingness to work with the counselor. Examining weight bias across the spectrum and correlating BMI with antifat attitudes will give us further insight into these findings and if they influence client bias toward counselors.
Purpose of the Study
This study examined if client weight bias influences a client’s trust in a counselor’s competence, willingness to follow a counselor’s advice, and desire to select a counselor for therapy. We further examined if a client’s antifat attitudes are associated with their weight bias toward counselors. The following research questions guided this study: 1) Does a counselor’s weight impact a client’s decision to trust, follow advice, and select the counselor? 2) Is there an association between a client’s antifat attitudes and weight bias toward counselors? 3) Are there differences in weight bias toward counselors based on the socio-demographics of the clients using their services? and 4) Do participants with eating disorders have similar perceptions of counselors due to weight bias as those without eating disorders?
Methodology
Recruitment
At the time the research was conducted, the researchers—Amy Biang, Clare Merlin-Knoblich, and Stella Kim—were affiliated with the same university; as such, IRB approval was obtained from that university before recruiting participants. People were eligible to participate in this study if they were 18 years or older and signed an electronic consent form indicating their willingness to participate. We recruited participants through purposive and snowball sampling in three ways. First, Biang emailed a compiled database of counseling professionals within their acquaintance to request they send the survey to previous clients in an effort to obtain sufficient participation from people who have received counseling. In addition, requested participation through two research boards of counseling associations (Academy of Eating Disorders and International Association of Eating Disorder Professionals) allowed us to recruit sufficient participation from previous clients with EDs, as well as other diagnoses, as we requested they send the survey to their former clients. Second, to obtain participation from people with and without experience in counseling, Biang posted calls for participation on social media accounts (i.e., Instagram and Facebook). Third, to further increase participation, Merlin-Knoblich forwarded a participation request to their university’s counseling program listserv. After 2 weeks of data collection, we sent a second follow-up call for participation and then continued data collection for an additional week.
To prevent recruitment bias and confirmation bias during data collection, we omitted the terms weight and weight bias and modified the study title to read “Counselor Attributes that Impact Client’s Selection, Trust, and Advice Following.” The call for participation informed potential participants that we were conducting a study about the attributes of a hypothetical counselor. The end of the questionnaire contained a full disclosure of the study’s purpose. Of the 255 participants who began the study questionnaire, 189 completed the study, representing a 74% completion rate. No data was collected from the 66 non-completers other than an average of 76 seconds with the survey open before ending the survey.
Participants
A sample of 189 participants from 26 states participated in the study. Table 1 presents a summary of the sample characteristics. The majority of participants were from North Carolina (n = 72, 38%),
Ohio (n = 23, 12%), California (n = 19, 10%), Utah (n = 11, 6%), and New York (n = 10, 5%). Participants primarily identified as female (n = 158, 84%). The majority of participants identified as White (n = 153, 81.4%), with other participants identifying as Asian (n = 13, 6.9%), Black/African American (n = 12, 6.4%), Latine/Hispanic (n = 5, 2.7%), and American Indian (n = 3, 1.6%). The majority of participants were over the age of 30 (n = 139, 74%), more than half had previously participated in personal counseling (n = 135, 71.8%), and just over a quarter indicated a previous ED diagnosis (n = 52, 27.7%).
Given the focus of this study, all participants were asked to indicate their height and weight but were informed that such information (like all demographic information) was optional to submit. One hundred and eighty-four participants (97%) shared their height and weight, from which we calculated their BMI—a person’s weight in kilograms divided by the square of height in meters. The mean BMI was 28 (SD = 6.8) among the participants who shared their height and weight. This BMI is designated as “overweight” by the CDC (2022).
Study Design and Instrumentation
Physician Weight Survey Revised
We used a quasi-experimental research design in this study. With permission from Puhl and colleagues (2013), we revised the Physician Weight Survey (PWS), a 44-item questionnaire designed to assess patient weight bias of physicians who are obese, overweight, or seen as average weight. The instrument measures five constructs: physician health behaviors, physician selection, physician compassion, physician trust, and adherence to physician advice. Cronbach’s alpha tests instrument reliability and the internal consistency of the questions on a scale. Alpha scores over .70 are considered acceptable (Taber, 2018). Each subscale of the PWS has demonstrated sufficient internal consistency, with a Cronbach’s alpha of at least .90 (Puhl et al., 2013).
We adapted the questionnaire to address participants’ willingness to trust, follow the advice of, and select a hypothetical counselor based on the weight of that counselor. We replaced the term, physician with counselor and added the underweight category instead of the obese category. Using the underweight category allowed for consideration that weight bias exists on both ends of the weight spectrum. Because
of differences in occupational responsibilities and limiting the dependent variables of our study, we did not use the subscales for health behaviors or compassion. The Health Behavior subscale incorporated the physicians’ use of substances, health screenings, and illness prevention. The Compassion subscale measured the physician’s bedside manner. Without those two additional subscales, our revised measure had 23 items.
Table 1
Participant Demographic Data
| Demographics |
n |
% |
| Gender |
|
|
| Female |
158 |
84.0 |
| Male |
27 |
14.4 |
| Non-Binary |
1 |
0.05 |
| Race/Ethnicity |
|
|
| White |
153 |
81.4 |
| Black/African American |
12 |
6.4 |
| Latine/Hispanic |
5 |
2.7 |
| Asian |
13 |
6.9 |
| American Indian |
3 |
1.6 |
| Age Range |
|
|
| 18–29 |
48 |
25.6 |
| 30–42 |
64 |
34.1 |
| 43 and older |
74 |
39.4 |
| Prior History of Counseling |
|
|
| Yes |
135 |
71.8 |
| No |
51 |
27.1 |
| Prior History of Eating Disorder |
|
|
| Yes |
52 |
27.7 |
| No |
134 |
74.3 |
| BMI Range |
|
|
| Underweight |
4 |
2.1 |
| Average |
64 |
34.0 |
| Overweight |
54 |
28.7 |
| Obese |
60 |
31.9 |
Note. N = 189.
The subscales of Counselor Trust and Counselor Selection align well with our study. The subscale of Advice Following may seem counterintuitive when used with the counseling profession. The term advice equates to the construct of counseling together and incorporates the concept of counselors helping clients create and follow treatment goals, exploring ideas together for change, and even assigning homework. Advice aligns with how clients perceive what counselors do rather than the skills they use. For example, counselors using motivational interviewing and questions such as “What would it take for you to go from a 2 to a 4 in your willingness to reduce your alcohol consumption?” can be seen as advising clients to reduce their alcohol consumption. We chose to use the term advice instead of counsel so all participants, regardless of their experience with counseling, would understand the questions.
Parallel to Puhl and colleagues’ (2013) study, we then created three different versions of the questionnaire. Using Qualtrics, an electronic survey platform, consenting participants received a random assignment to one of three questionnaire versions. Seventy (37%) of the study participants completed the first version of the questionnaire, which described a hypothetical counselor as an overweight counselor. Fifty-eight (31%) participants completed the second questionnaire version, which described a hypothetical counselor as having average weight. And 61 (32%) of the participants completed the third version of the questionnaire, which described a hypothetical counselor as underweight. Participants responded to all items on a Likert scale ranging from 1 (strongly disagree/extremely unlikely) to 7 (strongly agree/extremely likely), with seven questions reverse scored.
Counselor Trust Subscale. The Counselor Trust subscale of the revised PWS consisted of nine questions focused on skills and competence (e.g., “If my counselor was [overweight/underweight/average weight], I would not trust them,” and “If my counselor was [overweight/underweight/average weight], I would have doubts about their credibility”). Other questions focused on believing the counselor would listen or understand their needs (e.g., “I believe an [overweight/underweight/average weight] counselor would listen carefully to what I have to say”). The scale demonstrated good internal consistency (α = .81) with this sample. Higher scores reflect greater trust in the counselor.
Counselor Advice Following Subscale. The Advice Following subscale contained six items. These items indicated making changes to diet, losing weight, and advice in general (e.g., “In general, my counselor’s weight affects whether I listen to their advice” and “If my counselor were [overweight/underweight/average weight], I would feel embarrassed when talking about losing weight”). Though counselors are not medical doctors, many clients explore topics associated with their bodies, exercise, and overall physical health (e.g., sleep issues, pain management, substance use, and daily routines), indicating relevance to counseling for the survey questions. Higher scores suggest more willingness to follow the advice (counsel) of the counselor. Cronbach’s alpha for this scale was .83 with this sample.
Counselor Selection Subscale. The Counselor Selection subscale had seven items indicating a willingness to select the counselor based on their appearance of weight (e.g., “If I went to a new counselor, and the counselor appeared [overweight/underweight/average weight], I would change counselors,” or “If my counselor was [overweight/underweight/average weight], I would not recommend them to my friends”). Similar to the other subscales, higher scores indicate more willingness to select the counselor. For this sample, Cronbach’s alpha was .71.
Antifat Attitudes Questionnaire
In addition to the revised PWS, participants completed the Antifat Attitudes Questionnaire (AFA; Crandall, 1994). The AFA assesses participants’ beliefs about overweight people and their feelings about becoming overweight. Three subscales, Dislike (α = .84), Fear of Fat (α = .79), and Willpower (α = .66), are combined for a composite antifat attitude score. Despite the low Cronbach’s alpha coefficient for the Willpower subscale, it positively correlates with the Dislike subscale (r = .43, p < .001), whereas the Fear of Fat subscale remains uncorrelated with both subscales, suggesting discriminate validity (Lacroix et al., 2017; Ruggs et al., 2010). Both the reliability and validity of the AFA have been extensively assessed by researchers, and the AFA has been found to be a psychometrically sound measure (Ruggs et al., 2010). The Cronbach’s alpha internal consistency reliability was acceptable, with a value of .87 for the data used in the current study. Participants indicated agreement (e.g., “I really don’t like fat people much”) on a Likert scale ranging from 1 (strongly disagree) to 7 (strongly agree), with higher composite scores suggesting stronger negative antifat attitudes. Higher scores may correlate to weight bias toward the overweight counselor. Scores on the Fear of Fat subscale are directed toward a personal antifat fear and not toward others.
The AFA was also used to test the equivalence of groups and any effect of social desirability. Lastly, participants completed a voluntary 8-item demographic questionnaire describing their race/ethnicity, age, gender, height, weight, and experience with receiving counseling or having an ED.
Data Analysis
We conducted all analyses using SPSS Version 27. The first analysis had the four dependent variables of Counselor Trust, Counselor Selection, Advice Following, and Weight Bias, with the independent variable of Weight (overweight, underweight, and average weight). We conducted a series of assumption-checking procedures to draw valid interpretations of the findings. Engaging the Shapiro-Wilk test as a test of normality yielded a significant result (W = 0.92, p < .001) for the overweight counselor, indicating the sample was not normally distributed. After removing outliers, the sample for the overweight survey condition did not meet the assumption of normality. A test for homogeneity of variance yielded a statistically significant Levine’s score of F(2, 168) = .46, p = .013; degrees of freedom were adjusted due to unequal sample sizes for each survey condition.
Conducting a MANOVA yielded statistically significant results; however, not meeting the assumptions of multivariate normality and homogeneity of variance required, we used the Welch ANOVA, which is recommended for non-normal distributions. Using a Welch ANOVA is also a best practice when the homogeneity of variances test fails; it controls the type I error and gives more power in many instances (Liu, 2015). Although a parametric test such as a typical ANOVA or MANOVA is known to be more powerful than a non-parametric test (e.g., Welch ANOVA), it can lead to erroneous results if required assumptions are not satisfactorily met (Zar, 1998). Considering unequal variances and sample sizes across groups, we used Games-Howell for post hoc testing. We used G*Power version 3.1.9.7 (Faul et al., 2007) to perform the power analysis. For the Welch ANOVA test, the minimum sample size was 157, with a medium effect size of .25, a desired statistical power level of .8, and an alpha level of .05. Lastly, we measured the effect size using partial eta squared (ꞃ²), showing the strength of association as a proportion of variance in the dependent variable explained by group membership (Coladarci et al., 2011).
Table 2
Descriptive Statistics for Outcome Variables
|
n |
Mean |
Std.
Deviation |
Std. Error |
95% Confidence Interval for Mean |
Minimum |
Maximum |
| Lower Bound |
Upper Bound |
| Trust |
OW |
70 |
49.70 |
9.89 |
1.18 |
47.34 |
52.06 |
16.00 |
63.00 |
| UW |
59 |
41.15 |
10.72 |
1.40 |
38.36 |
43.95 |
17.00 |
63.00 |
| AW |
60 |
47.48 |
7.75 |
1.00 |
45.48 |
49.49 |
29.00 |
63.00 |
| Total |
189 |
46.33 |
10.16 |
0.74 |
44.87 |
47.79 |
16.00 |
63.00 |
| Selection |
OW |
70 |
32.41 |
5.40 |
0.64 |
31.13 |
33.70 |
19.00 |
40.00 |
| UW |
59 |
30.00 |
5.12 |
0.67 |
28.67 |
31.33 |
21.00 |
40.00 |
| AW |
60 |
31.42 |
4.92 |
0.63 |
30.15 |
32.69 |
16.00 |
40.00 |
| Total |
189 |
31.34 |
5.23 |
0.38 |
30.59 |
32.09 |
16.00 |
40.00 |
| Advice |
OW |
70 |
25.76 |
8.72 |
1.04 |
23.68 |
27.84 |
8.00 |
42.00 |
| UW |
59 |
24.73 |
7.33 |
0.95 |
22.82 |
26.64 |
8.00 |
42.00 |
| AW |
60 |
31.93 |
4.64 |
0.60 |
30.73 |
33.13 |
23.00 |
42.00 |
| Total |
189 |
27.40 |
7.81 |
0.57 |
26.28 |
28.52 |
8.00 |
42.00 |
| Note. OW = overweight; UW = underweight; AW = average weight. |
In the second data analysis, we used the Pearson correlation to assess an association between data sets from the AFA and Composite Weight Bias. Composite Weight Bias was calculated by summing the scales of the revised PWS. Before computing a correlation, we examined the scatter plot between the independent and dependent variables to check the linearity between the two variables and the existence of outliers. We found less than three outliers on all four graphs and identified negative linearity. Using G*Power (Faul et al., 2007), we obtained the estimated sample size necessary to run the correlation analysis, which was 64 with a medium effect size of .3, an alpha level of .05, and power of .8. Lastly, we explored the relationships between demographics and weight bias toward counselors using a one-way ANOVA or an independent t-test. We selected statistical methods based on the number of categories of each demographic variable. See Table 2 for descriptive statistics of the outcome variables.
Results
Areas of Trust, Advice, and Selection
We found significantly different levels of trust, advice following, and counselor selection behaviors among participants assigned to hypothetical counselors of different weights.
Welch ANOVA test results indicated a statistical significance in all three areas between groups, F(2, 120.60) = 12.89, p < .001 with a medium effect size (ꞃ² = .11). Post hoc comparisons using Games-Howell showed the following results at the significance level of α = .05. Counselor Trust for average-weight counselors (M = 47.48, SD = 7.75) was significantly higher than Counselor Trust for underweight counselors (M = 41.15, SD = 10.72) at p = .001. Counselor Trust of overweight counselors (M = 49.70, SD = 9.89) was also significantly higher than Counselor Trust for underweight counselors at p < .001. There was no statistical significance for Counselor Trust between average and overweight counselors. Advice Following for average-weight counselors (M = 31.93, SD = 4.65) was significantly higher than Advice Following for underweight counselors (M = 24.72, SD = 7.28) and Advice Following for overweight counselors (M = 25.75, SD = 8.72) at p < .001 for both. Finally, Counselor Selection for an overweight counselor (M = 32.41, SD = 5.73) was statistically higher than Counselor Selection for an underweight counselor (M = 30.00, SD = 5.59) with p = .028. There was no statistical significance in the Counselor Selection of average-weight counselors (M = 31.41, SD = 4.91) compared to overweight or underweight counselors. See Table 3 and Figures 1–3.
Next, we conducted a Welch ANOVA between overall composite scores and the three weight groups (see Table 4). Again, Welch test results indicated a statistical significance between groups, F(2, 118.73) = 11.71, p < .001 with a medium effect size (² = .10). Post hoc comparisons using Games-Howell showed statistical significance between overweight counselors (M = 107.87, SD = 21.68) and underweight counselors (M = 95.88, SD = 20.00). Underweight counselors were also significantly lower on the overall composite than average-weight counselors (M = 110.83, SD = 19.97). There was no statistical significance between overweight and average-weight counselors for their overall composite scores, which include all three variables.
Figure 1
Willingness to Trust Counselor
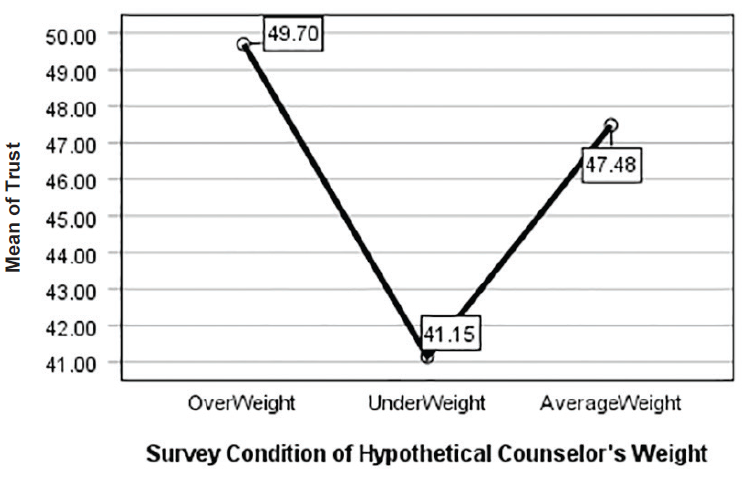
Figure 2
Willingness to Select Counselor
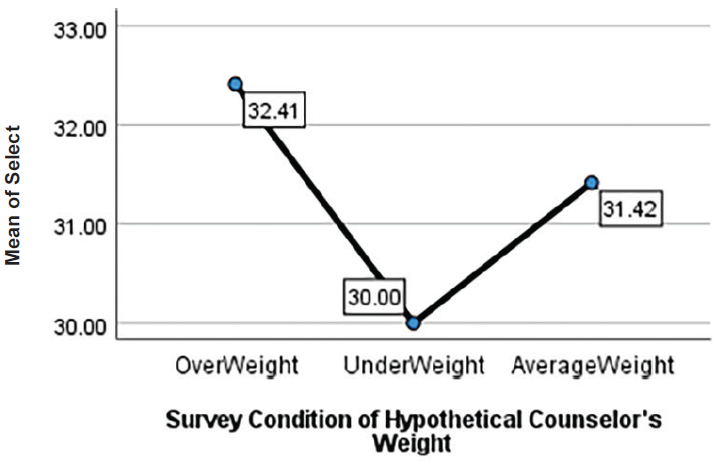
Figure 3
Following Counselor Advice
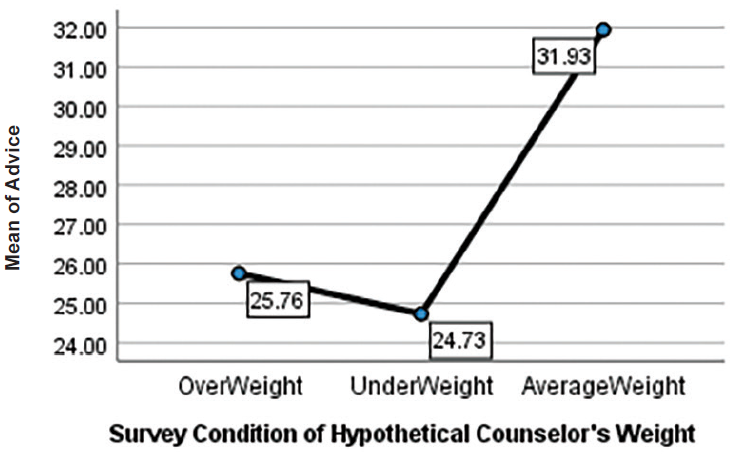
Table 3
Post Hoc Outcome Variables
|
| Dependent Variable |
Mean Difference (I-J) |
Std. Error |
Sig. |
95% Confidence Interval |
| Lower Bound |
Upper Bound |
| Trust |
OW |
UW |
8.547a |
1.829 |
0.00 |
4.206 |
12.888 |
| AW |
2.216 |
1.548 |
0.32 |
−1.456 |
5.889 |
| UW |
OW |
−8.547a |
1.829 |
0.00 |
−12.888 |
−4.206 |
| AW |
−6.330a |
1.717 |
0.00 |
−10.414 |
−2.247 |
| AW |
OW |
−2.216 |
1.548 |
0.32 |
−5.889 |
1.456 |
| UW |
6.330a |
1.717 |
0.00 |
2.247 |
10.414 |
| Selection |
OW |
UW |
2.414a |
0.927 |
0.02 |
0.215 |
4.613 |
| AW |
0.997 |
0.904 |
0.51 |
−1.144 |
3.143 |
| UW |
OW |
−2.414a |
0.927 |
0.02 |
−4.613 |
−0.215 |
| AW |
−1.416 |
0.920 |
0.27 |
−3.601 |
0.767 |
| AW |
OW |
−0.997 |
0.904 |
0.51 |
−3.143 |
1.148 |
| UW |
1.416 |
0.920 |
0.27 |
−0.767 |
3.601 |
| Advice |
OW |
UW |
1.028 |
1.413 |
0.74 |
−2.323 |
4.379 |
| AW |
−6.176a |
1.202 |
0.00 |
−9.034 |
−3.313 |
| UW |
OW |
−1.028 |
1.413 |
0.74 |
−4.379 |
2.323 |
| AW |
−7.204a |
1.126 |
0.00 |
−9.885 |
−4.523 |
| AW |
OW |
6.176a |
1.202 |
0.00 |
3.318 |
9.034 |
| UW |
7.204a |
1.126 |
0.00 |
4.523 |
9.885 |
| Note. The mean difference is significant at the 0.05 level. OW = overweight; UW = underweight; AW = average weight. Welch’s ANOVAs with Games-Howell post hoc tests were run owing to violations of the equality of variances assumption. |
Table 4
Post Hoc Composite Weight Bias
|
| (I) Group |
Mean Difference (I-J) |
Std. Error |
Sig. |
95% Confidence Interval |
| Lower Bound |
Upper Bound |
| OW |
UW |
11.99a |
3.67 |
0.004 |
3.28 |
20.70 |
| AW |
−2.96 |
3.09 |
0.604 |
−10.29 |
4.36 |
| UW |
OW |
−11.99a |
3.67 |
0.004 |
−20.70 |
−3.28 |
| AW |
−14.95a |
3.10 |
0.000 |
−22.32 |
−7.58 |
| AW |
OW |
2.96 |
3.09 |
0.604 |
−4.36 |
10.29 |
| UW |
14.95a |
3.10 |
0.000 |
7.58 |
22.32 |
| Note. The mean difference is significant at the 0.05 level. OW = overweight; UW = underweight; AW = average weight. Welch’s ANOVAs with Games-Howell post hoc tests were run owing to violations of the equality of variances assumption. |
|
In addition to statistical significance, we also examined effect size to quantify the significance found. Results indicated that Advice Following showed a large effect of association with the independent variable of Weight (² = .16). Counselor Trust had a medium effect size (² = .13), and Counselor Selection yielded a small effect size (² = .04). These results suggest that the weight of a counselor has a high association with clients following counselor advice, with average-weight counselors faring the best. Additionally, participants indicated they would trust average and overweight counselors more than underweight counselors. Lastly, overweight counselors were more favorable in Counselor Selection than underweight counselors.
Antifat Attitudes and a Correlation With Counselor Trust, Advice Following, and Counselor Selection
We used Pearson correlations to examine associations between antifat attitudes and weight bias toward counselors (see Table 5). To do so, we examined data from participants assigned to all three counselor conditions in the study. Each group showed a significant relationship between antifat attitudes and weight bias toward counselors; thus, we combined data to attain a larger sample size. The Pearson correlations between the independent variable of antifat attitudes and dependent variables of Counselor Trust, Advice Following, Counselor Selection, and Composite Weight Bias score were significant at α = .05. We found positive correlations between antifat attitudes and Counselor Selection, r(186) = .400, p < .001, and Counselor Trust, r(186) = .211, p = .004. These results indicate that as antifat attitudes increase, participants’ trust in and selection of a counselor based on weight also increase. We found no significant correlation between Advice Following and Composite Weight Bias score with antifat attitudes.
Table 5
Correlation of AFA With Outcome Variables |
|
|
|
|
|
|
AFA |
Trust |
Selection |
| AFA |
Pearson Correlation |
1.000 |
0.211** |
0.400** |
| Sig. |
|
0.004 |
0.000 |
| N |
188.000 |
188.000 |
188.000 |
| Trust |
Pearson Correlation |
0.211** |
1.000 |
0.349** |
| Sig. |
0.004 |
|
0.000 |
| N |
188.000 |
188.000 |
188.000 |
| Selection |
Pearson Correlation |
0.400** |
0.349** |
1.000 |
| Sig. |
0.000 |
0.000 |
|
| N |
188.000 |
188.000 |
188.000 |
Note. AFA = Antifat Attitude. Advice was not statistically significantly correlated with AFA. One participant of the total study sample (N = 189) did not complete this portion and is not included in the table.
*Correlation is significant at the 0.01 level (two-tailed). |
Socio-Demographic Categories
We found no statistically significant differences in weight bias toward counselors based on ethnicity F(4, 181) = .037, p = .997; age F(4, 181) = 1.71, p = .149; BMI F(4, 177) = .193, p = .942; counseling status t(184) = .798, p = .426; eating disorder t(184) = 1.055. p = .137; or gender F(2, 183) = 1.423, p = .426. Additionally, we tested for Pearson correlations between BMI and antifat attitudes. Results indicated that BMI and antifat attitudes had no significant correlation, r(N = 187) = .004, p = .958.
Antifat Attitudes by Survey Condition
To test for undue influence from survey design or responses that stem from social desirability, we ran an ANOVA comparing participants in each questionnaire condition (i.e., underweight, average weight, and overweight counselor) and their scores on the AFA. We found no statistically significant differences between the three groups, F(2, 181) = 2.74, p = .067. For the AFA scores, M = 40.22 and SD = 12.57. However, with the results of the AFA correlation with Counselor Trust and Counselor Selection, these findings may indicate that there was social desirability across all three survey conditions.
Discussion
Contrary to previous research from McKee and Smouse (1983) that suggested counselors of any weight could address personal concerns, our study results indicated that clients might use weight to select a counselor, trust the counselors’ skills, and follow their counsel. When asked about weight, participants in this study slightly preferred to select and trust the average-weight and overweight counselors, with weight bias directed mainly at the underweight counselor. Like previous research about weight bias toward physicians (Puhl et al., 2013) and personal trainers (Hutson, 2013), our results showed some weight bias toward overweight counselors when following advice. For underweight counselors, weight bias was present in all three subscales and mirrored findings that underweight persons are not immune to weight discrimination (Beggan & DeAngelis, 2015).
Overweight Counselors
Our results yielded only one finding that supported the theme from Moller and Tischner’s (2019) study that “fat counselors cannot help” (p. 14). Statistically significant results from the present study showed less willingness to follow the advice of overweight counselors. Similar to the findings from Puhl et al. (2013), taking advice or counsel from an overweight health care professional may prove more difficult than trusting they can perform their job or being willing to work with them. With two-thirds of adults in the United States considered overweight or obese (CDC, 2022), these findings may reflect cause for concern that some clients may not perceive competence in counselors who are overweight.
The correlation between the AFA with Counselor Trust and Counselor Selection can give insight into the findings. The positive correlation between AFA and Counselor Trust was low but significant. With 60% of participants in the overweight-to-obese category, there could be an underlying factor that needs further exploration. There was no correlation between BMI and AFA. However, as Schwartz et al. (2006) suggested, overweight people have similar antifat attitudes as average-weight individuals. The slight correlation potentially relates to most participants having larger bodies and knowing that being in larger bodies does not equate to untrustworthiness. Likewise, for Counselor Selection, we should consider the concept of similar attraction. This concept posits that people associate with those perceived as similar to them and who have similar physical attributes (Montoya & Horton, 2013). Relating to this concept of similar attraction, the positive correlation between AFA and Counselor Selection could be attributed to the high percentage of larger-body participants feeling more comfortable selecting the overweight counselor.
Unlike findings from other studies (Moller & Tischner, 2019; Puhl et al., 2013), our results did not indicate that Counselor Trust or Counselor Selection were negatively related to being overweight. However, when looking at the Advice Following subscale, there was a marked difference in the scores. The hypothetical overweight counselor had higher mean scores than underweight counselors on all three subscales and overall composite scores. On the upside, weight may not be an issue for many clients seeking counseling. Despite continued weight bias and stigma in social media and society, people might recognize that overweight counselors’ skills and knowledge are more important than perceived body weight. On the downside, clients may hesitate to follow counsel associated with issues concerning their own physical well-being from a perceived overweight counselor. To combat this, counselors need to be willing to broach the issue of weight if they feel it is hindering the therapeutic alliance. Similar to other multicultural topics, differences in body weight between the counselor and client may be a potential barrier for the free expression of client concerns. The willingness of the counselor to explore this topic may put the client at ease and make them able to further explore their concerns in a nonjudgmental, therapeutic manner.
Underweight Counselors
We found surprising results suggesting that participants in our study would prefer an overweight or average-weight counselor to an underweight counselor. Participants scored counselors perceived as underweight significantly lower on a client’s willingness to select, trust, and follow a counselor’s advice than average-weight and overweight counselors. These results supported the decision to add this variable to our study and indicate the need for more research on weight bias toward underweight professionals.
The underweight variable yielded results that complement previous research on weight bias, indicating that people can be biased against underweight professionals (Allison & Lee, 2015; Davies et al., 2020b). Because of the persistent social desirability to be thin or underweight, research indicates that people may be pro-underweight on an explicit level; however, they implicitly prefer an average-weight person (Marini, 2017). In our findings, participants somewhat preferred to select an overweight counselor instead of an underweight counselor, upholding the notion that people do not necessarily trust those who are underweight despite the social pressure to be thin. This result highlights a striking mismatch in thought: people may prefer to be underweight because of social pressures but not fully trust an underweight counselor. It could indicate that societal pressures to be underweight are not as strong as once thought or it may suggest that people possess complicated views on being underweight in general.
These results reflect those found by Marini (2017), in which individuals implicitly preferred an overweight individual over an underweight individual, implying maladaptive behaviors and dangerous consequences. Additionally, with body positivity and body acceptance movements, underweight persons may be overlooked as recipients of negative weight bias (Beggan & DeAngelis, 2015). These results may give underweight counselors pause about how clients perceive them in session and the notion that experiences of thin privilege may not transfer into their professional identity. In response to these possible perceptions from clients, underweight counselors may benefit from seeking professional supervision or consulting with colleagues about the topic.
Antifat Attitudes
The AFA results indicated that as a person’s negative attitudes toward overweight people decrease, they disregard weight as a factor for selecting and trusting the skills of counselors. Currently, there is no measure for anti-thin attitudes to analyze whether this bias would yield similar results. Despite the lack of an anti-thin measure, these results reiterate the belief that we judge others based on what attributes are important to us or differentiate us from others (Cermák et al., 1993). When body weight is not an attribute of self-judgment, a person may not use it as a criterion toward others or in working with professionals. As a profession, we must continue supporting movements that promote acceptance of all bodies and destigmatize weight. With strong social media campaigns against weight bias, we can dispel the stereotypes about those who fall outside socially acceptable standards and replace them with acceptance.
Demographics
In addition to antifat attitudes, we chose to study socio-demographics because weight bias may fluctuate based on various group identities. Our results showed no statistically significant differences in age, gender, ethnicity, or BMI. These findings are relevant as they imply that weight bias may exist throughout all groups. However, we interpret these results cautiously, as the sample population was predominantly female, with fewer ethnically diverse participants, and more participation from people over 30. Notably, results for ethnicity were similar to previous research indicating that Black and White women had the same bias and weight stigma toward others who were overweight and underweight (Davies et al., 2020b).
Eating Disorder Consideration
Because of the nature of EDs, we added this category to the study to explore if a counselor’s weight would impact participants with an ED more. As counselors working with EDs often explore issues around weight, exercise, and eating concerns, we hypothesized that these participants might have a higher bias toward underweight and overweight counselors. We found that participants with EDs were not significantly different from participants without EDs in weight bias toward counselors in any of the variables. This finding is favorable information for counselors in this specialty, as it does not align with the findings from Moller and Tischner (2019) that suggest that the weight of a counselor is a barrier to treatment.
Experience of Counseling
A final surprising finding revealed in our results was that people with previous counseling experience had similar levels of weight bias to those who had not worked with a counselor. Participants who previously participated in counseling may recognize attributes, such as expertise, empathy, and compassion of a counselor, as more valuable in their relationship than weight. Because attributes such as genuineness, empathy, unconditional positive regard (Nienhuis et al., 2018) build the therapeutic relationship, it is feasible to see counselor weight as a non-factor. However, we found that prior experience in counseling did not mediate the weight bias participants demonstrated. This result gives room for concern that weight bias may diminish the initial value of core conditions and counselor attributes studied in the past. Perhaps weight bias is pervasive in the decision to work with a counselor.
Implications
Despite years of education and experience, weight bias may rule out competent counselors. Professionals who fall outside the average body weight are hyper-visible (Beggan & DeAngelis, 2015) and prone to judgment of their weight. This study fills a gap in the research pertaining to the way weight bias influences a client’s willingness to trust, follow counselor advice, and select their counselors. Knowing how weight bias impacts the counseling profession can help counselors become aware of an issue that may affect the therapeutic alliance. In response to the study results, we identified two key implications for the counseling profession.
First, the results are indicative of a multicultural issue. Many people see weight as a medical concern instead of a social justice issue (Christensen, 2021). This idea limits the amount of education and training counseling graduate students receive on the topic of weight, leading to the request to address weight in multicultural courses as a core topic. Weight becomes intersectional among identities, and counselors must train to be sensitive to and inclusive of the topic of weight. Broaching weight may feel uncomfortable but be necessary to strengthen the therapeutic relationship.
Second, recognizing that weight bias may impact a client’s willingness to select, follow the counsel of, or trust a counselor reiterates the importance of knowing the factors influencing the counseling relationship. Counselors should acknowledge that stereotypes, discrimination, and oppression influence the counseling relationship (Ratts et al., 2016). Counselors should not ignore weight bias as a possible stereotype and should be comfortable discussing it with their clients. Additionally, the multicultural competencies note that “Counselors know when to initiate discussions with regard to the influences of identity development, power, privilege, and oppression within the counseling relationship” (Ratts et al., 2016, p. 41). As society continues to push the thin ideal while simultaneously pushing body acceptance at any size, these contradictory messages will keep weight bias at the forefront of how others are judged.
Until weight bias is erased, counselors must be vigilant in understanding how they show up in the session, what message a client may perceive by their body weight, and how to broach the topic to strengthen the therapeutic alliance. If counselors seek to help reduce weight bias in society, they may benefit from reflecting on their own biases, privileges, and experiences with oppression in this area. They also may consider challenging potential biases through professional development, group or individual counseling supervision, or literature about weight bias in society.
Limitations
Like all studies, this study contains limitations. One limitation is the subjectivity of weight. Without guidelines for what constitutes overweight and underweight, this study heavily relied on participants’ perceptions of these variables, which may be inconsistent across participants. Not specifying these variables opened interpretation for the overlapping areas of overweight versus obese or underweight versus extremely thin. Participants in each treatment condition may have visualized different hypothetical counselors than peers in the same treatment group. Using images may improve the specificity of the variable in future studies.
Additionally, there was no identified gender for the hypothetical counselors in each treatment condition, allowing participants to visualize any gender of counselor they chose. This lack of specificity may have created a moderating variable. Women represent higher numbers in the counseling profession. Women experience more discrimination than men (McHugh & Kasardo, 2012; Roehling et al., 2007), and it is unknown if people who identify as gender non-binary experience more or less weight bias. By not distinguishing the gender of the counselor, our ability to make inferences across genders is limited. Creating a study that specifies multiple genders may yield more representative results.
Another limitation is that a non-parametric test (e.g., Welch’s ANOVA) was used instead of parametric tests with more statistical power. The decision to use the non-parametric test was unavoidable because of violating the required assumptions. At the same time, future research may corroborate our findings using a parametric test if data allow. Future research may also replicate this study using multivariate ANOVA (MANOVA), which considers correlations of dependent variables.
Lastly, social desirability and self-reporting may have impacted responses. While completing the questionnaire, feelings about weight bias may have occurred outside of participants’ awareness, causing cognitive dissonance. To resolve this dissonance, responses may have overtly favored accepting the overweight counselor or selecting fewer negative answers on the AFA. Participants also reported their own weight bias, which may have presented a self-report limitation. The results of overweight counselors having higher mean scores on Trust and Selection than average-weight counselors give room for consideration that social desirability may have influenced some of the participants’ answers. Future studies may benefit from including a test for social desirability or implicit association tests to increase the study’s validity.
Future Considerations
Future considerations for research encompassing weight bias across the spectrum would require developing an anti-thin attitude measure to identify weight attitudes toward underweight individuals accurately. This measure would be beneficial for bringing more awareness to underweight discrimination and measuring its impact on professionals and members of society. As society continues to push the thin ideal, people will strive to fit that ideal. However, as our results suggest, underweight counselors may face significant weight bias from clients. Consequently, counselors would benefit from a measure created to address underweight bias.
The counseling profession lacks extensive, meaningful research regarding the physical and educational factors that clients find most important in selecting, trusting, and following the advice of a counselor. Another factor to incorporate in future research is a counselor’s level of education and expertise. Clients may more favorably evaluate an average weight counselor with a specialist or doctoral degree than an underweight or overweight colleague with the same credentials. If weight bias influences these variables despite the skill level of the counselor, clients may miss receiving help from highly trained and educated people. Additionally, directly exploring the role that empathy, congruence, and strengths-based counseling have compared to weight bias may yield significant findings.
A final consideration for future research involves focusing on counselors who work in the ED field, a specialty that deals with eating, weight, body image, and exercise. Though we did not find significant differences in this study between those with and without an ED, our hypothetical counselor was not an ED counselor. These counselors may experience more judgment and assumptions of lifestyle choices by their clients, as they are considered specialists in EDs. Studies show that being underweight may indicate an ED, such as anorexia or binge eating disorder (Davies et al., 2020a; Marini, 2017). It is unknown if clients would replicate the results found in this study regarding counselors in the ED field.
Conclusion
This study examined participants’ weight bias toward hypothetical counselors of different weights. Our results highlight the existence of weight bias toward counselors on both ends of the weight spectrum. Even with strengthening the counseling relationship through empathy, congruence, and unconditional positive regard, counselors may benefit from reflecting on potential client weight bias and its impact on their therapeutic alliance. Additionally, weight as a multicultural issue increases counselors’ competence in addressing the prejudice and stereotypes that may limit their client’s willingness to trust them, follow their advice, or select them as their counselor.
Conflict of Interest and Funding Disclosure
The authors reported no conflict of interest
or funding contributions for the development
of this manuscript.
References
Ackerman, S. J., & Hilsenroth, M. J. (2001). A review of therapist characteristics and techniques negatively impacting the therapeutic alliance. Psychotherapy: Theory, Research, Practice, Training, 38(2), 171–185.
https://doi.org/10.1037/0033-3204.38.2.171
Allen, M. L., Cook, B. L., Carson, N., Interian, A., La Roche, M., & Alegría, M. (2017). Patient-provider therapeutic alliance contributes to patient activation in community mental health clinics. Administration and Policy in Mental Health and Mental Health Services Research, 44(4), 431–440. https://doi.org/10.1007/s10488-015-0655-8
Allison, M., & Lee, C. (2015). Too fat too thin: Understanding bias against overweight and underweight in an Australian female university student sample. Psychology & Health, 30(2), 189–202.
https://doi.org/10.1080/08870446.2014.954575
Beggan, J. K., & DeAngelis, M. (2015). “Oh, my God, I hate you”: The felt experience of being othered for being thin. Symbolic Interaction, 38(3), 371–392. https://doi.org/10.1002/SYMB.162
Bucchianeri, M. M., Eisenberg, M. E., & Neumark-Sztainer, D. (2013). Weightism, racism, classism, and sexism: Shared forms of harassment in adolescents. Journal of Adolescent Health, 53(1), 47–53.
https://doi.org/10.1016/j.jadohealth.2013.01.006
Centers for Disease Control and Prevention. (2022, June 3). Defining adult overweight & obesity. https://www.cdc.gov/obesity/basics/adult-defining.html
Cermák, I., Osecká, L., Rehulková, O., & Blatný, M. (1993). Judging others according to yourself: II. Interpersonal characteristics of personality and the structure of interpersonal attributions. Studia Psychologica, 35(2), 185. https://librarylink.uncc.edu/login?url=https://www.proquest.com/scholarly-journals/judging-others-according-yourself-ii/docview/1306142557/se-2?accountid=14605
Christensen, K. N. (2021). Factors related to weight-bias among counselors (Order No. 28541740). Available from Dissertations & Theses @ University of North Carolina Charlotte. (2562239518).
Clabaugh, A., Karpinski, A., & Griffin, K. (2008). Body weight contingency of self-worth. Self and Identity, 7(4), 337–359. https://doi.org/10.1080/15298860701665032
Clark, A. J. (2010). Empathy: An integral model in the counseling process. Journal of Counseling & Development, 88(3), 348–356. https://doi.org/10.1002/j.1556-6678.2010.tb00032.x
Coladarci, T., Cobb, C. D., Minium, E. W., & Clarke, R. B. (2011). Fundamentals of statistical reasoning in education (3rd ed.). Wiley.
Crandall, C. S. (1994). Prejudice against fat people: Ideology and self-interest. Journal of Personality and Social Psychology, 66(5), 882–894. https://doi.org/10.1037/0022-3514.66.5.882
Davies, A., Burnette, C. B., & Mazzeo, S. E. (2020a). Real women have (just the right) curves: Investigating anti-thin bias in college women. Eating and Weight Disorders, 25, 1711–1718.
https://doi.org/10.1007/s40519-019-00812-7
Davies, A., Burnette, C. B., & Mazzeo, S. (2020b). Black and White women’s attributions of women with underweight. Eating Behaviors, 39, 101446. https://doi.org/10.1016/j.eatbeh.2020.101446
Faul, F., Erdfelder, E., Lang, A.-G., & Buchner, A. (2007). G*Power 3: A flexible statistical power analysis program for the social, behavioral, and biomedical sciences. Behavior Research Methods, 39, 175–191.
https://doi.org/10.3758/BF03193146
Feller, C. P., & Cottone, R. R. (2003). The importance of empathy in the therapeutic alliance. The Journal of Humanistic Counseling, Education and Development, 42(1), 53–61.
https://doi.org/10.1002/j.2164-490x.2003.tb00168.x
Grimes, W. R., & Murdock, N. L. (1989). Social influence revisited: Effects of counselor influence on outcome variables. Psychotherapy: Theory, Research, Practice, Training, 26(4), 469–474. https://doi.org/10.1037/h0085465
Hauser, M., & Hays, D. G. (2010). The slaying of a beautiful hypothesis: The efficacy of counseling and the therapeutic process. The Journal of Humanistic Counseling, Education and Development, 49(1), 32–44.
https://doi.org/10.1002/j.2161-1939.2010.tb00085.x
Hinman, N. G., Burmeister, J. M., Kiefner, A. E., Borushok, J., & Carels, R. A. (2015). Stereotypical portrayals of obesity and the expression of implicit weight bias. Body Image, 12, 32–35.
https://doi.org/10.1016/j.bodyim.2014.09.002
Hutson, D. J. (2013). “Your body is your business card”: Bodily capital and health authority in the fitness industry. Social Science & Medicine, 90, 63–71. https://doi.org/10.1016/j.socscimed.2013.05.003
Kim, E., & Kang, M. (2018). The effects of client–counselor racial matching on therapeutic outcome. Asia Pacific Education Review, 19(1), 103–110. https://doi.org/10.1007/s12564-018-9518-9
Kinavey, H., & Cool, C. (2019). The broken lens: How anti-fat bias in psychotherapy is harming our clients and what to do about it. Women & Therapy, 42(1–2), 116–130. https://doi.org/10.1080/02703149.2018.1524070
Lacroix, E., Alberga, A., Russell-Mathew, S., McLaren, L., & von Ranson, K. (2017). Weight bias: A systematic review of characteristics and psychometric properties of self-report questionnaires. Obesity Facts, 10(3), 223–237. https://doi.org/10.1159/000475716
Lewis, R. J., Cash, T. F., & Bubb-Lewis, C. (1997). Prejudice toward fat people: The development and validation of the Antifat Attitudes Test. Obesity Research, 5(4), 297–307. https://doi.org/10.1002/j.1550-8528.1997.tb00555.x
Liu, H. (2015). Comparing Welch ANOVA, a Kruskal-Wallis test, and traditional ANOVA in case of heterogeneity of variance. https://doi.org/10.25772/BWFP-YE95
Lorr, M. (1965). Client perceptions of therapists: A study of the therapeutic relation. Journal of Consulting Psychology, 29(2), 146–149. https://doi.org/10.1037/h0021924
Marini, M. (2017). Underweight vs. overweight/obese: Which weight category do we prefer? Dissociation of weight-related preferences at the explicit and implicit level. Obesity Science & Practice, 3(4), 390–398. https://doi.org/10.1002/osp4.136
McHugh, M. C., & Kasardo, A. E. (2012). Anti-fat prejudice: The role of psychology in explication, education and eradication. Sex Roles, 66(9–10), 617–627. https://doi.org/10.1007/s11199-011-0099-x
McKee, K., & Smouse, A. D. (1983). Clients’ perceptions of counselor expertness, attractiveness, and trustworthiness: Initial impact of counselor status and weight. Journal of Counseling Psychology, 30(3),
332–338. https://doi.org/10.1037/0022-0167.30.3.332
Meadows, A., & Daníelsdóttir, S. (2016). What’s in a word? On weight stigma and terminology. Frontiers in Psychology, 7, 1527. https://doi.org/10.3389/fpsyg.2016.01527
Meyer, O. L., & Zane, N. (2013). The influence of race and ethnicity in clients’ experiences of mental health treatment. Journal of Community Psychology, 41(7), 884–901. https://doi.org/10.1002/jcop.21580
Moller, N., & Tischner, I. (2019). Young people’s perceptions of fat counsellors: “How can THAT help me?” Qualitative Research in Psychology, 16(1), 34–53. https://doi.org/10.1080/14780887.2018.1536384
Montoya, R. M., & Horton, R. S. (2013). A meta-analytic investigation of the processes underlying the similarity-attraction effect. Journal of Social and Personal Relationships, 30(1), 64–94.
https://doi.org/10.1177/0265407512452989
Nienhuis, J. B., Owen, J., Valentine, J. C., Winkeljohn Black, S., Halford, T. C., Parazak, S. E., Budge, S., & Hilsenroth, M. (2018). Therapeutic alliance, empathy, and genuineness in individual adult psychotherapy: A meta-analytic review. Psychotherapy Research, 28(4), 593–605. https://doi.org/10.1080/10503307.2016.1204023
Nutter, S., Russell-Mayhew, S., Arthur, N., & Ellard, J. H. (2018). Weight bias and social justice: Implications for education and practice. International Journal for the Advancement of Counselling, 40(3), 213–226.
https://doi.org/10.1007/s10447-018-9320-8
Puhl, R. M., Gold, J. A., Luedicke, J., & DePierre, J. A. (2013). The effect of physicians’ body weight on patient attitudes: Implications for physician selection, trust and adherence to medical advice. International Journal of Obesity, 37(11), 1415–1421. https://doi.org/10.1038/ijo.2013.33
Puhl, R. M., & Heuer, C. A. (2010). Obesity stigma: Important considerations for public health. American Journal of Public Health, 100, 1019–1028. https://doi.org/10.2105/AJPH.2009.159491
Puhl, R. M., Latner, J. D., King, K. M., & Luedicke, J. (2014). Weight bias among professionals treating eating disorders: Attitudes about treatment and perceived patient outcomes. International Journal of Eating Disorders, 47(1), 65–75. https://doi.org/10.1002/eat.22186
Ratts, M. J., Singh, A. A., Nassar-McMillan, S., Butler, S. K., & McCullough, J. R. (2016). Multicultural and social justice counseling competencies: Guidelines for the counseling profession. Journal of Multicultural Counseling and Development, 44(1), 28–48. https://doi.org/10.1002/jmcd.12035
Roehling, M. V., Roehling, P. V., & Pichler, S. (2007). The relationship between body weight and perceived weight-related employment discrimination: The role of sex and race. Journal of Vocational Behavior, 71(2), 300–318. https://doi.org/10.1016/j.jvb.2007.04.008
Ruggs, E. N., King, E. B., Hebl, M., & Fitzsimmons, M. (2010). Assessment of weight stigma. Obesity Facts, 3(1), 60–69. https://doi.org/10.1159/000273208
Schwartz, M. B., Vartanian, L. R., Nosek, B. A., & Brownell, K. D. (2006). The influence of one’s own body weight on implicit and explicit anti-fat bias. Obesity, 14(3), 440–447. https://doi.org/10.1038/oby.2006.58
Sharf, J., Primavera, L. H., & Diener, M. J. (2010). Dropout and therapeutic alliance: A meta-analysis of adult individual psychotherapy. Psychotherapy: Theory, Research, Practice, Training, 47(4), 637–645.
https://doi.org/10.1037/a0021175
Taber, K. S. (2018). The use of Cronbach’s alpha when developing and reporting research instruments in science education. Research in Science Education, 48, 1273–1296. https://doi.org/10.1007/s11165-016-9602-2
Tischner, I. (2019). Tomorrow is the start of the rest of their life—so who cares about health? Exploring constructions of weight-loss motivations and health using story completion. Qualitative Research in Psychology, 16(1), 54–73. https://doi.org/10.1080/14780887.2018.1536385
Tudor, K. (2011). Rogers’ therapeutic conditions: A relational conceptualization. Person-Centered & Experiential Psychotherapies, 10(3), 165–180. https://doi.org/10.1080/14779757.2011.599513
Zar, J. H. (1998). Biostatistical analysis (4th ed.). Prentice Hall.
Amy Biang, PhD, LCMHC, CEDS, is an assistant professor at Northern Arizona University. Clare Merlin-Knoblich, PhD, is an associate professor at the University of North Carolina at Charlotte. Stella Y. Kim, PhD, is an assistant professor at the University of North Carolina at Charlotte. Correspondence may be addressed to Amy Biang, 15451 N 28th Ave, Phoenix, AZ 85053, amy.biang@nau.edu.
Aug 24, 2023 | Volume 13 - Issue 2
Kelly Emelianchik-Key, Bridget Glass, Adriana C. Labarta
Teen dating violence (TDV) is an ongoing epidemic in the United States. Subsequently, gender symmetry regarding the experience and perpetration of violence continues to be a prevalent debate in American society. TDV is a clinical concern that can impact clients’ safety; therefore, counselors must be adequately trained and cognizant of any biases that may influence the assessment and treatment of survivors of abuse. We conducted a qualitative research study using case vignettes to explore how counseling students conceptualize and propose treatment of TDV with male and female clients. Six overarching categories and 19 corresponding themes emerged, with gender bias as the most notable finding of the study. We conclude by discussing the implications for counseling and providing recommendations for educational standards and best practices to reduce gender bias and promote more inclusive treatment.
Keywords: teen dating violence, abuse, counseling students, gender bias, educational standards
Teen dating violence (TDV) is an adverse childhood experience that often shapes future relationship patterns throughout adulthood (Emelianchik-Key et al., 2022; Offenhauer & Buchalter, 2011). As a result, TDV has become a significant public health concern among adolescents in the United States (Centers for Disease Control and Prevention [CDC], 2021). After a compilation of prevalence rates, dating violence victimization rates range from 20%–53% in early adolescence (Goncy et al., 2017). In 2019 alone, one in 12 high school students reported physical and sexual violence within a dating relationship (CDC, 2021). Of those who reported intimate partner violence, 11 million women and 5 million men noted experiences of TDV before age 18 (CDC, 2021). TDV is characterized by physically or sexually violent acts that one adolescent perpetrates against another whom they are dating (CDC, 2021). This is inclusive of maladaptive behaviors, such as stalking and emotional abuse. In fact, emotional abuse (e.g., stonewalling, insulting language, social isolation, name-calling, gaslighting) exceeds the expression of physical violence within most teen dating relationships (Offenhauer & Buchalter, 2011).
TDV compromises the physical and emotional safety of American youth and can potentially impair adolescent development (CDC, 2021; K. E. Hunt et al., 2022), including how young people learn emotional regulation and form healthy relationships. K. E. Hunt et al. (2022) noted that many complicated variables play a role in the development and the prevention of dating violence, with family of origin belief systems and peers contributing to social learning. This was apparent in Emelianchik-Key et al.’s (2022) qualitative study, which determined that young college-aged females consistently normalized and accepted toxic relationship behaviors as common and justified because of norms created by family, peers, and society.
Further, the consequences of TDV on an adolescent’s psychological well-being and decision-making may be severe and persist over time, causing problems later in life. For example, Temple et al. (2013) determined a significant increase in the internalization of emotions in adolescent girls who experienced TDV. Youth with pre-existing mental health conditions are also at increased risk for traumatization by a relationship partner (Temple et al., 2013). Because TDV may lead to various mental health concerns, such as substance misuse, eating disorders, antisocial behaviors, self-injury, and suicidality (Foshee et al., 2013), counselors play an integral role in TDV prevention and intervention. Many young clients may choose to initially disclose personal experiences of TDV or unhealthy relationship behaviors in a therapeutic setting, making counselor preparedness critical.
Gender Symmetry in TDV
TDV has also led to strong debates regarding the issue of gender symmetry. Several studies have found that TDV is reciprocal, with both partners exhibiting aggressive or toxic behaviors in response to each other (Eisner, 2021; Emelianchik-Key et al., 2022; K. E. Hunt et al., 2022). However, some studies indicate vastly disproportionate rates of TDV victimization among adolescent girls (Kann et al., 2018), mainly in instances of extreme physical brutality or sexual violence (Swahn et al., 2010). The inconsistent rates may be related to social perceptions of TDV as a female concern, decreased male reporting (often attributed to stigma), conceptualization and understanding of violence, and a lack of validated measures that encompass diverse cultural and gendered experiences (Eisner, 2021; Walker et al., 2020). These contradictory reports make it even more challenging for clinicians.
Counselor Preparedness
Currently, there are several gaps in the literature regarding counselor education and TDV, including training, competency, and expertise (Murray et al., 2016). In a small sample of programs accredited by the Council for Accreditation of Counseling and Related Educational Programs (CACREP), Henriksen et al. (2010) found that graduate counseling programs minimally addressed specialty training areas, requiring graduates to acquire additional skills independently. CACREP (2015) standards do not include TDV in training criteria, thus leaving the inclusion of these topics to the discretion of faculty. Further, Wozny (2005) found that 34% of marriage and family therapy programs had a domestic violence course, compared to 4% of counselor education programs. Similarly, in a sample of practicing school counselors, only 10% reported specific domestic violence training and continuing education at their workplace in the past 2 years (Khubchandani et al., 2012). Among the participants, 19% reported no formal education or training on TDV, and 83% of the participants’ settings did not assess TDV amongst the students within their school system (Khubchandani et al., 2012). This is alarming, given that 72% of sexual harassment and 28% of dating violence incidents occur in schools (Turner et al., 2011). A lack of preparation for crisis training, intervention, and prevention may cause serious detriment and endangerment to clients and counselors (Morris & Minton, 2012).
Counselor Bias
Gender bias related to survivors of relationship abuse is prevalent among trainees and professional counselors, reflecting stigmas among the general population (Maghsoudi, 2018). Karakurt et al.’s (2013) study on counselor attitudes toward perpetrators of violence revealed that most participants believed female offenders were justified in their violent actions and were not as dangerous as their male counterparts. Results also indicated that participants expressed less empathy for male survivors and more confidence in treating male perpetrators (Karakurt et al., 2013). Counselors may perpetuate stigma regarding female survivors by over-pathologizing, minimizing their complaints, and invalidating their feelings (Maghsoudi, 2018). Maghsoudi (2018) contended that there is a lack of training, but more importantly, there are limited opportunities within the educational curriculum for trainees to explore implicit biases regarding violence among partners.
The development of counselor self-awareness regarding personally held biases and beliefs can mitigate widespread assumptions about TDV. In addition, counselor self-awareness is a focal point of counselor education programs. This study sought to examine if there were differences in how counseling students conceptualize and work with male and female survivors of TDV. Using a qualitative design, we utilized case vignettes to examine how counseling students conceptualize, assess, and treat TDV. The overarching research question was: How do counseling students conceptualize and propose treatment for the experience of TDV in both female and male clients?
Method
Data Collection
After receiving IRB approval, the primary researcher, Kelly Emelianchik-Key, recruited a convenience sample of participants over 6 months in three counselor education programs. Emails were sent to the clinical placement coordinators to request the dissemination of the study details to their students. The three clinical placement coordinators agreed and sent the email with links to a Survey Monkey for students 2 years or more into their academic studies. The students received an email containing study information, a link to the electronic consent forms, demographic questions, and a case scenario with open-response questions. After completing the consent and demographic form, participants were randomly assigned one of two client case vignettes. The scenarios were identical vignettes (located in the Appendix) containing details of a struggling teen client experiencing TDV. The only difference in cases was the identified gender of the client. One case had a male client with a female partner while the other had a female client with a male partner. Counseling students were then asked questions about the vignette to better understand their clinical impressions of the client, a diagnosis (if warranted), any concerns regarding the case, and treatment ideas and considerations. The case vignettes and written responses were collected and analyzed until saturation was achieved (Braun & Clarke, 2021). To assess data saturation, we evaluated the data for completeness and at specific intervals of the data analysis process. Data saturation was met with 45 participants, with 22 responses to the female case and 23 responses to the male case.
Participants
The inclusion criteria for this study required that participants 1) were current students in a CACREP-accredited counseling program (any specialization) and 2) had completed all program-related content coursework, with only clinical field placements remaining. Of the 45 participants, eight self-identified as male and 37 self-identified as female. The participants’ degree track specializations were as follows: clinical mental health counseling (n = 21; 51%), school counseling (n = 8; 17%), rehabilitation counseling (n = 6; 13%), marriage and family therapy (n = 2; 4%), doctoral counselor education students (n = 3; 6%), and non–degree seeking students who already held a master’s degree in counseling (n = 3; 6%). All students were either enrolled in a clinical experience or had completed their clinical experiences. Participants ranged from 21 to 52 years of age, with a mean of 26.8. We did not collect data on participants’ race/ethnicity or sexual orientation in the demographic form, as it was not a variable of consideration in our study.
Procedure
In the present study, we aimed to understand how counseling students conceptualize clients experiencing TDV while considering differences in approach based on client gender. We used a qualitative case vignette design with a deductive approach to better understand gender-based assumptions, myths, or stigmas that may affect counseling students’ conceptualization and approach to treating TDV. The vignette design allows for assessing attitudes, values, norms, and perceptions regarding sensitive social science issues in qualitative research (Hughes, 1998). It may also be beneficial in exploring topics such as gender equality, gender norms, gender discrimination, drug use, mental illness, and emotional and behavioral difficulties (de Macedo et al., 2015). The case vignettes were created using a three-phase approach to test for content validity in health care education research (St. Marie et al., 2021): 1) Developing the vignette and associated questions, 2) sending the vignette to three experts in counseling and domestic violence research, and 3) testing the revised vignette with a small group of participants that suggested edits for clarity. The Appendix contains the vignette for a female teen client. An identical vignette for a male teen client was also utilized during the study. The only difference in the cases was the identified gender of the client and their partner; names, scenarios, and all non-gendered wording remained the same.
We approached this research from a post-structural feminist theoretical lens, conceptualizing TDV as reciprocal and challenging the common sociocultural notions of women as “powerless” and men as “powerful” in a patriarchal society. For this reason, we did not specify the client’s cultural background and used binary gender identities and heterosexual relationships in the case examples. Case vignettes with varying intersecting identities may have elicited other forms of bias, such as internalized homophobia, heteronormativity, gender-normative assumptions, and ethnocentric views, further compounding the dynamics and potentially leading to misinterpretations of the qualitative findings. Our hope is that this study can provide a framework for future research to incorporate additional layers of identity and address existing gaps in the TDV literature.
Research Team Positionality
The researchers’ experiences, qualities, personalities, or histories can potentially influence qualitative research outcomes (B. Hunt, 2011). Therefore, we engaged in reflexivity throughout the research process to minimize bias during data analysis. Our research team consisted of three cisgender female faculty in counselor education. All are licensed mental health counselors and one is also a licensed marriage and family therapist. We also have diverse counseling experiences in various mental health settings, including schools, university counseling centers, residential treatment facilities, domestic violence shelters and outreach programs, and private practice. Our related research interests include TDV, intimate partner violence, gender issues, sexuality, and culturally responsive approaches to counseling and research. Consistent with the qualitative research process, we continually engaged in dialogue and a self-reflective process to examine personal beliefs and challenge biases in TDV literature to ensure that our positionality did not impede the research process.
Data Analysis and Trustworthiness
Thematic analysis is a grouping of methods that examines commonalities and differences in research. Theoretically flexible, thematic analysis is a useful and practical approach to counseling research (Clarke & Braun, 2018). In this study, we utilized reflexive thematic analysis to form themes from codes, which were also grouped by major categories based on our questions to participants (Braun & Clarke 2013, 2021). Thematic analysis can also be expansive, ranging from research with rich descriptions to research that aims to describe and summarize (Clarke & Braun, 2018). The recommended steps for a reflexive thematic analysis were followed (Braun & Clarke, 2013, 2021; Clarke & Braun, 2018). We independently reviewed all data for familiarization, which included detailed documentation of thoughts, field notes, and decisions that were made individually. We met weekly to develop initial codes that were placed into a codebook to chart the developing analysis. Per Braun and Clarke’s (2013) recommendations, we set the data into central organizing concepts or categories to communicate and develop the themes. Within each category, we further grouped data by gender of the client to assess gender normative assumptions that may be guiding counseling students’ decision-making processes. Meetings took place over 6 weeks (one category per week) to discuss and group initial overarching themes for each vignette. Once this phase was complete, the themes were refined, defined, and named; the outcome was a final report.
To promote trustworthiness, we followed Nowell et al.’s (2017) recommendations for methodological rigor within Braun and Clarke’s (2013, 2021) steps for thematic analysis. These included a review of responses at various points prior to analysis. Peer debriefing took place during the 6-week coding process, along with an audit trail of documentation and codebooks connecting themes and content. Based on consensus coding, codebook refining took place weekly (Nowell et al., 2017). As a final step, member checking took place by sending the resulting themes and subthemes to the respective programs where students were recruited. Because the participants were anonymous, the programs disseminated findings to all students, asking anyone who initially participated to check for credibility in the results and reach out via email or anonymously through a Qualtrics link if they found inaccuracies (Braun & Clarke, 2013; Nowell et al., 2017). No participants responded or objected to the findings after three rounds of email blasts.
Findings
We determined six emergent categories that spanned across both cases: (a) case conceptualization and clinical impressions, (b) diagnostic impressions, (c) relationship considerations, (d) clinical concerns, (e) treatment approaches, and (f) gender bias. Within these six categories, 19 themes emerged, which are defined below in their corresponding category.
Case Conceptualization and Clinical Impressions
The case conceptualization and clinical impressions category captured counseling students’ perceptions of the presenting problem, resulting in the two themes of interpersonal and intrapersonal concerns. Although both vignettes aimed to illustrate specific cases of TDV, counseling students presented various explanations regarding the cause of the client’s symptoms. The interpersonal theme focused on aspects outside the client’s immediate control, including limited peer support, the dating relationship, and academic concerns. For example, a counseling student responding to the male client’s case suggested that he needs “to get involved in more extracurricular activities and find things that he enjoys doing” or “extra support from school and family.” Students responding to the female case also focused on relational issues, indicating that “she needs to build better relationships with her family, friends, and partner.” Participants also considered intrapersonal factors related to the client’s mood, level of assertiveness, self-esteem, and self-confidence. For example, in responding to the male client case, counseling students indicated that the client “has poor or low self-esteem” or “should be able to stand up for himself in all areas of his life.” The female case elicited similar responses from participants, such as “she needs to stop being so codependent” and “she could get better if she wanted to.”
Diagnostic Impressions
The second category was grouped based on diagnostic criteria. Four themes emerged: mood disorders, personality disorders, stress disorders, and neurodevelopmental disorders. Three subthemes were also identified: insufficient information, no diagnoses warranted, and only symptomology. Counseling students provided various responses regarding whether a diagnosis was warranted in the case vignette. Some participants responded with multiple possible diagnoses for the client presented in the case scenario. Others prefaced the diagnosis with statements alluding to uncertainty with making a concrete diagnosis, such as “possibly is experiencing depression,” or noting a diagnosis followed by “but more information will be needed to confirm.” About half of the participants stated a concrete diagnosis while providing support and examples from the case vignette.
Although many diagnoses overlapped in both scenarios, there were differences regarding the frequency of endorsement. The most common diagnoses for the male client included adjustment disorder (n = 9) and attention-deficit/hyperactivity disorder (ADHD; n = 7). Conversely, the female client was most frequently diagnosed with a dependent personality disorder or style (n = 8). The female client was never diagnosed with ADHD and was only determined to have “attention problems.”
Dating Relationship Considerations
Participants drew attention to relational concerns in the client’s life within this category. The identified themes included unhealthy relationships, support, and dating violence. The unhealthy relationship theme was evident in both client cases. Several participants (n = 15; seven in the male client case and eight in the female client case) noted comments like “unhealthy relationship” while providing examples of unhealthy behaviors, such as the partner’s communication style and controlling behaviors. Several responses highlighted the theme of support. Participants appeared to skirt around labeling relationship violence and resorted to more general comments, such as “the client needs relationship support” or “better communication in the relationship is needed.” Additionally, one counseling student noted the lack of support in the relationship and questioned the need for such a serious relationship at this “young age,” demonstrating judgment and bias (further discussed in Category 6). This theme also captured counseling students’ recommendations for enhanced relational support (e.g., date nights).
The final theme within this category, dating violence, was evident in six responses that labeled the relationship as “violent” or mentioned “dating abuse” as a concern. In responses that noted abuse, three mentioned “emotional abuse,” and two identified “sexual abuse” in the female case. The word “sexual pressure” was also used by two counseling students that completed the female case, but it was not explicitly noted as abuse or violence. In the female case, two participants mentioned “rape” four times, whereas “rape” was never mentioned in the male case. In the male case, the only comment that slightly implied relationship violence noted: “needs to discuss relationship boundaries with his partner, so she doesn’t pressure him to advance sexually.”
Treatment Approaches
Treatment approaches were categorized and counted based on theoretical orientations. Most participants responded with similar treatment considerations for both presented cases. The five grouped themes included cognitive behavioral therapy (n = 15), solution-focused therapy (n = 11), family therapy (n = 9), couples counseling (n = 3), and other (n = 7). The other theme resulted from various suggestions that were not specific approaches for individual therapy but could support the client. These suggestions included tutoring, group therapy, and peer support. Several counseling students made referral recommendations instead of offering treatments or approaches that the counselor could directly utilize with these clients. For example, a suggestion included psychiatric evaluation or referral for the female survivor (n = 10). This suggestion was not recommended as often for the male survivor (n = 2). Additionally, one respondent suggested that the female survivor should “get a referral for a gynecologist.” In contrast, no responses indicated a medical referral for the male client.
Practice Considerations
Participants answered questions regarding any apprehension or reservations they might experience while treating the proposed clients, categorized as practice considerations. The themes that emerged were ethical and legal concerns, family concerns, and school concerns. Almost a quarter of participants (n = 11) indicated clinical concerns related to ethical or legal implications or limits of confidentiality because of the clients’ ages. Some counseling students mentioned “involving parents” or “disclosing to parents” without explaining what warranted disclosure. One participant was concerned for the client’s safety because of sexual violence (i.e., rape) and specifically mentioned reporting to authorities. Nearly half of the participants (n = 20) identified the client’s family issues as problematic, offered solutions to repair relationship ruptures within the family dynamic, and mentioned strategies for improved communication. Additionally, participants (n = 22) identified school-related difficulties, such as decreased grades, as an area of concern for the client. Examples of commentary provided by those participants included, “Jordan needs a tutor” or “Jordan needs to be evaluated educationally at school to see if there are learning challenges and get an IEP.”
Gender Bias
The sixth category was identified because of the overwhelming gender biases that emerged throughout the participants’ responses. This category was further grouped into two themes: language and judgments and myths. The researchers compared the language counseling students used to describe male and female clients. Although the counseling students described the male and female clients with similar terms (i.e., influenced, boundaries, codependence), the frequency across all responses grossly varied. For example, participants used the term “abuse” twice as many times when describing the female client’s relationship (n = 23) as opposed to the male client’s relationship (n = 11). Similarly, counseling students utilized the term “survivor” to describe the female client (n = 13), but not the male client (n = 0). The male client was often described as “withdrawn” (n = 28) and experiencing “attention” difficulties (n = 43), “adjustment” (n = 29), and “codependence” issues (n = 23). Conversely, the female client was more likely to be described as “influenced” (n = 19), “manipulative” (n = 22), and experiencing “dependency” (n = 47) concerns. Although these counts could highlight one participant using the word one or more times in a response, they illuminate the disparity and lack of discernment in the language used to describe both clients.
Within the theme of judgments and myths, the counseling students consistently referenced and discussed the female partner (perpetrator) in the male client scenario. These comments made inferences or judgments about the female partner (perpetrator) even though she was not the identified client. Counseling students made various comments about the female perpetrator, including, “she is controlling,” “nasty,” or “needy,” alluding to the fact that she is causing these issues for the male client. Counseling students also provided clinical impressions, recommendations, and diagnoses for the male client’s partner (female perpetrator). Conversely, participants who completed the female client case noted clinical recommendations for the female client’s partner (male perpetrator), such as general “relationship help” and “anger management and self-help.” These comments and recommendations were less frequent and judgmental of the female client’s partner (male perpetrator). Relatedly, no participants provided a diagnosis for the male perpetrator. Overall, counseling students frequently mentioned the female partner (perpetrator) rather than focusing on the identified client, although this was less frequent for the male partner (perpetrator).
Additionally, many judgments about the survivors arose, perpetuating myths and the stigma surrounding TDV and survivors. For example, one student noted the female survivor “could get better if she wanted to” and “she needs to express her feelings to her partner.” Another student wrote that the male survivor needed to “be more assertive in the relationship and not get walked all over” and “seems like he is a people pleaser and needs to take more control over his situation.” Furthermore, the few times relationship violence was discussed, the female client was always referred to as a “victim” or “survivor,” whereas the male client was referred to by name or “the client.”
Discussion
This study aimed to examine how counseling students conceptualize and propose treatment for the experience of TDV in both female and male clients. The results indicate that gender played a significant role in counseling students’ responses to a survivor’s clinical needs. Data were grouped using the following categories that corresponded with questions: (a) case conceptualization and clinical impressions, (b) diagnostic impressions, (c) relationship considerations, (d) practice considerations, (e) treatment approaches, and (f) gender bias. Within these categories, 19 themes emerged, which we discuss further below.
The counseling students presented similar challenges in their case conceptualizations and diagnoses for each scenario. Sperry and Sperry (2020) noted that case conceptualization is essential for counseling students to inform clients of diagnostic, treatment, and clinical formulations. Many responses demonstrated counselor bias, limitations in practical skills and case conceptualization, and minimal depth of knowledge. As found in this study, there was a misdiagnosis of the client’s presenting issue as a mental health disorder and an overemphasis on comorbid symptoms (e.g., failing grades) instead of evaluating these phenomena as a response to the trauma (i.e., TDV). This failure to conceptualize clients accurately leads to improper diagnosis and ineffective treatment.
Interestingly, although the study did not include a requirement to diagnose the fictitious clients, many of the participants still provided a diagnosis. In a systematic review of the literature, Merten et al. (2017) found that misdiagnosis and unintended overdiagnosis of mental health disorders in children and adolescents is likely more common than expected, leading to improper treatment. Qualitative research illuminates how cognitive information processing obscures diagnostic and clinical decision-making (Hays et al., 2009). This phenomenon, known as availability bias, is when clinicians determine the mental health status of clients based on personal experiences or stigma rather than the observable criterion. It is plausible that the counseling students in this qualitative study demonstrated availability bias (based on gender or age), inhibiting their future work with TDV in young clients.
Further, the study’s findings show that many counseling students are unaware of evidence-based interventions to treat TDV appropriately. Students mentioned interventions like cognitive behavioral therapy (CBT), solution-focused therapy, couples counseling, and academic tutoring to reduce client distress and increase self-esteem. Although CBT is a viable treatment approach, none of the responses suggested the implementation of trauma-informed modalities or protocols (such as STAIR; American Psychiatric Association, 2019) for teens recovering from emotional and physical abuse. Trauma-informed approaches focusing on empowerment and advocacy are incredibly powerful in healing relationship trauma (Ogbe et al., 2020). Most strikingly, the counseling students appeared to overlook many critical aspects of treating trauma survivors, including screening, risk assessment, safety planning, and psychoeducation (Ogbe et al., 2020).
A promising aspect of this study is that some counseling students suggested peer support and group therapy as appropriate treatment responses for TDV. Research indicates that school-based peer groups can decrease the rate of abuse among middle and high school–aged students (Ball et al., 2015) and reduce physical dating violence following treatment (Temple et al., 2013). Studies also reveal higher success rates for the prevention of TDV when survivors perceive consistent emotional safety. Factors like school climate, group setting, peer interactions, perspectives on abuse, and opportunities for adaptive skills-building can contribute to survivor care (Ball et al., 2015).
Regarding relationship considerations, only 15 participants noted relationship concerns related to a toxic relationship, regardless of the perpetrator’s gender. Only six of those who indicated relationship discord reported concerns related to sexual abuse or rape. The staggering implication is that novice clinicians cannot identify unhealthy relationship patterns and violence. Research also indicates that young people often misinterpret or minimize partner violence because of unrealistic or distorted relationship beliefs (Eisner, 2021; Walker et al., 2020), continuing into early adulthood with difficulty conceptualizing violence upon entering college (Emelianchik-Key et al., 2022). When clients and clinicians cannot label and conceptualize relationship violence, it leaves room for error in intervention and prevention measures. This extends to the demonstrated lack of knowledge regarding legal, ethical, and clinical responsibilities for treating TDV, particularly within the scope of mandatory reporting laws for the protection of minors. This issue extended to the appropriate disclosure of TDV to parents and caregivers, mainly because young people are more apt to discuss TDV in confidential settings (Cutter-Wilson & Richmond, 2011).
Other practice concerns in the data stemmed from a general inability to conceptualize the presented cases. Although the case vignette highlights academic and interpersonal problems, the client’s presenting problem was TDV. The counseling students neglected to recognize adolescent relationship abuse, leading to the symptomology of academic decline, lowered self-esteem, dysthymia, and isolation (Cutter-Wilson & Richmond, 2011). Recommendations to treat other problems outside of TDV to resolve trauma from abuse can lead to the revictimization of the client by the counselor (Maghsoudi, 2018). Counseling students must be cognizant of their capacity to retraumatize TDV survivors, as victims who perceive any shame or blame during their disclosure may be reluctant to seek help in the future (Maghsoudi, 2018; Walker et al., 2020). Counselor bias is often attributed to poor training at the graduate level (Maghsoudi, 2018). With more informed preparation, counseling students may shift from a pathologized response to a strengths-based approach founded on client self-efficacy and resilience.
Consistent with prior research (Karakurt et al., 2013; Machado et al., 2020; Maghsoudi, 2018; Walker et al., 2020), gender bias was prevalent across all categories and ultimately emerged as an independent category upon final analyses. Gender discrepancies were evident in clinical diagnosis, treatment planning, ethical implications, and client descriptors. Although the content presented in each scenario was identical, counseling students diagnosed the male and female survivors differently. For example, the female survivor was diagnosed with borderline personality disorder and bipolar disorder while the male survivor received depression, anxiety, and ADHD diagnoses. With many criteria for these disorders overlapping, misdiagnosis can occur (Fruzzetti, 2017; Scott, 2017). Yet, gender bias is a common factor in misdiagnosis, especially with a diagnosis of borderline personality disorder, bipolar disorder, and ADHD (Bruchmüller et al., 2012; Fruzzetti, 2017). Counselors perpetuate stigma regarding female survivors by over-pathologizing, minimizing their complaints, and invalidating their feelings (Maghsoudi, 2018).
We contend that the most alarming finding of this study was how the counseling students portrayed several gender disparities when identifying relationship abuse. The divide between gender treatment of TDV was apparent when comparing the counseling students’ view of the female client as a “survivor” and not using strengths-based terminology to identify the male client. Many statements continued to perpetuate societal stigmas about female survivors being passive while male survivors were described as needing to assert “control,” further exacerbating common notions about power and control. A recent qualitative study of male survivors explained that professionals minimized and ridiculed most participants for not being the “stereotypical victim of domestic violence” (Machado et al., 2020, p. 9). Counselors must develop the necessary skills to provide equal support and resources to populations navigating stigma concurrently with TDV (Walker et al., 2020). These findings affirm that even professional counselors are subject to the inherent and socially constructed biases regarding relationship abuse and further emphasize the importance of counselor training to increase one’s professional capacity to treat all survivors of TDV. These outcomes also support a feminist conceptualization of TDV to dismantle gender disparities in treatment and the importance of empowering survivors of all genders experiencing TDV.
Implications for Counselors and Counseling Programs
Collectively, the study’s findings point to the need for enhanced counselor training, reflexivity, and knowledge on the intersection of age, relationship status, violence, and gender issues. Counseling students must understand that relationship violence can happen at any age and has damaging, long-lasting impacts on an adolescent’s well-being, future relationships, and mental health (e.g., depression, suicidal ideation, drug use, self-injury; CDC, 2021; Kann et al., 2018). TDV has detrimental consequences on an adolescent’s psychological well-being and decision-making (CDC, 2021; K. E. Hunt et al., 2022), thus making it critical that counselors do not underestimate the impact dating violence can have on a relationship regardless of age. Because counselors may encounter the presence of relationship violence in teens within various settings (e.g., counseling centers, schools, and universities), they must be familiar with and adept at recognizing and addressing these factors for client safety and aid in ending the abuse cycle.
Although counselor education programs produce very competent and knowledgeable counselors, there remains an inability to comprehensively cover all the necessary content to prepare counselors for working with clients (Henriksen et al., 2010; Khubchandani et al., 2012). Some of these topic areas, like TDV, must be explored further in continuing education. More emphasis must be placed on trauma-informed approaches to assist all clients, including teens in a critical developmental age at which TDV threatens current and future mental health (Foshee et al., 2013; Temple et al., 2013). Strengths-based and advocacy-informed trauma approaches have been influential in healing relationship trauma (Ogbe et al., 2020) by assisting teens in preventing pervasive patterns of violence in future relationships.
At the same time, other relevant factors, such as unacknowledged biases, should be examined personally and within supervision. Counseling students, new professionals, and supervisors must be willing to broach biases and assumptions regarding gender in counseling and supervision to prevent them from affecting clients. Counselors must understand the impact of gender and age on highly stigmatized topics, such as TDV and sexuality, to prevent biases and misunderstandings from guiding assessment and treatment. Counselor educators can teach students about TDV using theoretical lenses that deconstruct stigma. For example, a feminist perspective could lend to classroom dialogue uncovering societal power differentials. At the same time, structural functionalism theory or conflict theory could offer unique lenses to discuss systemic inequities in the quality and delivery of mental health care.
Counselor education programs are essential in helping counseling students develop strong case conceptualization skills that affirm diverse clients and consider strengths-based and trauma-informed interventions. Therefore, counselor training must incorporate instruction and practice for adolescent risk assessment of TDV. Counseling students who gain experience using TDV screening tools may increase their confidence when clinical decision-making is required, such as disclosing abuse. Mandatory reporting is not always transparent for students. Instructional role plays and a review of the limitations of confidentiality may also prompt further growth and development for counseling students, in addition to reviewing state laws and any differences with our profession’s ethical guidelines. Research demonstrates that teens fear the information counselors report to their parents or caregivers from counseling sessions. In contrast, caregivers can often lack the ability to respond appropriately to this information (Black et al., 2015). Thus, counselors must understand the critical role of establishing trust and rapport with teens experiencing TDV to strengthen the therapeutic relationship and ability to work together and increase support and trust within the family system.
Limitations and Future Research Directions
Research findings must always be considered in the context of the existing limitations. One limitation was that the study included a sample of counseling students across three universities in the southern region of the United States and we did not delineate the number of students affiliated with each university. The study may have benefited from a more diverse sample across many CACREP-accredited programs. The students in the study pertained to four different tracks (school, mental health, marriage and family therapy, and rehabilitation counseling), with some non–degree-seeking students and doctoral students. Although this illuminates overarching gaps in the counseling profession, future researchers may examine differences between specializations, allowing for more in-depth assessments and recommendations for training and continuing education.
Additionally, we did not inquire about counseling students’ strategies and decision-making processes to develop their case conceptualizations and treatment decisions. This data would have been beneficial for counselor educators to address these areas early on in training. A final limitation of the study included the use of binary gender identities and heterosexual relationships in the case vignettes. Although the present research may provide a framework for future studies to build upon, it is essential to note that TDV occurs across diverse populations, including LGBTQ+ youth. As such, future research should examine counseling students’ conceptualization of TDV within diverse communities and relationships. This would further illuminate disparities and challenges in the conceptualization and treatment of TDV, shedding light on areas needing attention in counselor training.
Conclusion
Counseling students must develop self-awareness and knowledge of TDV to treat the transgenerational cycle of violence, thereby preventing or addressing potential mental health consequences. To do so, students must understand the etiology of violence, manifestations of violence in relationships, and trauma-informed conceptualization and treatment of violence. Although such training must begin in counselor education programs and continue after graduation (Murray et al., 2016; Wozny, 2005), this study revealed the importance of reflexivity and self-awareness on existing biases, assumptions, and beliefs on TDV. Counselor biases can significantly impact client treatment outcomes (Karakurt et al., 2013). Therefore, personal biases must be recognized early in training to prevent harmful and stigmatizing treatment of clients experiencing TDV.
Conflict of Interest and Funding Disclosure
The authors reported no conflict of interest
or funding contributions for the development
of this manuscript.
References
American Psychiatric Association. (2019). Treating women who have experienced intimate partner violence.
https://www.psychiatry.org/File%20Library/Psychiatrists/Cultural-Competency/IPV-Guide/APA-Guide-to-IPV-Among-Women.pdf
Ball, B., Holland, K. M., Marshall, K. J., Lippy, C., Jain, S., Souders, K., & Westby, R. P. (2015). Implementing a targeted teen dating abuse prevention program: Challenges and successes experienced by Expect Respect facilitators. Journal of Adolescent Health: Official Publication of the Society for Adolescent Medicine, 56(2), Supp. 2, S40–S46. https://doi.org/10.1016/j.jadohealth.2014.06.021
Black, B. M., Weisz, A. N., Preble, K. M., & Sharma, B. (2015). Parents’ awareness of and anticipated responses to their teens’ reports of dating violence. Journal of Family Social Work, 18(1), 3–20.
https://doi.org/10.1080/10522158.2014.968941
Braun, V., & Clarke, V. (2013). Successful qualitative research: A practical guide for beginners. SAGE.
Braun, V., & Clarke, V. (2021). To saturate or not to saturate? Questioning data saturation as a useful concept for thematic analysis and sample-size rationales. Qualitative Research in Sport, Exercise and Health, 13(2), 201–216. https://doi.org/10.1080/2159676X.2019.1704846
Bruchmüller, K., Margraf, J., & Schneider, S. (2012). Is ADHD diagnosed in accord with diagnostic criteria? Overdiagnosis and influence of client gender on diagnosis. Journal of Consulting and Clinical Psychology, 80(1), 128–138. https://doi.org/10.1037/a0026582
Centers for Disease Control and Prevention. (2021). Fast facts: Preventing teen dating violence. https://www.cdc.gov/violenceprevention/intimatepartnerviolence/teendatingviolence/fastfact.html
Clarke, V., & Braun, V. (2018). Using thematic analysis in counselling and psychotherapy research: A critical reflection. Counselling and Psychotherapy Research, 18(2), 107–110. https://doi.org/10.1002/capr.12165
Council for Accreditation of Counseling and Related Educational Programs. (2015). 2016 CACREP standards. http://www.cacrep.org/wp-content/uploads/2017/08/2016-Standards-with-citations.pdf
Cutter-Wilson, E., & Richmond, T. (2011). Understanding teen dating violence: Practical screening and intervention strategies for pediatric and adolescent healthcare providers. Current Opinion in Pediatrics, 23(4), 379–383. https://doi.org/10.1097/MOP.0b013e32834875d5
de Macedo, J. Q., Khanlou, N., & Luis, M. A. V. (2015). Use of vignettes in qualitative research on drug use: Scoping review and case example from Brazil. International Journal of Mental Health and Addiction, 13(5), 549–562. https://doi.org/10.1007/s11469-015-9543-4
Eisner, M. (2021). The gender symmetry problem in physical teen dating violence: A commentary and suggestions for a research agenda. New Directions for Child and Adolescent Development, 2021(178), 157–168. https://doi.org/10.1002/cad.20443
Emelianchik-Key, K., Byrd, R., & Gill, C. S. (2022). Dating violence and the impact of technology: Examining the lived experiences of sorority members. Violence Against Women, 28(1), 73–92.
https://doi.org/10.1177/1077801221998799
Foshee, V. A., McNaughton Reyes, H. L., Gottfredson, N. C., Chang, L.-Y., & Ennett, S. T. (2013). A longitudinal examination of psychological, behavioral, academic, and relationship consequences of dating abuse victimization among a primarily rural sample of adolescents. Journal of Adolescent Health, 53(6), 723–729. https://doi.org/10.1016/j.jadohealth.2013.06.016
Fruzzetti, A. E. (2017, October 3). Why borderline personality disorder is misdiagnosed. National Alliance on Mental Illness. https://www.nami.org/Blogs/NAMI-Blog/October-2017/Why-Borderline-Personality-Disorder-is-Misdiagnose
Goncy, E. A., Sullivan, T. N., Farrell, A. D., Mehari, K. R., & Garthe, R. C. (2017). Identification of patterns of dating aggression and victimization among urban early adolescents and their relations to mental health symptoms. Psychology of Violence, 7(1), 58–68. https://doi.org/10.1037/vio0000039
Hays, D. G., McLeod, A. L., & Prosek, E. (2009). Diagnostic variance among counselors and counselor trainees. Measurement and Evaluation in Counseling and Development, 42(1), 3–14.
https://doi.org/10.1177/0748175609333559
Henriksen, R. C., Jr., Nelson, J., & Watts, R. E. (2010). Specialty training in counselor education programs: An exploratory study. Journal of Professional Counseling: Practice, Theory & Research, 38(1), 39–51.
https://doi.org/10.1080/15566382.2010.12033865
Hughes, R. (1998). Considering the vignette technique and its application to a study of drug injecting and HIV risk and safer behaviour. Sociology of Health & Illness, 20(3), 381–400. https://doi.org/10.1111/1467-9566.00107
Hunt, B. (2011). Publishing qualitative research in counseling journals. Journal of Counseling & Development, 89(3), 296–300. https://doi.org/10.1002/j.1556-6678.2011.tb00092.x
Hunt, K. E., Robinson, L. E., Valido, A., Espelage, D. L., & Hong, J. S. (2022). Teen dating violence victimization: Associations among peer justification, attitudes toward gender inequality, sexual activity, and peer
victimization. Journal of Interpersonal Violence, 37(9–10), 5914–5936. https://doi.org/10.1177/08862605221085015
Kann, L., McManus, T., Harris, W. A., Shanklin, S. L., Flint, K. H., Queen, B., Lowry, R., Chyen, D., Whittle, L., Thornton, J., Lim, C., Bradford, D., Yamakawa, Y., Leon, M., Brener, N., & Ethier, K. A. (2018). Youth Risk Behavior Surveillance – United States, 2017. Morbidity and Mortality Weekly Report Surveillance Summaries, 67(8), 1–114. https://doi.org/10.15585/mmwr.ss6708a1
Karakurt, G., Dial, S., Korkow, H., Mansfield, T., & Banford, A. (2013). Experiences of marriage and family therapists working with intimate partner violence. Journal of Family Psychotherapy, 24(1), 1–16.
https://doi.org/10.1080/08975353.2013.762864
Khubchandani, J., Price, J. H., Thompson, A., Dake, J. A., Wiblishauser, M., & Telljohann, S. K. (2012). Adolescent dating violence: A national assessment of school counselors’ perceptions and practices. Pediatrics, 130(2), 202–210. https://doi.org/10.1542/peds.2011-3130
Machado, A., Hines, D., & Douglas, E. M. (2020). Male victims of female-perpetrated partner violence: A qualitative analysis of men’s experiences, the impact of violence, and perceptions of their worth. Psychology of Men & Masculinities, 21(4), 612–621. https://doi.org/10.1037/men0000285
Maghsoudi, M. (2018). Addressing counselor stigma in working with female intimate partner violence survivors. Journal of Professional Counseling: Practice, Theory & Research, 45(1), 33–44.
https://doi.org/10.1080/15566382.2019.1603015
Merten, E. C., Cwik, J. C., Margraf, J., & Schneider, S. (2017). Overdiagnosis of mental disorders in children and adolescents (in developed countries). Child and Adolescent Psychiatry and Mental Health, 11(5), 1–11.
https://doi.org/10.1186/s13034-016-0140-5
Morris, C. A. W., & Minton, C. A. B. (2012). Crisis in the curriculum? New counselors’ crisis preparation, experiences, and self-efficacy. Counselor Education and Supervision, 51(4), 256–269.
https://doi.org/10.1002/j.1556-6978.2012.00019.x
Murray, C. E., King, K., & Crowe, A. (2016). Understanding and addressing teen dating violence: Implications for family counselors. The Family Journal, 24(1), 52–59. https://doi.org/10.1177/1066480715615668
Nowell, L. S., Norris, J. M., White, D. E., & Moules, N. J. (2017). Thematic analysis: Striving to meet the
trustworthiness criteria. International Journal of Qualitative Methods, 16(1), 1–13.
https://doi.org/10.1609406917733847
Offenhauer, P., & Buchalter, A. (2011). Teen dating violence: A literature review and annotated bibliography. Library of Congress, Federal Research Division. https://www.ojp.gov/pdffiles1/nij/grants/235368.pdf
Ogbe, E., Harmon, S., Van den Bergh, R., & Degomme, O. (2020). A systematic review of intimate partner violence interventions focused on improving social support and mental health outcomes of survivors. PLOS ONE, 15(6), e0235177. https://doi.org/10.1371/journal.pone.0235177
Scott, N. P. (2017). Misdiagnosis or comorbidity: Borderline personality disorder in a patient diagnosed with bipolar disorder. The American Journal of Psychiatry Residents’ Journal, 12(10), 4–5.
https://doi.org/10.1176/appi.ajp-rj.2017.121002
Sperry, L., & Sperry, J. (2020). Case conceptualization: Mastering this competency with ease and confidence. Routledge.
St. Marie, B., Jimmerson, A., Perkhounkova, Y., & Herr, K. (2021). Developing and establishing content validity of vignettes for health care education and research. Western Journal of Nursing Research, 43(7), 677–685. https://doi.org/10.1177/0193945920969693
Swahn, M. H., Alemdar, M., & Whitaker, D. J. (2010). Nonreciprocal and reciprocal dating violence and injury occurrence among urban youth. Western Journal of Emergency Medicine, 11(3), 264–268.
Temple, J. R., Le, V. D., Muir, A., Goforth, L., & McElhany, A. L. (2013). The need for school-based teen dating violence prevention. Journal of Applied Research on Children: Informing Policy for Children at Risk, 4(1), 1–11. https://doi.org/10.58464/2155-5834.1136
Turner, H. A., Finkelhor, D., Hamby, S. L., Shattuck, A., & Ormrod, R. K. (2011). Specifying type and location of peer victimization in a national sample of children and youth. Journal of Youth and Adolescence, 40, 1052–1067. https://doi.org/10.1007/s10964-011-9639-5
Walker, A., Lyall, K., Silva, D., Craigie, G., Mayshak, R., Costa, B., Hyder, S., & Bentley, A. (2020). Male victims of female-perpetrated intimate partner violence, help-seeking, and reporting behaviors: A qualitative study. Psychology of Men & Masculinities, 21(2), 213–223. https://doi.org/10.1037/men0000222
Wozny, D. A. (2005). The prevalence of suicide and violence assessment/intervention courses in CACREP and COAMFTE-accredited counseling curriculums. In G. R. Waltz and R. Yep (Eds.), VISTAS: Compelling perspectives on counseling 2005 (pp. 271–274). American Counseling Association.
Appendix
Female Case Vignette
Jordan is a 17-year-old female in her junior year of high school. Her teacher referred her for assistance from the school counselor after she began struggling academically. Jordan’s parents had also become concerned when Jordan’s grades dropped from As and Bs to Cs and a D in less than one school year, and she had begun isolating herself from her friends, even quitting the basketball team that she had loved.
During her initial session with her school’s guidance counselor, Jordan discussed being increasingly distracted in class and being unable to complete her assignments on time. Jordan also discussed being happy and in her first serious relationship with a boyfriend during this past year but reports that she hasn’t quite felt like herself lately. Jordan disclosed that she quit the basketball team to spend more time with her boyfriend because she wanted to prove her love to him, as he would become anxious whenever she was without him. She states they love each other very much and proves this by spending as much time as she can with him and sharing everything, including the passwords for all her social media accounts. Jordan notes that her boyfriend was more physically experienced with relationships, and her past boyfriends “strayed,” so these were things she wanted to do to make him feel “safe and secure.” She also stated that she had past relationships, but nothing serious or that went beyond kissing. The couple recently advanced in their sexual relationship because her boyfriend said he couldn’t date someone who wasn’t physically and emotionally close to him. Jordan didn’t want to lose him and went ahead with what she called the “next step” in their sexual relationship so he would not break up with her.
Jordan wasn’t sure why her grades were slipping but said things were fine at home, and she loved having a boyfriend. She appears to discuss her friends and basketball teammates fondly, but says her relationship is better without them. When Jordan was in basketball, her boyfriend would call and text her 20 plus times after practice let out until he heard back. She said quitting helped with his anxiety and her stress of dealing with all the calls. She stated that she had no energy to commit to basketball or hanging out with friends. Her focus was on school and her boyfriend.
Jordan appeared willing to try to improve her grades and said her boyfriend and parents supported these efforts. She reports her boyfriend has been tutoring her and helping her study when they are together because he told her he doesn’t want a “stupid girlfriend.” Jordan reports this as “playful teasing” and his “way to motivate” her. Jordan wants to go to college, but she is concerned that her recent drop in grades will affect her school admission. She is unsure why she cannot concentrate. She has been tired lately and said she’s just “in a funk” that she needs to shake off.
Her parents reported wanting her grades to improve, and Jordan seems preoccupied lately. Her parents don’t know how to improve her focus in school and at home but seem supportive. They said they appreciate her boyfriend’s “tutoring” as Jordan refers to it. Jordan was cooperative and pleasant in the session.
Note. The case vignette presented here is that of a female teen client. An identical vignette for a male teen client was also utilized during the study. The only difference in cases was the identified gender of the client and their partner; names, scenarios, and all non-gendered wording remained the same.
Questions
- Provide a brief case conceptualization for this client. Be as specific as possible and note any clinical impressions.
- What is your diagnosis (if you feel one is warranted) or any diagnostic impressions related to Jordan’s behaviors? Please be specific and include any V codes if you believe they are justified.
- What would be your treatment approach when working with Jordan, and what areas would be your treatment goals for Jordan?
- Are there any relationship considerations to incorporate in your work with Jordan?
- Are there any additional clinical or practice concerns you might have in working with Jordan?
- Is there anything else you would like to share about working with Jordan that has not been mentioned elsewhere?
Kelly Emelianchik-Key, PhD, NCC, ACS, LMFT, LMHC, is an associate professor at Florida Atlantic University. Bridget Glass, PhD, LMHC, is an assistant professor at South University. Adriana C. Labarta, PhD, LMHC, is an assistant professor at Florida Atlantic University. Correspondence may be addressed to Kelly Emelianchik-Key, 777 Glades Road, Bldg 47, Room 275, Boca Raton, FL 33431, Kemelian@fau.edu.
Aug 24, 2023 | Volume 13 - Issue 2
Kyoung Mi Choi, Jung H. Hyun
This study, using a transcendental phenomenological approach, explored the perceptions and experiences of school counselor trainees participating in a self-care course grounded in mindfulness and social–emotional learning. Seven students who enrolled in a master’s-level school counseling program and completed a summer self-care course shared their experiences, leading to the identification of five key themes: (a) recognizing the importance and need for self-care, (b) cultivating a nonjudgmental mindset toward challenging emotions, (c) integrating self-care into both personal and professional settings, (d) an increase in compassion and empowerment, and (e) a commitment to ongoing learning and advocacy. The school counselor trainees’ narratives highlight the importance of self-care as a way to reclaim power within themselves and become change agents in their school communities.
Keywords: school counselor trainees, self-care, mindfulness, social–emotional learning, advocacy
The COVID-19 pandemic has dramatically changed the way we live, work, learn, and interact on a daily basis, making self-care a crucial topic of discussion in both schools and workplaces (Harrichand et al., 2021; Norcross & Phillips, 2020). Many K–12 students are facing increased emotional distress and mental health issues, such as high levels of anxiety, depression, and post-traumatic symptoms (Chen et al., 2020; Marques de Miranda et al., 2020; Prime et al., 2020). At the same time, school counselors are also struggling with issues such as fatigue, burnout, and even vicarious trauma (Parker & Henfield, 2012), along with other challenges like high workloads, uncertainty about their role, and a lack of perceived support and professional development opportunities (Savitz-Romer et al., 2021). This makes self-care for school counselors and trainees more critical now than ever before (Harrichand et al., 2021).
Self-care refers to engaging in activities or behaviors that promote one’s overall wellness and prevent burnout (Christopher et al., 2016). This concept can also be expanded to include a larger sense of self-care that encompasses embracing one’s humanity; increasing awareness of internalized negative cultural messages; and fostering a positive cultural identity that embraces one’s heritage and community strengths, assets, traditions, and legacy (Duncan-Andrade & Morrell, 2008). Some scholars view self-care as the start of personal power (hooks, 1994) and a process of humanization in education that is reciprocal, anti-oppressive, and supportive of collective well-being (Paris & Winn, 2013). Additionally, many educators and scholars believe that dismantling oppressive ideologies and power structures is an important objective in the transformative process of self-care, which involves critical self-reflection, recognition of dehumanization, and reclaiming agency (Berila, 2016; Freire, 1970/2000; hooks, 1994; Litam & Hipolito-Delgado, 2021).
The significance of self-care has led to it being viewed not just as an individual responsibility, but also a professional one. Leading counseling organizations, such as the American Counseling Association (ACA) and the Council for the Accreditation of Counseling and Related Educational Programs (CACREP), consider self-care to be a crucial aspect of a mental health professional’s duties. The ACA Code of Ethics (2014) states that “counselors engage in self-care activities to maintain and promote their own emotional, physical, mental, and spiritual well-being to best meet their professional responsibilities” (p. 8). The CACREP (2015) standards, under the Professional Counseling Identity section, include standards for counselor education programs that emphasize self-care strategies appropriate to the counselor role (Section 2.F.1.i). The American School Counselor Association (ASCA; 2019) promotes the monitoring of “emotional and physical health and practice wellness to ensure optimal professional effectiveness” for school counselors (p. 7).
However, despite the recognition of self-care as an ethical responsibility, most counseling training programs do not incorporate it as part of their curriculum (Chen et al., 2020; Christopher & Maris, 2010; Shapiro et al., 2007). Lack of time, academic pressure, and the absence of guidance and faculty role models are cited as barriers (Campbell & Christopher, 2012; Christopher & Maris, 2010; Nelson et al., 2018). Nevertheless, there is a pressing need for self-care strategies to be included in counselor training and curriculum (Mitchell & Binkley, 2021). This study utilized transcendental phenomenology to investigate the essence of self-care experiences among school counseling trainees who participated in a 10-session seminar course that focused on mindfulness and social–emotional learning (SEL).
Literature Review
Mindfulness as Humanizing Process in Self-Care
The integration of mindfulness as a self-care practice into counseling training and programs has been widely adopted over the past three decades (Bohecker & Horn, 2016; Bohecker et al., 2016; Campbell & Christopher, 2012; Christopher & Maris, 2010; Shapiro et al., 2007). Research has shown that mindfulness can lead to numerous benefits, including reduced levels of anxiety and depression, enhanced life satisfaction, increased social connection, optimism, tolerance, empathy, and self-efficacy (Bohecker & Horn, 2016; Bohecker et al., 2016; Brown & Ryan, 2003). Christopher and Maris (2010) asserted that incorporating mindfulness practices into counselor training programs could help reduce burnout, compassion fatigue, and other stress-related physical and psychological symptoms by providing education in self-care and stress management. Furthermore, Shapiro and his team (2007) found that Mindfulness-Based Stress Reduction training had a significant impact, decreasing stress levels, negative affect, rumination, and anxiety, and boosting positive affect and self-compassion.
Moreover, mindfulness is more than just a form of relaxation, but a transformative and proactive approach to self-care. It involves increased awareness of internalized negative cultural messages and the cultivation of a positive cultural identity (Duncan-Andrade & Morrell, 2008). The practice of mindfulness can lead to critical self-reflection and bring to the surface issues of power and privilege, and through deep reflection and honest dialogue, can support the process of humanization and the dismantling of oppressive ideologies (Berila, 2016; del Carmen Salazar, 2013).
Given the high levels of stress and burnout that school counselors commonly experience, prioritizing self-care practices is crucial for maintaining their personal and professional well-being. Mindfulness-based self-care has emerged as a promising approach for addressing these challenges and provides a unique opportunity for school counselors to reflect on their identities within societal and cultural contexts. Additionally, the SEL framework can be helpful in self-care training by outlining specific skills essential for managing stress, fostering well-being, and developing advocacy in both personal and professional contexts.
Social–Emotional Learning
SEL is defined as “the process in which children enhance their ability to integrate thinking, feelings, and behaving to achieve important life tasks” (Zins et al., 2007, p. 194). The Collaborative for Academic, Social, and Emotional Learning (CASEL) outlines five core competencies of SEL: self-awareness, self-management, social awareness, relationship skills, and responsible decision-making (CASEL, 2023a). CASEL’s mission is to make SEL a fundamental aspect of every child’s education through offering training and educational opportunities to advance scientific research, assessment, and implementation of effective SEL practices in schools (CASEL, 2023b). Numerous studies have demonstrated the positive impact of SEL programs on students’ growth (Carrell & Carrell, 2006; Durlak & DuPre, 2008; Lapan & Harrington, 2009).
Despite the positive effects of SEL in education, its traditional definition has faced numerous criticisms for its inadequacy in addressing equity and justice issues in classrooms and the educational system in light of recent racial and gender awareness. Higheagle Strong and McMain (2020) argued that the traditional SEL approach reinforces oppressive ideologies by valuing White, middle-class knowledge systems above others, portraying marginalized students as troubled and incompetent, and perpetuating injustice. With a growing emphasis on cultural responsiveness in the SEL definition (Higheagle Strong & McMain, 2020; Jagers et al., 2019), a critical question arises: “Are we teaching individual students to manage their emotions and behaviors simply for the sake of upward mobility or recognize and reclaim their emotions and relationships as fuel for social and cultural healing and transformation?” (Camangian & Cariaga, 2021, p. 16).
CASEL subsequently revised their definition of SEL and introduced a new concept of transformative SEL, defined as “a process whereby students and teachers build strong, respectful relationships founded on an appreciation of similarities and differences; learn to critically examine root causes of inequity; and develop collaborative solutions to community and social problems” (Jagers et al., 2018, p. 2). This updated definition acknowledges existing educational disparities and places an emphasis on authentic partnerships between schools, families, and communities. It also calls for a re-examination of the curriculum, instructional methods, and evaluation systems. Educators are encouraged to adopt an equity-focused lens when assessing the five core SEL competencies, asking questions such as “What are the social dynamics among students from different backgrounds in your class? Do you view these differences as a liability or an asset?”, “How do you create an inclusive and safe learning environment for all your students?”, and “Are there policies or practices in your school that prevent your students from receiving the quality education they deserve?”
Overall, the principles of SEL are closely aligned with the goals of school counseling, particularly in developing the skills necessary for promoting the social, emotional, and cognitive development of their students and promoting equity, social justice, and cultural competence necessary for supporting diverse student populations. School counselors can leverage SEL strategies to create a welcoming and inclusive environment that fosters learning, resilience, and well-being among students. Van Velsor (2009) emphasized the role of school counselors as SEL consultants, empowering students to achieve their personal goals and promoting prosocial behaviors, with the ultimate aim of improving the well-being of both the school and society.
Self-care has been integrated into the ethical standards of school counselor preparation programs (Christopher et al., 2016; Nelson et al., 2018), and mindfulness is often taught and studied in these programs (Campbell & Christopher, 2012; Christopher & Maris, 2010). However, there has been a lack of research investigating the experiences of school counselor trainees when learning and practicing self-care alongside mindfulness and SEL competencies in counselor education. In this study, we created and implemented a self-care curriculum for school counseling trainees and examined how this curriculum impacted their personal and professional lives through the use of transcendental phenomenology. The goal was to delve into the experiences of master’s students who took part in a summer course on self-care that was grounded in both mindfulness and SEL.
Methodology
The transcendental phenomenological investigation is often used in research to explore individuals’ subjective experiences and perceptions of a particular phenomenon (Giorgi, 2009; Moustakas, 1994). Using this approach, we aimed to explore the school counseling trainees’ thoughts, feelings, and behaviors of the personal and professional changes in the areas of self-awareness, self-management, social awareness, relationship skills, and responsible decision-making. The umbrella research question that guided this study was “What is the essence of the lived experiences of self-care of school counseling trainees who took 10 seminar sessions grounded in mindfulness and SEL in a master’s-level counseling program over a 5-week period?” Semi-structured interview questions were used to explore the participants’ experiences in their own words, which are detailed in Appendix A. After the approval from the IRB, we invited counseling trainees to participate in the study and followed the three steps of Moustakas’s (1994) transcendental approach: (a) the epoche, (b) the eidetic reduction, and (c) the transcendental reduction in data analysis.
Participants
The purposive sampling method outlined by Glesne (2011) was utilized to select participants for the study. Invitations were extended to all 15 students who had completed the EDCO 298 Seminar in Professional Counseling during the summer course. Based on the guidelines set by Polkinghorne (1989), a sample size of 5–25 individuals is recommended for a phenomenological study. Seven participants, who were female graduate students in the counselor education program, agreed to take part in the study through in-depth interviews. The participants were between the ages of 21 and 45 and attended a single, midsized, public university designated as a Hispanic-Serving Institution in Northern California, United States. Five of the participants identified as Hispanic, Mexican, or Latinx, while two identified as White.
Data Collection
The data for this study was collected through qualitative interviews with individuals who had completed a summer course, EDCO 298 Seminar in Professional Counseling, taught by Kyoung Mi Choi. To ensure impartiality and minimize the impact of the professor’s influence, three precautions were taken: (a) participants were contacted at least 14 days after the course had ended and their grades were posted, (b) they were informed that participation in the study was voluntary, and (c) all interviews were conducted by Jung Hee Hyun, who had no association with the program and held no power over the students’ grades.
Description of the Course
In summer 2020, Choi created an online 5-week course called EDCO 298 Seminar in Professional Counseling, which is detailed in Appendix B. The focus of the course was on self-care, combining six mindfulness core values (such as presence, gratitude, and compassion) and the five SEL competencies framework (self-awareness, self-management, social awareness, relationship skills, and responsible decision-making). The course was attended by 15 master’s-level school counseling students. The aim of the class was to encourage and inspire the students to make a deeper connection with their thoughts, emotions, and physical well-being.
The objectives of the course were to (a) explore the five SEL competencies, (b) explore the mindfulness-based self-care and SEL interventions for counseling and personal growth, (c) understand the effectiveness of the SEL tools and practice mindfulness in daily life, and (d) create a workshop that serves the community the student hopes to serve. The instructor’s role was to create a supportive and safe environment in which students could share their personal narratives and experiences, including their strengths, cultural assets, resilience, privilege, discrimination, and oppression. Throughout the course, various mindfulness practices were utilized, such as collective breathing, body scan, mindful walking, mindful eating, mindful speaking, journaling, storytelling, visualization, and meditation.
Individual Interviews
After the summer session was over, Choi’s counselor education department gave permission to announce the research project via email. Those who showed interest in participating were given a research packet containing details of the study, informed consent, and a demographic sheet, as well as contact information for further inquiries. At every stage of the recruitment and research process, it was emphasized that participation or non-participation in the study would not affect the participants’ course credit or final grade. To be eligible for the study, participants had to meet the following criteria: (a) enrolled in the counselor education program, (b) completed the summer seminar, (c) successfully finished the entire course, and (d) willing to participate in a voluntary lengthy interview.
Once students agreed to participate in the study and submitted their informed consent, contact information, and demographic questionnaire (including a pseudonym, gender, age, self-identified ethnicity, and specialization), they were individually interviewed by Hyun through Zoom. The interviews lasted for approximately an hour and followed a semi-structured format consisting of 16 open-ended questions asked in a consistent order (see Appendix A). The interviews were recorded in their entirety and then transcribed by a graduate student who was not affiliated with the study. After being reviewed by the participants and analyzed by the researchers, the audio recordings were deleted. To maintain the confidentiality of the participants, only pseudonyms were used in all written materials.
Data Analysis
The research methodology employed by the team was transcendental phenomenology (Moustakas, 1994), aimed at uncovering the fundamental nature of human experience (Moerer-Urdahl & Creswell, 2004). NVivo12, a qualitative data analysis software by QSR International (2018), was utilized for data storage, coding, and retrieval. To analyze the data, we followed Moustakas’s (1994) steps for data analysis, which involved the following process: (a) the researchers reflected on and recorded their own experiences of self-care, mindfulness, and critical consciousness before, during, and after data collection; (b) the transcripts were imported into NVivo12, and key statements that provided insight into the participants’ experiences of self-care were highlighted (horizontalization); (c) themes were formed by summarizing these significant statements (cluster of meanings); (d) the significant statements and themes were used to describe the participants’ experiences as a collective whole (textural description); (e) the context that influenced the participants’ experiences of self-care was described using the significant statements and themes (imaginative variation/structural description); and (f) a synthesis of the meanings and essence of the experience was provided by integrating all of the textual and structural descriptions into a universal description.
Reflexivity Statement
Choi is a professor and holds a master’s degree in school counseling and international relations, as well as a doctorate in counselor education and supervision. She has been teaching at the master’s level for over a decade and has received extensive training in mindfulness, yoga, and SEL. Hyun is an associate professor specializing in school counseling and holds a master’s degree in school counseling and a doctorate in counselor education. She provides counseling and consultation to children and parents using play therapy and multicultural counseling interventions. Choi taught the course that the study is based on, while Hyun conducted the participant interviews. Both Choi and Hyun have prior experience in qualitative research and are dedicated to promoting multiculturalism and social justice in counselor education.
In our research, we utilized the epoche technique, which involves temporarily setting aside our preconceived beliefs and assumptions about self-care to approach the research with an open mindset. Throughout the research process, we made a conscious effort to examine and clarify our assumptions to avoid potential biases. We also practiced reflexivity by reflecting on our own positionality and how it could affect our assumptions and interpretations of the data. This approach helped us to ensure that our findings were based on the actual experiences and perspectives of the participants, rather than on our own assumptions. Our assumptions about self-care included the following: (a) the importance for counselors to be responsible about self-care; (b) the impact of self-care practice on both personal and professional life; (c) the necessity for counseling programs to provide specific tools and strategies to support students in developing the knowledge and skills for self-care; (d) the holistic approach of self-care, encompassing cognitive, emotional, physical, interpersonal, and spiritual well-being; (e) the gradual development and continual practice required for self-care ability; (f) the possibility of self-care looking different based on individual and cultural backgrounds; and (g) the transformation process of self-care, facilitating the humanization process, increasing awareness of internalized oppressive messages and cultural identities and leading to individual and collective liberation.
Establishing Trustworthiness
In order to enhance the reliability and validity of the study, we employed the use of an external auditor and member checking (Glesne, 2011; Hays & Wood, 2011; Lincoln & Guba, 1985). The external auditor, a research assistant with previous experience in phenomenological approaches but no prior knowledge of self-care or mindfulness research, was appointed to assist in increasing the credibility of the study. The external auditor reviewed the research process, examined the interview process for potential biases, and verified the interpretations of the data. Additionally, we utilized member checking, in which we presented emergent themes and interview content to the participants to ensure their agreement with the written comments and to check for any additional information or edits.
Findings
We identified five themes that reflect the perceptions and experiences of school counseling trainees regarding self-care grounded on mindfulness and SEL: (a) recognizing the importance and need for self-care, (b) cultivating a nonjudgmental mindset toward challenging emotions, (c) integrating self-care into both personal and professional settings, (d) an increase in compassion and empowerment, and (e) a commitment to ongoing learning and advocacy. These themes, which capture the essence of the participants’ experiences, are contextualized as follows.
Theme One: Recognizing the Importance and Need for Self-Care
Participants in a summer course focused on self-care were aware of their motivations and inspiration for registering for the course. They reported their experiences of struggle and challenges in their lives, particularly during the COVID-19 pandemic. Elizabeth stated, “I was facing personal challenges. This course arrived just when I needed it the most.” Sophia added, “I was struggling with intense emotions during the lockdown period and had doubts about myself. But after taking the first class, I felt that it was meant for me.”
Despite the eagerness of all participants to gain knowledge on self-care, they lacked a clear understanding of the concept. The term “self-care” had been mentioned in other classes within the counseling program, but the application of self-care through mindfulness and SEL was unfamiliar to most of them. Daisy expressed:
I never truly comprehended the meaning of connecting with oneself, which requires dedicating time for personal reflection within daily activities and establishing a connection with one’s body and emotions. This was a new idea for me, as I had not previously implemented or even recognized its significance before participating in the course.
The participants were amazed to discover the relationship between their body, mind, emotions, and nature when they made time for self-reflection and self-care. Stacy expressed, “I never considered the idea of self-care before. This class has shown me that some of the things I already do actually fall under the category of self-care.” Sophia also said, “Self-compassion, I did hear about it or read about it, but I never truly dedicated myself to practicing it.” Furthermore, Stacy added, “I never realized the importance of having a complete connection between the body and nature.”
Theme Two: Cultivating a Nonjudgmental Mindset Toward Challenging Emotions
The participants shared their difficulties in managing emotions such as anxiety, depression, anger, disappointment, uncertainty, and shame. They found learning practical mindfulness strategies to recognize and process these emotions without judgment to be helpful. Elizabeth shared how she connected with her body and was able to understand the physical and emotional cues signaling her needs through increased self-awareness:
I have always been constantly on the move and never took the time to acknowledge my physical and emotional well-being. This class taught me the importance of paying attention to my body’s signals, both physical and mental, signaling the need to slow down. I learned to recognize signs, such as backaches, sore muscles, and headaches, and to listen to what they are trying to tell me about my overall well-being.
Sara echoed, saying, “Self-awareness is about embracing and loving myself.” Veronica, who identified as an immigrant, shared her insight on the impact of self-compassion and a shift in perspective:
As an English learner, I often get nervous during public speaking or classroom presentations because I self-doubt. That’s where self-compassion has played a crucial role for me. Instead of viewing myself as someone who doesn’t speak perfect English, I see myself as someone who has accomplished much despite being an immigrant. I used to struggle with low self-confidence, but after being introduced to self-compassion, it has opened my eyes to see everything as a growth opportunity rather than a potential failure. It’s about focusing on what you have, rather than what you lack, and viewing yourself as a human being like any other. This shift in perspective has been healing.
Carol explained how the class aided her in processing challenging emotions, saying “I learned to create space between myself and my emotions, have more control over impulsive emotions, and take breaks to have fun or engage in self-care.” Daisy summarized her approach to dealing with challenging emotions by saying, “The course taught me that it’s okay to accept my feelings, allowing myself to experience them without judgment. I understand that they are temporary and by processing them, I am able to let them go.”
Theme Three: Integrating Self-Care Into Both Personal and Professional Settings
A strong connection between understanding the importance of self-care and its practical application in daily life was evident in the narratives of all participants. They explored, experimented with, and reinforced a variety of self-care strategies both in and outside of class. Sophia stated, “The class helped me to become more patient, and I now practice those techniques daily.” Elizabeth also spoke of the impact of the class and her daily self-care practices:
I realized the enormous benefits of taking time for myself, both in the morning to start my day and in the evening to relax. Practicing mindfulness and self-care, such as staying aware of my body’s signals through yoga, stretching, and breathing, has been incredibly helpful. My physical healing has become a path to emotional healing. I’m making a conscious effort to care for myself. The class was the perfect introduction to this.
Veronica echoed similar experiences in implementing what she learned from the course.
I feel like I gained a lot from this course because we were able to put what we learned into practice. This class provided a deeper understanding of the subject through reading and trying different practices such as meditation and deep breathing. I’ve made a conscious effort to practice mindfulness daily, instead of only when I felt the need. Currently, I’ve been more consistent and practice it at least five times a week.
Positive and affirmative perspectives toward oneself transformed the participants’ relationship with themselves. Sophia described this transformation by saying, “Since taking the class, I have become a different person. By different, I mean that I approach things differently and I don’t feel stressed out as much. I am able to identify and process my emotions, and accept them.” She explained how her 5-minute mindfulness practice changed her challenging relationship:
Mindfulness allows me to connect with myself, to disconnect from external distractions. I only need 5 minutes of silent meditation to feel that inner connection. If I have an issue or conflict with someone in my family, I take those 5 minutes to disconnect from the story, reflect, and become more relaxed.
Theme Four: An Increase in Compassion and Empowerment
The participants, who exuded confidence and a newfound sense of self-care, expressed their eagerness to assist others in their own self-care journeys. They saw their role as school counselors as being further strengthened, and they showed a keen interest in exploring effective mindfulness and self-care techniques. Veronica stated, “I am confident that offering emotional support online will be just as impactful as in person. I now have a wider range of tools and activities to support my students.” Sophia also shared how her newfound sense of empowerment has made her more compassionate toward her students, saying:
I have changed. Our learning has taught me that my students are the most important individuals sitting in front of me in my counseling offices . . . my goal in supporting them is to acknowledge their opinions, feelings, and emotions. I care about all that they are experiencing, not just their issues but also their emotions. I have gained more empathy for them and strive to provide them with the best support I can.
Elizabeth stated, “As a future school counselor, I am confident that incorporating mindfulness practices into my work will have a positive impact on my interactions with students, staff, and teachers. I have learned these techniques in class and am eager to put them into practice.” Daisy shared her engagement with her students, saying:
At times, I can feel overwhelmed by the volume of students I see in a day and the diverse range of topics discussed. However, by taking the time to connect with myself and acknowledge my emotions, I find that I am more grounded after a workday. This has also helped me form stronger connections with my students.
Carol also expressed that mindfulness can rejuvenate one’s energy and foster positive relationships with oneself and others:
When you have a student who requires a lot of your energy, and you find yourself feeling depleted afterwards, it can be challenging to give your best to the next student. I think it’s important to learn how to recharge quickly so that each student receives the best version of you. With the pandemic, it’s even more crucial to meet the students’ needs academically, emotionally, and for career and college planning. What I have found is that students especially need emotional support because of the stress caused by COVID-19.
Theme Five: A Commitment to Ongoing Learning and Advocacy
The participants recognized the significance of self-care and appreciated their capacity to support others with openness, curiosity, and empathy without any judgments. They viewed self-care and mindfulness as a never-ending journey of learning and personal growth. They expressed their determination to continue their mindfulness-based self-care journey. Elizabeth described the process of healing as like a domino effect, in which one positive change can lead to a chain of similar changes in other areas of life: “Healing one aspect of my life has a positive impact on other parts as well. I’m excited to attend workshops and read more to further my mindfulness journey.” Daisy spoke of her strengthened connection with her students, saying “I feel like I am able to better communicate with my students. I strive to offer them a warm and caring presence, and I am being transparent and accepting of their diverse cultural backgrounds.”
Sara explained her practice with her family, saying, “I have been continuing to study and practice throughout the summer and have been sharing and discussing with my family members. This has been a really healing experience for our family.” Sophia also emphasized the importance of continuing her practice, stating:
Healing is a process, and it doesn’t happen overnight. However, it does help us become better people, improve our connections with others, become better listeners, judge less, and listen more to ourselves. This class has had a truly positive impact on me, and I plan to continue my mindfulness practices.
Advocacy is seen as a natural progression. Stacy also expressed her commitment to practicing alongside her students, saying, “It’s important to understand the importance of congruence in both teaching and life. If I just tell my students what to do, they won’t listen. But if I practice alongside them, it’s more effective.” Sophia spoke about the power of sharing mindfulness practices and their impacts with others, stating,
As a counselor and advocate for these techniques, I want to bring them into the K–12 education system at an early age. I hope to introduce these practices wherever I go and to our students, as I believe everyone can benefit from them.
Discussion
The five themes embody the significance and definition of self-care grounded in mindfulness and SEL for graduate students in counseling who took a summer self-care course. Participants reported a new experience in self-discovery through the practice. Despite the difficulties brought by the COVID-19 pandemic and the shift to online education, learning about self-care helped them cope with daily stress. By participating in a group, they discovered their personal and professional understanding of self-care. They learned how to connect with their emotions, physical sensations, thoughts, and others in their relationships. Particularly, they emphasized the importance of embracing difficult emotions. The self-care grounded in mindfulness and SEL taught in the course enabled them to face emotions such as anger, disappointment, anxiety, uncertainty, and shame with nonjudgment and acceptance. The students connected their understanding of self-care with their daily practices both in and outside of the class. The consistent and dedicated practice demonstrated a true embodiment of self-care among the participants.
Along with displaying great confidence in themselves and their self-care practices, the participants strongly expressed their desire to help others in their communities. Their professional identity as school counselors was enhanced, and the participants developed agency to empower underserved students and communities by introducing self-care strategies and mindfulness practices. After completing the course, the participants expressed their intention to continue the practice and viewed self-care and mindfulness as a lifelong journey.
These findings align with previous qualitative studies (Baker, 2016; Bohecker & Horn, 2016; Campbell & Christopher, 2012; Christopher et al., 2011, 2016; Christopher & Maris, 2010) on the experiences of master’s-level students in mindfulness self-care courses. Across these studies, a common theme is that students reported substantial changes in both their personal and professional lives. This included increased confidence in their professional and interpersonal relationships, a greater appreciation for their physical well-being, healthier lifestyle choices, and the ability to handle challenging situations more effectively.
Furthermore, the significance of the current study is to confirm that self-care is imperative for counselor training. As the participants expressed their sense of empowerment and desire to engage in creating and providing workshops for their families, schools, and communities, they demonstrated self-care as part of social and cultural advocacy. There was a clear shift from a deficit- to a strengths-based self-identity regarding linguistic ability, emotional availability, and a healing-focused process. This is consistent with the role of school counselors, as system change agents need to critically examine dominant culture and its impact on their own racial identity development, power, privilege, and oppression in educational settings (Mitchell & Binkley, 2021). Before disrupting and dismantling the oppression and power in the system, school counselors will need to embrace themselves wholly and consider using themselves as a tool in advocating for those in need. When serving diverse students and communities, self-care goes beyond relaxation and self-awareness of one’s own thoughts and emotions. It also involves reclaiming power within oneself—physically, emotionally, spiritually, and culturally.
Implications
The study’s results have significant implications for counselor educators. First, student readiness is crucial for the maximum impact of self-care courses. What is noticeable in the findings is that the students were ready to change as they chose the course and had a strong desire to learn more about self-care. When students are prepared, the impact can be powerful. Additionally, students who accepted themselves, both strengths and weaknesses, and experienced the mind–body–spirit connection had a greater awareness of themselves and felt more prepared to serve others. The study suggests that self-reflection is essential to maintaining an ethical practice when working with people of different identities, values, and cultures. The participants in this study emphasized their humanity by accepting their identities, processing challenging feelings, practicing self-compassion, and sharing their experiences and knowledge to empower others.
Second, the study recommends that counselor education programs incorporate a self-care course or workshop into their curriculum, as it has been shown to have a positive impact on pre-service counselors (Harrichand et al., 2021). Students’ strong desire to learn more about mindfulness and self-care is consistent with the literature (Baker, 2016) and shows the urgency of incorporating mindfulness practice, SEL, and self-care practice in the school counseling curriculum. The participants recommended offering the course every year and an advanced level later in the program. Because of logistical difficulties, it may be more practical to integrate self-care knowledge and practice into existing coursework and programs rather than adding an extra course.
Lastly, many studies on mindfulness, SEL, or self-care do not give enough importance to humanization, agency, inclusion, and equity in the individual and collective self-care process (Mitchell & Binkley, 2021). This study suggests that it is essential to include mindfulness in personal as well as social and cultural transformative processes. Participants expressed increased agency and advocacy during and after learning and practicing self-care. The self-care course can cultivate and strengthen the capacity to imagine a world beyond the current social conditions with confidence in the ability to bring change through individual and collective efforts (Pyles, 2020).
Limitations and Future Research
The authors of the study acknowledge that self-selection may have contributed to biases in the findings, as participants who enrolled voluntarily in the summer elective course showed strong interest in the research topic (Lavrakas, 2008). They also volunteered to share their experiences, which could have resulted in them focusing on positive and socially desirable narratives. The authors of the study also acknowledge that factors such as the class format, selected activities, and instructor’s teaching styles may have contributed to the participants’ experiences, which may not be generalizable to other school counseling trainees and programs. For future research, a study exploring how master’s students with different placements (i.e., pre/post-practicum, internship) or cultural identities (ethnicity, sexual and gender identity, religion, generation) experience and practice self-care could provide valuable insights to counselor educators. Additionally, a quantitative study using pre- and post-surveys to assess progress in the five SEL competencies can provide useful data for counselor educators and researchers to understand students’ social–emotional development.
Conclusion
This study examined the experiences of school counselor trainees in a self-care course based on mindfulness and SEL, consisting of 10 seminar sessions over 5 weeks. The findings revealed information about the transformation process, the importance of self-care in counseling preparation programs, and the empowering effects on graduate students becoming agents of change. Participants experienced a transformation leading to a change in their relationship with their mind, body, and emotions, and this transformation extended to their relationships with family, friends, students, and colleagues, empowering them to be more engaged with their communities and society. They embodied Carl Rogers’s (1980) core conditions for change, including unconditional positive regard, genuineness, and empathy (Campbell & Christopher, 2012), both personally and professionally, describing the experience as encountering a new self through fresh eyes.
Conflict of Interest and Funding Disclosure
The authors reported no conflict of interest
or funding contributions for the development
of this manuscript.
References
American Counseling Association. (2014). ACA code of ethics. https://www.counseling.org/docs/default-source/default-document-library/2014-code-of-ethics-finaladdress.pdf
American School Counselor Association. (2019). The ASCA national model: A framework for school counseling programs (4th ed.). https://www.schoolcounselor.org/About-School-Counseling/ASCA-National-Model-for-School-Counseling-Programs
Baker, S. (2016). Working in the present moment: The impact of mindfulness on trainee psychotherapists’ experience of relational depth. Counselling and Psychotherapy Research, 16(1), 5–14.
https://doi.org/10.1002/capr.12038
Berila, B. (2016). Mindfulness as a healing, liberatory practice in queer anti-oppression pedagogy. Social Alternatives, 35(3), 5–10. https://socialalternatives.com/wp-content/uploads/2021/02/berila_soc_alt_vol_35_3.pdf
Bohecker, L., & Horn, E. A. D. (2016). Increasing students’ empathy and counseling self-efficacy through a mindfulness experiential small group. The Journal for Specialists in Group Work, 41(4), 312–333.
https://doi.org/10.1080/01933922.2016.1232322
Bohecker, L., Vereen, L. G., Wells, P. C., & Wathen, C. C. (2016). A mindfulness experiential small group to help students tolerate ambiguity. Counselor Education and Supervision, 55(1), 16–30.
https://doi.org/10.1002/ceas.12030
Brown, K. W., & Ryan, R. M. (2003). The benefits of being present: Mindfulness and its role in psychological well-being. Journal of Personality and Social Psychology, 84(4), 822–848. https://doi.org/10.1037/0022-3514.84.4.822
Camangian, P., & Cariaga, S. (2021). Social and emotional learning is hegemonic miseducation: Students deserve humanization instead. Race Ethnicity and Education, 25(7), 901–921.
https://doi.org/10.1080/13613324.2020.1798374
Campbell, J., & Christopher, J. (2012). Teaching mindfulness to create effective counselors. Journal of Mental Health Counseling, 34(3), 213–226. https://doi.org/10.17744/mehc.34.3.j75658520157258l
Carrell, S. E., & Carrell, S. A. (2006). Do lower student to counselor ratios reduce school disciplinary problems? Contributions to Economic Analysis & Policy, 5(1), 1–24. https://www.schoolcounselor-ca.org/files/Advocacy/Lower%20Counselor%20Ratios%20Equal%20Less%20Discipline.pdf
Chen, S., Cheng, Z., & Wu, J. (2020). Risk factors for adolescents’ mental health during the COVID-19 pandemic: A comparison between Wuhan and other urban areas in China. Globalization and Health, 16(1).
https://doi.org/10.1186/s12992-020-00627-7
Christopher, J. C., Chrisman, J. A., Trotter-Mathison, M. J., Schure, M. B., Dahlen, P., & Christopher, S. B. (2011). Perceptions of the long-term influence of mindfulness training on counselors and psychotherapists: A qualitative inquiry. Journal of Humanistic Psychology, 51(3), 318–349.
https://doi.org/10.1177/0022167810381471
Christopher, J. C., Christopher, S. E., Dunnagan, T., & Schure, M. (2016). Teaching self-care through mindfulness practices: The application of yoga, meditation, and qigong to counselor training. Journal of Humanistic Psychology, 46(4), 494–509. https://doi.org/10.1177/0022167806290215
Christopher, J. C., & Maris, J. A. (2010). Integrating mindfulness as self-care into counselling and psychotherapy training. Counselling and Psychotherapy Research, 10(2), 114–125. https://doi.org/10.1080/14733141003750285
Collaborative for Academic, Social, and Emotional Learning. (2023a). What is the CASEL framework? https://casel.org/fundamentals-of-sel/what-is-the-casel-framework
Collaborative for Academic, Social, and Emotional Learning. (2023b). Our mission and work. https://casel.org/about-us/our-mission-work
Council for Accreditation of Counseling and Related Educational Programs. (2015). 2016 CACREP standards. http://www.cacrep.org/wp-content/uploads/2018/05/2016-Standards-with-Glossary-5.3.2018.pdf
del Carmen Salazar, M. (2013). A humanizing pedagogy: Reinventing the principles and practice of education as a journey toward liberation. Review of Research in Education, 37(1), 121–148.
https://doi.org/10.3102/0091732X12464032
Duncan-Andrade, J. M. R., & Morrell, E. (2008). The art of critical pedagogy: Possibilities for moving from theory to practice in urban schools. Peter Lang.
Durlak, J. A., & DuPre, E. P. (2008). Implementation matters: A review of research on the influence of implementation on program outcomes and the factors affecting implementation. American Journal of Community Psychology, 41(3–4), 327–350. https://doi.org/10.1007/s10464-008-9165-0
Freire, P. (2000). Pedagogy of the oppressed. Continuum. (Original work published 1970)
Giorgi, A. (2009). The descriptive phenomenological method in psychology: A modified Husserlian approach. Duquesne University Press.
Glesne, C. (2011). Becoming qualitative researchers: An introduction (4th ed.). Pearson.
Harrichand, J. J. S., Litam, S. D. A., & Ausloos, C. D. (2021). Infusing self-care and wellness into CACREP curricula: Pedagogical recommendations for counselor educators and counselors during COVID-19. International Journal for the Advancement of Counselling, 43(3), 372–385. https://doi.org/10.1007/s10447-021-09423-3
Hays, D. G., & Wood, C. (2011). Infusing qualitative traditions in counseling research designs. Journal of Counseling & Development, 89(3), 288–295. https://doi.org/10.1002/j.1556-6678.2011.tb00091.x
Higheagle Strong, Z., & McMain, E. M. (2020). Social emotional learning for social emotional justice: A conceptual framework for education in the midst of pandemics. Northwest Journal of Teacher Education, 15(2).
https://doi.org/10.15760/nwjte.2020.15.2.6
hooks, b. (1994). Teaching to transgress: Education as the practice of freedom. Routledge.
Jagers, R., Rivas-Drake, D., & Borowski, T. (2018). Toward transformative social and emotional learning: Using an equity lens. https://measuringsel.casel.org/wp-content/uploads/2018/11/Framework_EquitySummary-.pdf
Jagers, R. J., Rivas-Drake, D., & Williams, B. (2019). Transformative social and emotional learning (SEL): Toward SEL in service of educational equity and excellence. Educational Psychologist, 54(3), 162–184.
https://doi.org/10.1080/00461520.2019.1623032
Lapan, R. T., & Harrington, K. M. (2009). Paving the road to college: How school counselors help students succeed. Center for School Counseling Outcome Research.
Lavrakas, P. J. (2008). Encyclopedia of survey research methods. SAGE. https://doi.org/10.4135/9781412963947
Lincoln, Y. S., & Guba, E. G. (1985). Naturalistic inquiry. SAGE.
Litam, S. D. A., & Hipolito-Delgado, C. P. (2021). When being “essential” illuminates disparities: Counseling clients affected by COVID-19. Journal of Counseling & Development, 99(1), 3–10. https://doi.org/10.1002/jcad.12349
Marques de Miranda, D., da Silva Athanasio, B., Sena Oliveira, A. C., & Simoes-e-Silva, A. C. (2020). How is COVID-19 pandemic impacting mental health of children and adolescents? International Journal of Disaster Risk Reduction, 51, 101845. https://doi.org/10.1016/j.ijdrr.2020.101845
Mitchell, M., & Binkley, E. (2021). Self-care: An ethical imperative for anti-racist counselor training. Teaching and Supervision in Counseling, 3(2), Article 5. https://doi.org/10.7290/tsc030205
Moerer-Urdahl, T., & Creswell, J. W. (2004). Using transcendental phenomenology to explore the “ripple effect” in a leadership mentoring program. International Journal of Qualitative Methods, 3(2), 19–35.
https://doi.org/10.1177/160940690400300202
Moustakas, C. E. (1994). Phenomenological research methods. SAGE.
Nelson, J. R., Hall, B. S., Anderson, J. L., Birtles, C., & Hemming, L. (2018). Self–compassion as self-care: A simple and effective tool for counselor educators and counseling students. Journal of Creativity in Mental Health, 13(1), 121–133. https://doi.org/10.1080/15401383.2017.1328292
Norcross, J. C., & Phillips, C. M. (2020). Psychologist self-care during the pandemic: Now more than ever. Journal of Health Service Psychology, 46(2), 59–63. https://doi.org/10.1007/s42843-020-00010-5
Paris, D., & Winn, M. T. (Eds.). (2013). Humanizing research: Decolonizing qualitative inquiry with youth and communities. SAGE.
Parker, M., & Henfield, M. S. (2012). Exploring school counselors’ perceptions of vicarious trauma: A qualitative study. The Professional Counselor, 2(2), 134–142. https://doi.org/10.15241/mpp.2.2.134
Polkinghorne, D. E. (1989). Phenomenological research methods. In R. S. Valle & S. Halling (Eds.), Existential-phenomenological perspectives in psychology: Exploring the breadth of human experience (pp. 41–60). Plenum Press.
Prime, H., Wade, M., & Browne, D. T. (2020). Risk and resilience in family well-being during the COVID-19 pandemic. American Psychologist, 75(5), 631–643. https://doi.org/10.1037/amp0000660
Pyles, L. (2020). Healing justice, transformative justice, and holistic self-care for social workers. Social Work, 65(2), 178–187. https://doi.org/10.1093/sw/swaa013
QSR International Pty Ltd. (2018). NVivo (Version 12) [Software]. https://www.qsrinternational.com/nvivo-qualitative-data-analysis-software/home
Rogers, C. R. (1980). A way of being. Houghton Mifflin.
Savitz-Romer, M., Rowan-Kenyon, H. T., Nicola, T. P., Alexander, E., & Carroll, S. (2021). When the kids are not alright: School counseling in the time of COVID-19. AERA Open, 7.
https://doi.org/10.1177/23328584211033600
Shapiro, S. L., Brown, K. W., & Biegel, G. M. (2007). Teaching self-care to caregivers: Effects of mindfulness-based stress reduction on the mental health of therapists in training. Training and Education in Professional Psychology, 1(2), 105–115. https://doi.org/10.1037/1931-3918.1.2.105
Van Velsor, P. (2009). School counselors as social-emotional learning consultants: Where do we begin? Professional School Counseling, 13(1), 50–58. https://www.jstor.org/stable/42732919
Zins, J. E., Bloodworth, M. R., Weissberg, R. P., & Walberg, H. J. (2007). The scientific base linking social and emotional learning to school success. Journal of Educational and Psychological Consultation, 17(2–3), 191–210. https://doi.org/10.1080/10474410701413145
Appendix A
Semi-Structured Interview Protocol
Title of the Study: School Counselor Trainees’ Perceptions and Experiences on Self-Care Grounded in Mindfulness and Social–Emotional Learning (SEL)
To be consistent with the goal of qualitative research, all participants will be described through their own viewpoints and in their own words. All questions are open-ended, and these semi-structured interview protocols will guide the researcher throughout the interviews. However, it is not expected that the remaining questions will be asked sequentially, that all questions will be asked of all participants, or that the list of provided questions is exhaustive. Rather, we offer the questions below as representing possible directions in which we anticipate the interviews may proceed.
Introduction
We want to thank you for your willingness to participate in this study. Recently, you completed the course EDCO 298-01 Seminar in Professional Counseling. Today, we would like to take some time to collect information on your perceptions, thoughts, reactions, and follow-up response to your mindfulness-based self-care and SEL practice. If at any time you feel uncomfortable or do not desire to answer a question, please let me know.
Semi-Structured Interview Questions
- What are the most important things you learned regarding mindfulness-based self-care and SEL?
- How have your knowledge and practice of SEL affected your personal and professional life in the area of self-awareness, self-management, responsible decision-making, relationship skills, and social awareness?
- Do you attribute these changes to the class?
- Have these changes stayed with you since you took the class? What has changed?
- Describe the history of your self-care practices.
- What self-care practices do you currently practice? How often for each?
- How did the class influence these practices?
- Describe how your mindfulness-based self-care affects your personal and professional life.
- In what ways do your own practice of mindfulness and self-care change how you think about students’ or clients’ issues or problems? How have your ideas about what is therapeutic, or healing, changed since taking the class? Do you see mindfulness techniques as healing? How?
- Have the mindfulness practices influenced who you are as a counselor, advisor, educator, or therapist or what it’s like for you to be in the role of the counselor, advisor, educator, or therapist? How?
- Have you tried to introduce mindfulness concepts/techniques with a client/student? Which techniques? What was your level of comfort with introducing the mindfulness techniques?
- What are consequences/outcomes from mindfulness-based self-care practices? (elaborate)
General Questions & Feedback
Is there anything you would like to say about your experiences in relation to the course that we have overlooked? What suggestions do you have to make this course a better experience?
Ending
We want to thank you for your participation in this project.
Appendix B
Course Content and Activities
| Week |
Module |
Mindful Theme |
SEL Competencies |
Class Activities |
| One |
1 |
Presence |
Self-Awareness |
Course Overview: Review syllabus, expectations, course
requirements, and online resourcesWhat’s Social and Emotional Learning (SEL)?
Three Collective Breaths
Why Aren’t We Teaching Mindfulness: TED Video
Pre-Training Survey
Small Group with Accountability and Support |
| 2 |
Self-Connection Practice
Mindful Listening and Speaking
Brave Zone
Trauma-Informed Practice: Grounding, Orienting, and Centering
“Seven Up” Film
My Seven Up Writing
Body Scan
Weekly Journal Entry |
| Two |
3 |
Gratitude |
Self-Management |
Setting Intentions
Mind–Body Connection
Non-Violent Communication
Empathy Practice
Appreciation Circle |
| 4 |
Non-Violent Communication Tools: Mourn/Celebrate/Learn (MCL)
Exploring Identities: “I Am”
Thankful Thoughts
Negative Bias
Weekly Journal Entry |
| Three |
5 |
Creativity |
Relationship Skills |
Play Therapy: Foundations and Techniques (1)
Creative Arts
Additional Readings |
| 6 |
Play Therapy: Foundations and Techniques (2)
My Relationships
Community Circle: Appreciation Practice
Weekly Journal Entry |
| Four |
7 |
Compassion |
Social Awareness |
Check-In: Daily Practice
Compassionate Self-Talk
Neuroplasticity
“Into Light” Video
My Life and Vision: Milestones |
| 8 |
Courageous Conversations
Mindful Eating
Sound Healing
Capstone Preparation
Weekly Journal Entry |
| Five |
9 |
Equity & Inclusion |
Responsible Decision-Making |
Giving and Receiving Loving-Kindness
Transformative SEL: Advocacy
Gender Identities and Pronouns
Mindful Breathing
Silent Mindfulness Practice
Yoga and Mindfulness |
| 10 |
Capstone Presentations
Celebration: A Closing Ceremony
Post-Training Survey
Final Journal Entry |
Kyoung Mi Choi, PhD, NCC, is a professor at San José State University. Jung H. Hyun, PhD, NCC, is an associate professor at Nova Southeastern University. Correspondence may be addressed to Kyoung Mi Choi, One Washington Square, San José, CA 95192, kyoungmi.choi@sjsu.edu.