Oct 31, 2023 | Volume 13 - Issue 3
Dalena Dillman Taylor, Saundra M. Tabet, Megan A. Whitbeck, Ryan G. Carlson, Sejal Barden, Nicole Silverio
Individuals living in poverty have higher rates of mental health disorders compared to those not living in poverty. Measures are available to assess adults’ levels of psychological distress; however, there is limited support for instruments to be used with a diverse population. The purpose of our study was to examine the factor structure of Outcome Questionnaire-45.2 scores with an economically vulnerable sample of adults (N = 615), contributing to the evidence of validity of the measure’s scores in diverse mental health settings. Implications for professional counselors are considered, including clinical usage of the brief Outcome Questionnaire-16 and key critical items.
Keywords: poverty, psychological distress, factor structure, Outcome Questionnaire-45.2, validity
In the United States, it is estimated that 34 million adults live in poverty (i.e., income less than $12,880 per year), and poverty is a significant factor contributing to poor mental and physical health outcomes (Hodgkinson et al., 2017). Poverty, or economic vulnerability, refers to the extent to which individuals have difficulty living with their current level of income, increasing the risk for adverse social and economic consequences (Semega et al., 2021). Economically vulnerable adults often experience greater social inequality, lower educational attainment, less economic mobility (Stanford Center on Poverty and Inequality, 2015), and difficulty securing full-time employment (Dakin & Wampler, 2008), which leads to increased distress (Lam et al., 2019). Lower income levels are also associated with several mental health conditions (e.g., anxiety, depression, suicide attempts; Santiago et al., 2011). Further, Lam and colleagues (2019) found strong negative associations between income, socioeconomic status, and psychological distress.
To effectively support their clients, counselors must understand the unique context and financial stressors related to living in poverty. Incorporating poverty-sensitive measures into assessment and evaluation practices is essential to providing culturally responsive care that considers the systemic and environmental barriers of poverty (Clark et al., 2020). Implementing culturally responsive assessments ensures that counselors use outcome measures that are attuned to poverty-related experiences (Clark et al., 2020). Such measures can help counselors identify and prioritize treatment planning approaches and acknowledge the reality that economic disadvantages create for clients (Foss-Kelly et al., 2017). However, the availability of poverty-sensitive assessments is limited.
Measuring Psychological Distress in Adults Living in Poverty
Because of the risk of mental health issues related to economic vulnerability, assessments with evidence of validity and reliability that measure psychological distress relative to income are warranted. Professional counselors can individualize their therapeutic approach to meet the needs of this population with the assistance of accurate assessments of related mental health conditions. Naher and colleagues (2020) noted the need for individual-level data as well as interventions specifically targeted to adults living in poverty. Although outcome assessments exist to measure psychological distress or severity of mental illness symptoms (e.g., Beck Depression Inventory [BDI], Beck et al., 1961; Generalized Anxiety Disorder Screener [GAD-7], Löwe et al., 2008; Patient Health Questionnaire-9 [PHQ-9], Kroenke et al., 2001), there is a lack of measures with evidence of validity and reliability with economically vulnerable adult populations. Therefore, our investigation examined the factor structure of the Outcome Questionnaire-45.2 (OQ-45.2; Lambert et al., 2004) with an economically vulnerable adult population, increasing the applicability of the measure in mental health settings.
Outcome Questionnaire-45.2
The OQ-45.2 (Lambert et al., 2004) is one of the most widely used outcome measures of psychological distress in applied mental health settings (Hatfield & Ogles, 2004). The OQ-45.2 assists professional counselors with monitoring client progress and can be administered multiple times throughout treatment, as it is sensitive to changes over time (Lambert et al., 1996). The OQ-45.2 has been implemented in outcome-based research with diverse populations such as university counseling center clients (Tabet et al., 2019), low-income couples (Carlson et al., 2017), and ethnic minority groups (Lambert et al., 2006). Lambert et al. (1996) reported strong test-retest reliability (r = .84) and internal consistency (α = .93) for the OQ-45.2, based on a sample of undergraduate students (n = 157) and a sample of individuals receiving Employee Assistance Program services (n = 289). However, researchers have yet to investigate the psychometric properties of the OQ-45.2 with an economically disadvantaged, diverse population.
Given the utility of the OQ-45.2 as a client-reported feedback measure, clinicians can use the OQ-45.2 in a variety of ways to evaluate client progress, including measuring changes in individual distress across the course of counseling and before and after specific treatment interventions, as well as to glean a baseline level of distress at the start of counseling (Lambert, 2017). For example, one study used the OQ-45.2 as a primary outcome measure for anxiety symptoms in clients engaging in cognitive behavioral therapy (Levy et al., 2020). The OQ-45.2 was administered at the beginning of each weekly counseling session and change scores were calculated between each session, which helped clinicians understand that about half of their sample reported clinically significant reductions in symptoms in just nine sessions (Levy et al., 2020). This example demonstrates how the OQ-45.2 can be implemented to monitor treatment outcomes and improve the duration and efficiency of counseling. A clinician can also use salient items as part of the intake clinical interview to encourage clients to elaborate on the specific symptoms they are experiencing, and how they may be impacting their functioning, across a variety of clinical settings (Espiridion et al., 2021; Lambert, 2017; Levy et al., 2020).
Factor Structure of OQ-45.2
Researchers contested the factor structure proposed by Lambert et al. (2004), suggesting the need for further validation of the three-factor oblique measurement model and exploration of other possible factor structures (e.g., Kim et al., 2010; Mueller et al., 1998; Rice et al., 2014; Tabet et al., 2019). Mueller and colleagues (1998) examined three models: (a) a one-factor model, (b) a two-factor oblique model, and (c) a three-factor oblique model, none of which fit the data well. In addition, the factors in the three-factor model were highly correlated, ranging from .83 to .91, asserting that the subscales may not be statistically indistinguishable and the OQ-45.2 might be a unidimensional measure of global distress.
Kim and colleagues (2010) also explored three models to assess adequate fit of the data: (a) a one-factor model, (b) a three-factor model, and (c) a revised 22-item four-factor model. Indicating weak support for the OQ-45.2’s factorial validity across all models, researchers cautioned against widespread utilization in mental health and research settings, encouraging further psychometric exploration and validation of the OQ-45.2 (Kim et al., 2010).
Rice and colleagues (2014) found evidence to support a two-factor OQ-45.2 model that included (a) overall maladjustment and (b) substance use. Results indicated relatively good fit (comparative fit index [CFI] = .990, root-mean-square error of approximation [RMSEA] = .068) for a two-factor measure with 11 items, which demonstrated better model fit than the original three-factor model
(CFI = .840, RMSEA = .086 [90% confidence interval {CI} = .085, .087]). Overall, multiple researchers have demonstrated poor fit for the original factor structure of the OQ-45.2 (Kim et al., 2010; Mueller et al., 1998; Rice et al., 2014; Tabet et al., 2019), supporting the need for further validation for using the OQ-45.2 with samples of adults living in poverty.
This study’s primary aim is to examine the factor structure of the OQ-45.2 with an economically vulnerable sample to enhance the generalizability of the OQ-45.2 in mental health settings. Therefore, the following research questions guided our study:
RQ1. What is the factor structure of OQ-45.2 scores with a sample of adults living in poverty?
RQ2. What is the internal consistency reliability of the abbreviated 16-item OQ-45.2 scores with a sample of adults living in poverty?
RQ3. What is the test-retest reliability of the abbreviated 16-item OQ-45.2 scores with a sample of adults living in poverty?
Method
Participants and Procedures
Participants comprised a sub-sample from a grant-funded, community-based, relationship education program for individuals and couples at a university in the Southeastern United States. The project was funded through the U.S. Department of Health and Human Services, Administration for Children and Families, Office of Family Assistance (Grant #90FM0078). Study recruitment strategically involved passive and active recruitment strategies (Carlson et al., 2014) from various community locations that primarily serve low-income individuals and families (e.g., libraries, employment offices). Participants met inclusion criteria if they were at least 18 years old and interested in learning about healthy relationships. The relationship education intervention utilized was an evidence-based curriculum that taught individuals tools to improve their relationships in a small group setting (Prevention and Relationship Education Program [PREP]; Pearson et al., 2015).
We obtained ethical approval from the university’s IRB prior to data collection. Each person participated in a group intake session that consisted of a review of the informed consent; a battery of assessments, including the OQ-45.2; and a brief activity. Study participants (N = 615) included in this current analysis consented between July 2015 and June 2019.
Demographic Information
We collected demographic data as part of this study, which included gender, age, ethnicity, income, educational level, working status, and marital status (see Table 1). The majority of participants fell below the poverty line when factoring in number of children and/or under- or unemployment. Therefore, our sample consisted of a diverse population, including variations in income, age, ethnicity, and race.
Table 1
Participant Demographic Characteristics
Descriptive Characteristic Total Sample (n, %)
| Age
18–20 years
21–24 years
25–34 years
35–44 years
45–54 years
55–64 years
65 years or older |
34 (5.5)
52 (8.5)
130 (21.1)
139 (22.6)
137 (22.3)
91 (14.8)
32 (5.2) |
| Gender (female) |
498 (81.0) |
| Race |
|
| American Indian or Alaska Native |
18 (2.9) |
| Asian |
19 (3.1) |
| Black or African American |
176 (28.6) |
| Native American or Pacific Islander |
2 (0.3) |
| White |
248 (40.3) |
| Other |
144 (23.4) |
| Ethnicity
Hispanic or Latino
Not Hispanic or Latino
Income |
258 (42.0)
356 (57.9) |
| Less than $500 |
216 (35.1) |
| $501–$1,000 |
108 (17.6) |
| $1,001–$2,000
$2,001–3,000
$3,001–$4,000
$4,001–$5,000
More than $5,000 |
124 (20.2)
81 (13.2)
28 (4.6)
18 (2.9)
18 (2.9) |
| Educational Level
No degree or diploma earned
High school diploma
Some college but no degree completion
Associate degree
Bachelor’s degree
Master’s / advanced degree |
24 (3.9)
18 (2.9)
75 (12.2)
66 (10.7)
134 (21.8)
77 (12.5) |
| Marital Status
Married
Engaged
Divorced
Widowed
Never Married |
93 (15.1)
11 (1.8)
164 (26.7)
24 (3.9)
270 (43.9) |
| Employment Status
Full-time employment
Part-time employment
Temporary, occasional, or seasonal, or odd jobs for pay
Not currently employed
Employed, but number of hours change from week to week
Selected multiple responses
Number of Children
0
1
2
3
4
5
6 |
227 (36.9)
83 (13.5)
41 (6.7)
207 (33.7)
29 (13.5)
6 (1.0)
148 (24.1)
60 (9.8)
44 (7.2)
17 (2.8)
6 (1.0)
4 (0.7)
1 (0.4) |
Instrument
The Outcome Questionnaire-45.2
The OQ-45.2 is a self-report questionnaire that captures individuals’ subjective functionality in various aspects of life that can lead to common mental health concerns (e.g., anxiety, depression, substance use). The current three-factor structure of the OQ-45.2 has 45 items rated on a 5-point Likert scale, with rankings of 0 (never), 1 (rarely), 2 (sometimes), 3 (frequently), and 4 (almost always; Lambert et al., 2004). Nine OQ-45.2 items are reverse scored, with total OQ-45.2 scores calculated by summing all 45 items with a range from 0 to 180. Clinically significant changes are represented in a change score of at least 14, whether positive or negative (i.e., increased or reduced distress).
The Symptom Distress subscale (25 items) evaluates anxiety, depression, and substance abuse symptoms, as these are the most diagnosed mental health concerns (Lambert et al., 1996). The Interpersonal Relations subscale (11 items) includes items that measure difficulties and satisfaction in relationships. The Social Role Performance subscale (nine items) assesses conflict, distress, and inadequacy related to employment, family roles, and leisure activities. The OQ-45.2 also includes four critical items (Items 8, 11, 32, and 44) targeting suicidal ideation, homicidal ideation, and substance use. The Cronbach’s alpha for the OQ-45.2 in the current study was calculated at .943.
Data Analysis
We calculated descriptive statistics on the total sample population, including the mean, standard deviations, and frequencies. Subsequently, we conducted preliminary descriptive analyses to test for statistical assumptions that included missing data, collinearity issues, and multivariate normality (Byrne, 2016). In the first analysis, we used confirmatory factor analysis (CFA) to test the factor structure of the OQ-45.2 with this population (N = 615) and subsequently used exploratory factor analysis (EFA) to evaluate revised OQ models.
We conducted CFA utilizing the original three-factor oblique model (Lambert et al., 2004) as the a priori model to test the hypothesized structure of the latent variables. In addition, based on the results of the study, we tested a series of alternative structural models outlined by Bludworth and colleagues (2010). Given the non-normal distribution, we utilized MPlus (Version 8.4) with a robust maximum likelihood (MLR) parameter estimation (Satorra & Bentler, 1994). To address missing data, we employed a full information maximum likelihood (FIML) to approximate the population parameters and produce the estimates from the sample data (Enders, 2010). Results of the CFA were evaluated using several fit indices: (a) the chi-square test of model fit (χ2; nonsignificance at p > .05 indicate a good fit [Hu & Bentler, 1999]); (b) the CFI (values larger than .95 indicate a good fit [Bentler, 1990]); (c) TLI (values larger than .95 indicate a good fit [Tucker & Lewis, 1973]); (d) RMSEA with 90% CI (values between .05 and .08 indicate a good fit [Browne & Cudeck, 1993]); and (e) standardized root-mean-square residual (SRMR; values below .08 indicate good fit [Hu & Bentler, 1999]).
Following the CFA, we conducted EFA because of poor model fit across all models and several items with outer loadings of less than 0.5 (Tabachnick & Fidell, 2019). Kline (2016) recommended researchers should not be constrained by the original factor structure when CFA indicates low outer loadings and should consider conducting an EFA because the data may not fit the original number of factors suggested. Accordingly, we conducted an EFA to test the number of factors derived from the 45-item OQ-45.2 within our population. We exceeded the recommended ratio (i.e., 10:1) of participants to the number of items (12.6:1; Costello & Osborne, 2005; Hair et al., 2010; Mvududu & Sink, 2013). We conducted a principal axis factoring with Promax rotation to determine whether factors were correlated using SPSS version 25.0. We chose parallel analysis (Horn, 1965) using the 95th percentile to determine the number of factors to retain given that previous researchers have acknowledged parallel analysis to be a superior method to extract significant factors as compared to conventional statistical indices such as Cattell’s scree test (Henson & Roberts, 2006). We used stringent criterion when identifying loading and cross-loading items such as items that indicated high (i.e., equal to or exceeding 1.00) or low communality values (i.e., less than 0.40; Costello & Osborne, 2005) and items with substantive cross-loadings (< .30 between two factor loadings; Tabachnick & Fidell, 2019) were removed. To ensure the most parsimonious model, we removed items individually from Factor 1, which has the greatest number of items, to reduce the size of the model while still capturing the greatest variance explained by the items on that factor.
Results
We screened the data and checked for statistical assumptions prior to conducting factor analysis. Little’s Missing Completely at Random (MCAR) test (Little, 1988), a multivariate extension of a simple t-test, evaluated the mean differences of the 45 items to determine the pattern and missingness of data (Enders, 2010). Given the significant chi-square, data were not missing completely at random
(χ2 = 912.062, df = 769, p < .001). However, results indicated a very small percentage of values (< 1%) were missing from each variable; therefore, supporting data were missing at random (MAR; Osborne, 2013). When data are MAR, an FIML approach to replace missing values provides unbiased parameter estimates and improves the statistical power of analyses (Enders, 2010). The initial internal consistency reliability estimates (coefficient alpha) for scores on the original OQ-45.2 model were all in acceptable ranges except for Factor 3 (see Henson & Roberts, 2006): total α = .943, Symptom Distress α = .932
(k = 25 items), Interpersonal Relations α = .802 (k = 11 items), and Social Role Performance α = .683
(k = 9 items). We also conducted Bartlett’s test of sphericity (p < .001) and the Kaiser-Meyer-Olkin value (.950), indicating the data was suitable for conducting a factor analysis. We evaluated multivariate normality of the dataset with Mardia’s multivariate kurtosis coefficient. Mardia’s coefficient of multivariate kurtosis was .458; therefore, we deemed the data to be non-normally distributed
(Hu & Bentler, 1995).
Confirmatory Factor Analysis
We tested the developer’s original OQ-45.2 three-factor oblique model, and because of the results subsequently tested a series of alternative structural models outlined by Bludworth and colleagues (2010). Specifically, the alternative structural models tested included: (a) a three-factor orthogonal model, (b) a one-factor model, (c) a four-factor hierarchical model, and (d) a four-factor bilevel model. Table 2 presents the fit indices results in the series of CFAs. The original three-factor oblique model allowed all three factors (Social Role Performance, Interpersonal Relations, and Symptom Distress) to correlate, but resulted in a poor fit: χ2 (942, N = 615) = 3.014, p < .001; CFI = .779; TLI = .768; RMSEA = .057, 90% CI [.055, .060]; SRMR = .063. We next uncorrelated the factors and tested a three-factor orthogonal model, which also presented a poor fit with worsened fit metrics: χ2 (945, N = 615) = 3.825, p < .001; CFI = .689; TLI = .674; RMSEA = .068, 90% CI [.065, .070]; SRMR = .202. Accordingly, because the factors demonstrated high intercorrelation (rs = .94, .93, .91) in the three-factor oblique model and lack of factorial validity based on the CFA results of both three-factor models, we suspected the OQ-45.2 to be a unidimensional, one-factor model. However, the CFA revealed a poor fit to the OQ-45.2 one-factor model: χ2 (945, N = 615) = 3.197,
p < .001; CFI = .758; TLI = .747; RMSEA = .060, 90% CI [.057, .062]; SRMR = .062.
Table 2
Goodness-of-Fit Indices for the Item-Level Models of the OQ-45.2
|
χ2 |
df |
p |
χ2/df |
CFI |
TLI |
RMSEA |
90% CI |
SRMR |
| One-Factor |
3021.300 |
945 |
.000 |
3.197 |
.758 |
.747 |
.060 |
[.057, .062] |
.062 |
| Three-Factor (orthogonal) |
3615.060 |
945 |
.000 |
3.825 |
.689 |
.674 |
.068 |
[.065, .070] |
.202 |
| Three-Factor (oblique) |
2839.335 |
942 |
.000 |
3.014 |
.779 |
.768 |
.057 |
[.055, .060] |
.063 |
| Four-Factor (hierarchical) |
2839.335 |
942 |
.000 |
3.014 |
.779 |
.768 |
.057 |
[.055, .060] |
.063 |
| Four-Factor
(bilevel) |
2363.263 |
900 |
.000 |
2.626 |
.829 |
.812 |
.051 |
[.049, .054] |
.054 |
Note. N = 615. χ2 = chi-square; df = degrees of freedom; χ2/df = relative chi-square; CFI = comparative fit index;
TLI = Tucker-Lewis Index; RMSEA = root-mean-square error of approximation; 90% CI = 90% confidence interval;
SRMR = standardized root-mean-square residual.
We proceeded to test the OQ-45.2 as a four-factor hierarchical model. In this multidimensional model, the three first-order factors (Social Role Performance, Interpersonal Relations, and Symptom Distress) became a linear combination to sum a second-order general factor (g-factor) of Psychological Distress (Eid et al., 2017). Results evidenced an unacceptable overall fit to the data: χ2 (942, N = 615) = 3.014, p < .001; CFI = .779; TLI = .768; RMSEA = .057, 90% CI [.055, .060]; SRMR = .063. Last, we examined a four-factor bilevel model. In this model, the g-factor of Psychological Distress has a direct effect on items, whereas, in the hierarchal model, it had an indirect effect on items. Therefore, the items in the four-factor bilevel model load onto both their intended factors (Social Role Performance, Interpersonal Relations, and Symptom Distress) and the g-factor (Psychological Distress). Nevertheless, although the four-factor bilevel was cumulatively the best fitting OQ-45.2 factorial model, the results still yielded a poor fit:
χ2 (900, N = 615) = 2.626, p < .001; CFI = .829; TLI = .812; RMSEA = .051, 90% CI [.049, .054]; SRMR = .054.
Overall, all models demonstrated a significant chi-square (p < .001); however, this result is common in larger sample sizes (N > 400; Kline, 2016). Because the chi-square statistic is sensitive to sample size and model complexity, researchers have recommended using other fit indices (e.g., RMSEA, CFI) to determine overall model fit (Tabachnick & Fidell, 2019). Nevertheless, the levels of the CFI values (ranging from .689 to .829) and TLI values (ranging from .674 to .812) were low, and far below the recommended referential cutoff (> .90; Tucker & Lewis, 1973). Although the models’ RMSEA values were within the recommended range of .05 to .08 (Browne & Cudeck, 1993), and the majority of SRMR values were below .08 (Hu & Bentler, 1999), these were the only fit indices that met acceptable cutoffs. We further examined outer loadings for the 45 items within the factorial models and identified that all models had outer loadings (ranging from 5 to 14 items) below the 0.5 cutoff (Tabachnick & Fidell, 2019). When CFA produces low factor loadings and poor fit indices, researchers should not be constrained to the original specified number of factors and should consider conducting an EFA (Kline, 2016). Hence, we elected to conduct an EFA to explore the factor structure with this population.
Exploratory Factor Analysis
Results from the initial EFA using principal axis factoring with the 45 OQ items produced a solution that explained 55.564% of the total variance. After multiple iterations of item deletions, we concluded with a three-factor solution. We present the internal reliability estimates of two three-factor solutions: (a) a 16-item three-factor solution—the most parsimonious—and (b) an 18-item three-factor solution, including all critical items in Table 3. We present the first three-factor solution because it was derived using stringent criteria for creating the most parsimonious solution (Costello & Osborne, 2005; Henson & Roberts, 2006; Tabachnick & Fidell, 2019), whereas the second three-factor solution included conceptual judgment determining the inclusion of the critical items from the original OQ-45.2.
Table 3
Internal Consistency Estimates
|
Total |
Symptom Distress |
Interpersonal Relations |
Social Role Performance |
| Original OQ-45 |
.943 |
.932 |
.802 |
.683 |
|
Total |
Factor 1 |
Factor 2 |
Factor 3 |
| 16-Item Model |
.894 |
.864 |
.840 |
.710 |
| 18-Item Model |
.896 |
.857 |
.840 |
.700 |
Three-Factor Solution
Results from the parallel analysis (Horn, 1965) indicated an initial four-factor solution. Through multiple iterations (n = 9) of examining factor loadings, removing items one at a time, and reexamining parallel analysis after each deletion, our results demonstrated that a three-factor solution was the most parsimonious. We removed a total of 29 items because of low communalities (< .5), low factor loadings (< .4), and substantive cross-loadings (> .3 between two factor loadings; Tabachnick & Fidell, 2019). Before accepting the removal of these items, we added each back to the model to determine its impact on the overall model. No items improved the model; therefore, we accepted the deletion of the 29 items. The final three-factor solution included 16 items with 57.99% of total variance explained, which indicates near acceptable variance in social science research, with 60% being acceptable (Hair et al., 2010). Factor 1 (seven items) explained 38.98% of the total variance; Factor 2 (six items) explained 11.37% of the total variance; and Factor 3 (three items) explained 7.64% of the total variance.
Three-Factor Solution With Critical Items
After finalizing the model, we added Item 8 (“I have thoughts of ending my life”) and Item 44 (“I feel angry enough at work/school to do something I might regret”) into the final model for purposes of clinical utility. Both items resulted in low factor loading (< .4). Item 8 correlated with other items on Factor 3, and Item 44 correlated with other items on Factor 1. This final 18-item three-factor solution reduced the variance explained by the items on the factors by 3.45%, indicating a questionable fit for social sciences (54.54%; Hair et al., 2010). Factor 1 (eight items) explained 36.83% of the total variance; Factor 2 (six items) explained 10.82% of the total variance; and Factor 3 (four items) explained 6.90% of the total variance. Internal consistency estimates are presented in Table 3 for all three models: (a) the original OQ-45.2 (α = .943); (b) the 16-item, three-factor solution (α = .894); and (c) the 18-item, three-factor solution (α = .896).
Test-Retest Reliability
To examine the stability of the new 16-item OQ scores over time, we assessed test-retest reliability over a 30-day interval using bivariate correlation (Pallant, 2016). Results yielded strong correlation coefficients between pre-OQ scores and post-OQ scores: (a) OQ Total Scores, r = .781, p < .001; (b) Factor 1, r = .782, p < .001; (c) Factor 2, r = .742, p < .001; and (d) Factor 3, r = .681, p < .001. The 18-item OQ scores also demonstrated significant support for test-retest reliability over a 30-day interval: (a) OQ Total Scores, r = .721, p < .001; (b) Factor 1, r = .658, p < .001; (c) Factor 2, r = .712, p < .001; and (d) Factor 3, r = .682, p < .001.
Discussion
We found that the current factor structure of the OQ-45.2 poorly fits the sample population of economically vulnerable individuals. Our preliminary results support Rice and colleagues’ (2014) claim: because of the unique stressors economically vulnerable individuals face, the OQ-45.2 does not adequately capture their psychological distress. The lack of support for the OQ-45.2’s current structure (i.e., three-factor oblique) creates doubt clinically when assessing clients’ distress. Therefore, we explored alternative structural models proposed by Bludworth and colleagues (2010) using a CFA, and subsequently an EFA, to reexamine the factor structure of the OQ-45.2.
The EFA resulted in a 16-item, three-factor solution with our sample, indicating marginal support for the validity and reliability of the items for this brief model of the OQ, meaning that this model lacked reliability (i.e., ability to produce similar results consistently) and validity (i.e., ability to actually measure what it intends to measure: distress). In social science research, total variance explained of 60% is adequate (Hair et al., 2010); therefore, the three-factor model that approaches 60% could be acceptable, indicating that this model captures more than half or more than chance of the construct distress for this population. Still, additional research is needed to support the factor structure with a similar population of low-income, diverse individuals. Economically vulnerable individuals experience unique stressors (Karney & Bradbury, 2005), and brief assessments are best practices (Beidas et al., 2015). Therefore, we encourage other researchers to reexamine the use of this brief version of the OQ with a sample of economically vulnerable individuals or develop a new instrument that may more accurately capture psychological distress in economically disadvantaged individuals.
Also, the 16-item model results differ from the original OQ-45.2 in that we were unable to find support for the social role factor with our sample population. We hypothesize this finding is largely due to the economic stressors this population faces (e.g., unreliable transportation, food scarcity, housing needs). Anecdotally, some participants commented during the initial intake session that several items (e.g., specifically items on the social role factor relating to employment) were not relevant to their situation because of under- or unemployment. Further, reducing OQ-45.2 to a 16-item assessment may provide a more user-friendly version requiring less time for respondents and more efficient use of clinical time; however, without further research, the current authors are hesitant to support its clinical use with this population of economically vulnerable individuals.
Similar to previous researchers (e.g., Kim et al., 2010; Rice et al., 2014), we also found evidence for the need for a substance use factor (e.g., Factor 3) in the 18-item abbreviated model; however, this model deviated from the original OQ-45.2. The findings of this study support the need for professional counselors to assess substance use as part of psychological distress, whether it be implementing the
18-item version of the OQ or adding an additional assessment that has greater reliability and validity of its items with this population.
Implications
We found initial, possible support for a brief version of the OQ-45.2 for economically vulnerable individuals. The abbreviated 16-item OQ assessment derived from this research requires less time to complete while capturing an individual’s distress on substance use, interpersonal relationships, and symptom distress. A brief instrument can provide professional counselors with a snapshot of the client’s concerns, which can assist in monitoring a client’s level of psychological distress throughout treatment. In clinical settings, counselors can utilize this instrument to briefly assess at intake the baseline distress of their clients and use it as a guide or conversation starter for discussing client distress. For example, a counselor may ask that the client complete the brief OQ-16 instrument with the intake paperwork. In review of all paperwork, the counselor may note to the client, “I noticed that you indicated high distress with interpersonal relationships. Is that a place you would like to begin, or do you have another place you want to begin?”
Further, we retained two critical items (i.e., Items 8 and 44) in the 18-item version of the OQ brief assessment, as psychological distress associated with economic vulnerability is linked to higher rates of suicide and homicide (Knifton & Inglis, 2020). Because of the clinical utility of this instrument, professional counselors may want to include those items to assess a client’s level of threat of harm to self or others. Dependent on the client’s answer to these critical items, professional counselors have a quick reference with which to intervene or focus the initial session to address safety. Therefore, the items of this assessment may possibly be used to start the initial dialogue regarding an individual’s psychological distress and/or suicidal intent; however, the assessment should not be used as the only tool or instrument to diagnose or treat psychological distress. We understand that these items can help professional counselors efficiently assess for suicidal or homicidal intent. Therefore, the counselor can opt to use the 16-item version and include an additional, more reliable assessment for measuring threat of harm to self and/or others. For example, counselors may opt to use an instrument such as the Ask Suicide-Screening Questions tool (Horowitz et al., 2012) to further evaluate suicidal intent.
In our experience, when following up with study participants based on a score higher than 1 on a scale of 1–5, many participants indicated they felt that way in the past but no longer feel that way now. In our use of the OQ-45.2, we find that participants tend to answer these questions based on their entire life versus the time frame indicated in the assessment instructions (the past week [7 days]). Therefore, professional counselors should be clear that respondents should answer based on the past week, rather than “ever experienced.” When offering the assessment to clients, we recommend that the counselor highlight the time frame in the instructions or clearly communicate that time frame to the client before they complete the instrument to gain the most accurate data.
Limitations and Suggestions for Future Research
As with all research, results should be considered in light of limitations. The large study sample consisted of diverse individuals; however, the majority were women, and all individuals were from the southeast region of the United States, minimizing the generalizability of these findings. In addition, although findings indicate initial, possible support for a revised three-factor model consisting of 16 items, future studies are warranted to strengthen the validity of this abbreviated version of the OQ-45.2. We suggest that future researchers test the 16-item assessment through CFA with a similar population to confirm the current study’s findings. All respondents volunteered to participate in a 6-month study, which may indicate more motivation to improve or represent a population with distress responses different from those who were recruited but chose not to participate in the study. Additionally, study participants were actively recruited, and may have experienced less distress than a help-seeking sample.
The OQ is available in a Spanish translation; however, we only included people who completed the English OQ-45.2 version in the current study. Future analyses should examine the factor structure of the Spanish OQ-45.2 as well. Next, future research on the OQ should include the development and testing of new items. Lastly, future research should aim to validate the reduced 16-item and 18-item OQ scores on a new sample and seek to establish a new criterion for clinical significance. Professional counselors may also benefit from the creation of a specific instrument assessing distress related to the unique stressors that economically vulnerable clients face. Until further analyses are conducted with a new sample population to confirm the abbreviated models, we encourage professional counselors to implement the brief version tentatively and with caution, and to follow up with the client regarding high scores on critical items prior to making clinical judgments regarding reported subscale scores.
Conclusion
Given the broad utility of the OQ-45.2 in research and mental health settings, researchers and professional counselors must understand the instrument’s structure for interpretation purposes and how the assessment should be adapted for various populations. Professional counselors can effectively support clients by assessing and recognizing how economic-related distress impacts their quality of life, which may directly relate to treatment outcomes. Findings from the current study add to previous literature that calls into question the original OQ-45.2 factor structure. Additionally, the current study’s findings support a revised 16-item, three-factor structure for economically vulnerable clients and we provide implications for use of this assessment in clinical practice. Future research should include a confirmatory analysis of the current findings.
Conflict of Interest and Funding Disclosure
This research was supported by a grant (90FM0078)
from the U.S. Department of Health and Human
Services (USDHHS), Administration for Children and
Families, Office of Family Assistance. Any opinions,
findings, conclusions, or recommendations are those
of the authors and do not necessarily reflect the views
of the USDHHS, Office of Family Assistance. The authors
reported no further funding or conflict of interest.
References
Beck, A. T., Ward, C. H., Mendelson, M., Mock, J., & Erbaugh, J. (1961). An inventory for measuring depression. Archives of General Psychiatry, 4(6), 561–571. https://doi.org/10.1001/archpsyc.1961.01710120031004
Beidas, R. S., Stewart, R. E., Walsh, L., Lucas, S., Downey, M. M., Jackson, K., Fernandez, T., & Mandell, D. S. (2015). Free, brief, and validated: Standardized instruments for low-resource mental health settings. Cognitive and Behavioral Practice, 22(1), 5–19. https://doi.org/10.1016/j.cbpra.2014.02.002
Bentler, P. M. (1990). Comparative fit indexes in structural models. Psychological Bulletin, 107(2), 238–246.
https://doi.org/10.1037/0033-2909.107.2.238
Bludworth, J. L., Tracey, T. J. G., & Glidden-Tracey, C. (2010). The bilevel structure of the Outcome Questionnaire–45. Psychological Assessment, 22(2), 350–355. https://doi.org/10.1037/a0019187
Browne, M. W., & Cudeck, R. (1993). Alternative ways of assessing model fit. In K. A. Bollen and J. S. Long (Eds.), Testing structural equation models. SAGE.
Byrne, B. M. (2016). Structural equation modeling with AMOS: Basic concepts, applications, and programming (3rd ed.). Routledge.
Carlson, R. G., Fripp, J., Munyon, M. D., Daire, A., Johnson, J. M., & DeLorenzi, L. (2014). Examining passive and active recruitment methods for low-income couples in relationship education. Marriage & Family Review, 50(1), 76–91. https://doi.org/10.1080/01494929.2013.851055
Carlson, R. G., Rappleyea, D. L., Daire, A. P., Harris, S. M., & Liu, X. (2017). The effectiveness of couple and individual relationship education: Distress as a moderator. Family Process, 56(1), 91–104.
https://doi.org/10.1111/famp.12172
Clark, M., Ausloos, C., Delaney, C., Waters, L., Salpietro, L., & Tippett, H. (2020). Best practices for counseling clients experiencing poverty: A grounded theory. Journal of Counseling & Development, 98(3), 283–294. https://doi.org/10.1002/jcad.12323
Costello, A. B., & Osborne, J. (2005). Best practices in exploratory factor analysis: Four recommendations for getting the most from your analysis. Practical Assessment, Research, and Evaluation, 10(7), 1–9.
https://doi.org/10.7275/jyj1-4868
Dakin, J., & Wampler, R. (2008). Money doesn’t buy happiness, but it helps: Marital satisfaction, psychological distress, and demographic differences between low- and middle-income clinic couples. The American Journal of Family Therapy, 36(4), 300–311. https://doi.org/10.1080/01926180701647512
Eid, M., Geiser, C., Koch, T., & Heene, M. (2017). Anomalous results in G-factor models: Explanations and alternatives. Psychological Methods, 22(3), 541–562. https://doi.org/10.1037/met0000083
Enders, C. K. (2010). Applied missing data analysis (1st ed.). Guilford.
Espiridion, E. D., Oladunjoye, A. O., Millsaps, U., & Yee, M. R. (2021). A retrospective review of the clinical significance of the Outcome Questionnaire (OQ) measure in patients at a psychiatric adult partial hospital program. Cureus, 13(3), e13830. https://doi.org/10.7759/cureus.13830
Foss-Kelly, L. L., Generali, M. M., & Kress, V. E. (2017). Counseling strategies for empowering people living in poverty: The I-CARE Model. Journal of Multicultural Counseling and Development, 45(3), 201–213.
https://doi.org/10.1002/jmcd.12074
Hair, J. F., Jr., Black, W. C., Babin, B. J., Anderson, R. E., & Tatham, R. L. (2010). Multivariate data analysis (6th ed.). Pearson.
Hatfield, D. R., & Ogles, B. M. (2004). The use of outcome measures by psychologists in clinical practice. Professional Psychology: Research and Practice, 35(5), 485–491. https://doi.org/10.1037/0735-7028.35.5.485
Henson, R. K., & Roberts, J. K. (2006). Use of exploratory factor analysis in published research: Common errors and some comment on improved practice. Educational and Psychological Measurement, 66(3), 393–416. https://doi.org/10.1177/0013164405282485
Hodgkinson, S., Godoy, L., Beers, L. S., & Lewin, A. (2017). Improving mental health access for low-income children and families in the primary care setting. Pediatrics, 139(1). https://doi.org/10.1542/peds.2015-1175
Horn, J. L. (1965). A rationale and test for the number of factors in factor analysis. Psychometrika, 30(2), 179–185. https://doi.org/10.1007/BF02289447
Horowitz, L. M., Bridge, J. A., Teach, S. J., Ballard, E., Klima, J., Rosenstein, D. L., Wharff, E. A., Ginnis, K., Cannon, E., Joshi, P., & Pao, M. (2012). Ask Suicide-Screening Questions (ASQ): A brief instrument for the pediatric emergency department. Archives of Pediatrics & Adolescent Medicine, 166(12), 1170–1176.
https://doi.org/10.1001/archpediatrics.2012.1276
Hu, L., & Bentler, P. M. (1995). Evaluating model fit. In R. H. Hoyle (Ed.), Structural equation modeling: Concepts, issues, and applications (pp. 76–99). SAGE.
Hu, L., & Bentler, P. M. (1999). Cutoff criteria for fit indexes in covariance structure analysis: Conventional criteria versus new alternatives. Structural Equation Modeling, 6(1), 1–55.
https://doi.org/10.1080/10705519909540118
Karney, B. R., & Bradbury, T. N. (2005). Contextual influences on marriage: Implications for policy and intervention. Current Directions in Psychological Science, 14(4), 171–174.
https://doi.org/10.1111/j.0963-7214.2005.00358.x
Kim, S.-H., Beretvas, S. N., & Sherry, A. R. (2010). A validation of the factor structure of OQ-45 scores using factor mixture modeling. Measurement and Evaluation in Counseling and Development, 42(4), 275–295.
https://doi.org/10.1177/0748175609354616
Kline, R. B. (2016). Principles and practice of structural equation modeling (4th ed.). Guilford.
Knifton, L., & Inglis, G. (2020). Poverty and mental health: Policy, practice and research implications. BJPsych Bulletin, 44(5), 193–196. https://doi.org/10.1192/bjb.2020.78
Kroenke, K., Spitzer, R. L., & Williams, J. B. W. (2001). The PHQ-9: Validity of a brief depression severity measure. Journal of General Internal Medicine, 16, 606–613. https://doi.org/10.1046/j.1525-1497.2001.016009606.x
Lam, J. R., Tyler, J., Scurrah, K. J., Reavley, N. J., & Dite, G. S. (2019). The association between socioeconomic status and psychological distress: A within and between twin study. Twin Research and Human Genetics, 22(5), 312–320. https://doi.org/10.1017/thg.2019.91
Lambert, M. J. (2017). Measuring clinical progress with the OQ-45 in a private practice setting. In S. Walfish, J. E. Barnett, & J. Zimmerman (Eds.), Handbook of private practice: Keys to success for mental health practitioners (pp. 78–93). Oxford University Press. https://doi.org/10.1093/med:psych/9780190272166.003.0007
Lambert, M. J., Burlingame, G. M., Umphress, V., Hansen, N. B., Vermeersch, D. A., Clouse, G. C., & Yanchar, S. C. (1996). The reliability and validity of the Outcome Questionnaire. Clinical Psychology and Psychotherapy, 3(4), 249–258. https://doi.org/10.1002/(SICI)1099-0879(199612)3:4<249::AID-CPP106>3.0.CO;2-S
Lambert, M. J., Gregersen, A. T., & Burlingame, G. M. (2004). The Outcome Questionnaire-45. In M. E. Maruish (Ed.), The use of psychological testing for treatment planning and outcomes assessment: Instruments for adults (3rd ed.; pp. 191–234). Routledge.
Lambert, M. J., Smart, D. W., Campbell, M. P., Hawkins, E. J., Harmon, C., & Slade, K. L. (2006). Psychotherapy outcome, as measured by the OQ-45, in African American, Asian/Pacific Islander, Latino/a, and Native American clients compared with matched Caucasian clients. Journal of College Student Psychotherapy, 20(4), 17–29. https://doi.org/10.1300/J035v20n04_03
Levy, H. C., Worden, B. L., Davies, C. D., Stevens, K., Katz, B. W., Mammo, L., Diefenbach, G. J., & Tolin, D. F. (2020). The dose-response curve in cognitive-behavioral therapy for anxiety disorders. Cognitive Behaviour Therapy, 49(6), 439–454. https://doi.org/10.1080/16506073.2020.1771413
Little, R. J. A. (1988). A test of missing completely at random for multivariate data with missing values. Journal of the American Statistical Association, 83(404), 1198–1202. https://doi.org/10.2307/2290157
Löwe, B., Decker, O., Müller, S., Brähler, E., Schellberg, D., Herzog, W., & Herzberg, P. Y. (2008). Validation and standardization of the Generalized Anxiety Disorder Screener (GAD-7) in the general population. Medical Care, 46(3), 266–274. https://doi.org/10.1097/MLR.0b013e318160d093
Mueller, R. M., Lambert, M. J., & Burlingame, G. M. (1998). Construct validity of the Outcome Questionnaire: A confirmatory factor analysis. Journal of Personality Assessment, 70(2), 248–262.
https://doi.org/10.1207/s15327752jpa7002_5
Muthén, L. K., & Muthén, B. O. (2015). Mplus: Statistical analysis with latent variables. User’s guide. (7th ed.)
https://www.statmodel.com/download/usersguide/MplusUserGuideVer_7.pdf
Mvududu, N. H., & Sink, C. A. (2013). Factor analysis in counseling research and practice. Counseling Outcome Research and Evaluation, 4(2), 75–98. https://doi.org/10.1177/2150137813494766
Näher, A.-F., Rummel-Kluge, C., & Hegerl, U. (2020). Associations of suicide rates with socioeconomic status and social isolation: Findings from longitudinal register and census data. Frontiers in Psychiatry, 10(898), 1–9. https://doi.org/10.3389/fpsyt.2019.00898
Osborne, J. W. (2013). Best practices in data cleaning. SAGE.
Pearson, M., Stanley, S. M., & Rhoades, G. K. (2015). Within My Reach leader manual. PREP for Individuals, Inc.
Rice, K. G., Suh, H., & Ege, E. (2014). Further evaluation of the Outcome Questionnaire–45.2. Measurement and Evaluation in Counseling and Development, 47(2), 102–117. https://doi.org/10.1177/0748175614522268
Santiago, C. D., Wadsworth, M. E., & Stump, J. (2011). Socioeconomic status, neighborhood disadvantage, and poverty-related stress: Prospective effects on psychological syndromes among diverse low-income families. Journal of Economic Psychology, 32(2), 218–230. https://doi.org/10.1016/j.joep.2009.10.008
Satorra, A., & Bentler, P. M. (1994). Corrections to test statistics and standard errors in covariance structure analysis. In A. von Eye & C. C. Clogg (Eds.), Latent variables analysis: Applications for developmental research (pp. 399–419). SAGE.
Semega, J., Kollar, M., Shrider, E. A., & Creamer, J. F. (2021). Income and poverty in the United States: 2019. Current population reports. U.S. Census Bureau.
https://www.census.gov/content/dam/Census/library/publications/2020/demo/p60-270.pdf
Stanford Center on Poverty and Inequality. (2015). State of the states: The poverty and inequality report. Pathways. http://inequality.stanford.edu/sites/default/files/SOTU_2015.pdf
Tabachnick, B. G., & Fidell, L. S. (2019). Using multivariate statistics (7th ed.). Pearson.
Tabet, S. M., Lambie, G. W., Jahani, S., & Rasoolimanesh, S. (2019). The factor structure of the Outcome Questionnaire–45.2 scores using confirmatory tetrad analysis—partial least squares. Journal of Psychoeducational Assessment. https://doi.org/10.1177/0734282919842035
Tucker, L. R., & Lewis, C. (1973). A reliability coefficient for maximum likelihood factor analysis. Psychometrika, 38, 1–10.
Dalena Dillman Taylor, PhD, LMHC, RPT-S, is an associate professor at the University of North Texas. Saundra M. Tabet, PhD, NCC, CCMHC, ACS, LMHC, is an assistant professor and CMHC Program Director at the University of San Diego. Megan A. Whitbeck, PhD, NCC, is an assistant professor at The University of Scranton. Ryan G. Carlson, PhD, is a professor at the University of South Carolina. Sejal Barden, PhD, is a professor at the University of Central Florida. Nicole Silverio is an assistant professor at the University of South Carolina. Correspondence may be addressed to Dalena Dillman Taylor, 1300 W. Highland St., Denton, TX 76201, Dalena.dillmantaylor@unt.edu.
Aug 20, 2021 | Volume 11 - Issue 3
Michael T. Kalkbrenner
Assessment literacy is an essential competency area for professional counselors who administer tests and interpret the results of participants’ scores. Using factor analysis to demonstrate internal structure validity of test scores is a key element of assessment literacy. The underuse of psychometrically sound instrumentation in professional counseling is alarming, as a careful review and critique of the internal structure of test scores is vital for ensuring the integrity of clients’ results. A professional counselor’s utilization of instrumentation without evidence of the internal structure validity of scores can have a number of negative consequences for their clients, including misdiagnoses and inappropriate treatment planning. The extant literature includes a series of articles on the major types and extensions of factor analysis, including exploratory factor analysis, confirmatory factor analysis (CFA), higher-order CFA, and multiple-group CFA. However, reading multiple psychometric articles can be overwhelming for professional counselors who are looking for comparative guidelines to evaluate the validity evidence of scores on instruments before administering them to clients. This article provides an overview for the layperson of the major types and extensions of factor analysis and can serve as reference for professional counselors who work in clinical, research, and educational settings.
Keywords: Factor analysis, overview, professional counseling, internal structure, validity
Professional counselors have a duty to ensure the veracity of tests before interpreting the results of clients’ scores because clients rely on their counselors to administer and interpret the results of tests that accurately represent their lived experience (American Educational Research Association [AERA] et al., 2014; National Board for Certified Counselors [NBCC], 2016). Internal structure validity of test scores is a key assessment literacy area and involves the extent to which the test items cluster together and represent the intended construct of measurement.
Factor analysis is a method for testing the internal structure of scores on instruments in professional counseling (Kalkbrenner, 2021b; Mvududu & Sink, 2013). The rigor of quantitative research, including psychometrics, has been identified as a weakness of the discipline, and instrumentation with sound psychometric evidence is underutilized by professional counselors (Castillo, 2020; C.-C. Chen et al., 2020; Mvududu & Sink, 2013; Tate et al., 2014). As a result, there is an imperative need for assessment literacy resources in the professional counseling literature, as assessment literacy is a critical competency for professional counselors who work in clinical, research, and educational settings alike.
Assessment Literacy in Professional Counseling
Assessment literacy is a crucial proficiency area for professional counselors, as counselors in a variety of the specialty areas of the Council for Accreditation of Counseling and Related Educational Programs (2015), such as clinical rehabilitation (5.D.1.g. & 5.D.3.a.), clinical mental health (5.C.1.e. & 5.C.3.a.), and addiction (5.A.1.f. & 5.A.3.a.), select and administer tests to clients and use the results to inform diagnosis and treatment planning, and to evaluate the utility of clinical interventions (Mvududu & Sink, 2013; NBCC, 2016; Neukrug & Fawcett, 2015). The extant literature includes a series of articles on factor analysis, including exploratory factor analysis (EFA; Watson, 2017), confirmatory factor analysis (CFA; Lewis, 2017), higher-order CFA (Credé & Harms, 2015), and multiple-group CFA (Dimitrov, 2010). However, reading several articles on factor analysis is likely to overwhelm professional counselors who are looking for a desk reference and/or comparative guidelines to evaluate the validity evidence of scores on instruments before administering them to clients. To these ends, professional counselors need a single resource (“one-stop shop”) that provides a brief and practical overview of factor analysis. The primary purpose of this manuscript is to provide an overview for the layperson of the major types and extensions of factor analysis that counselors can use as a desk reference.
Construct Validity and Internal Structure
Construct validity, the degree to which a test measures its intended theoretical trait, is a foundation of assessment literacy for demonstrating validity evidence of test scores (Bandalos & Finney, 2019). Internal structure validity, more specifically, is an essential aspect of construct validity and assessment literacy. Internal structure validity is vital for determining the extent to which items on a test combine to represent the construct of measurement (Bandalos & Finney, 2019). Factor analysis is a key method for testing the internal structure of scores on instruments in professional counseling as well as in social sciences research in general (Bandalos & Finney, 2019; Kalkbrenner, 2021b; Mvududu & Sink, 2013). In the following sections, I will provide a practical overview of the two primary methodologies of factor analysis (EFA and CFA) as well as the two main extensions of CFA (higher-order CFA and multiple-group CFA). These factor analytic techniques are particularly important elements of assessment literacy for professional counselors, as they are among the most common psychometric analyses used to validate scores on psychological screening tools (Kalkbrenner, 2021b). Readers might find it helpful to refer to Figure 1 before reading further to become familiar with some common psychometric terms that are discussed in this article and terms that also tend to appear in the measurement literature.
Figure 1
Technical and Layperson’s Definitions of Common Psychometric Terms
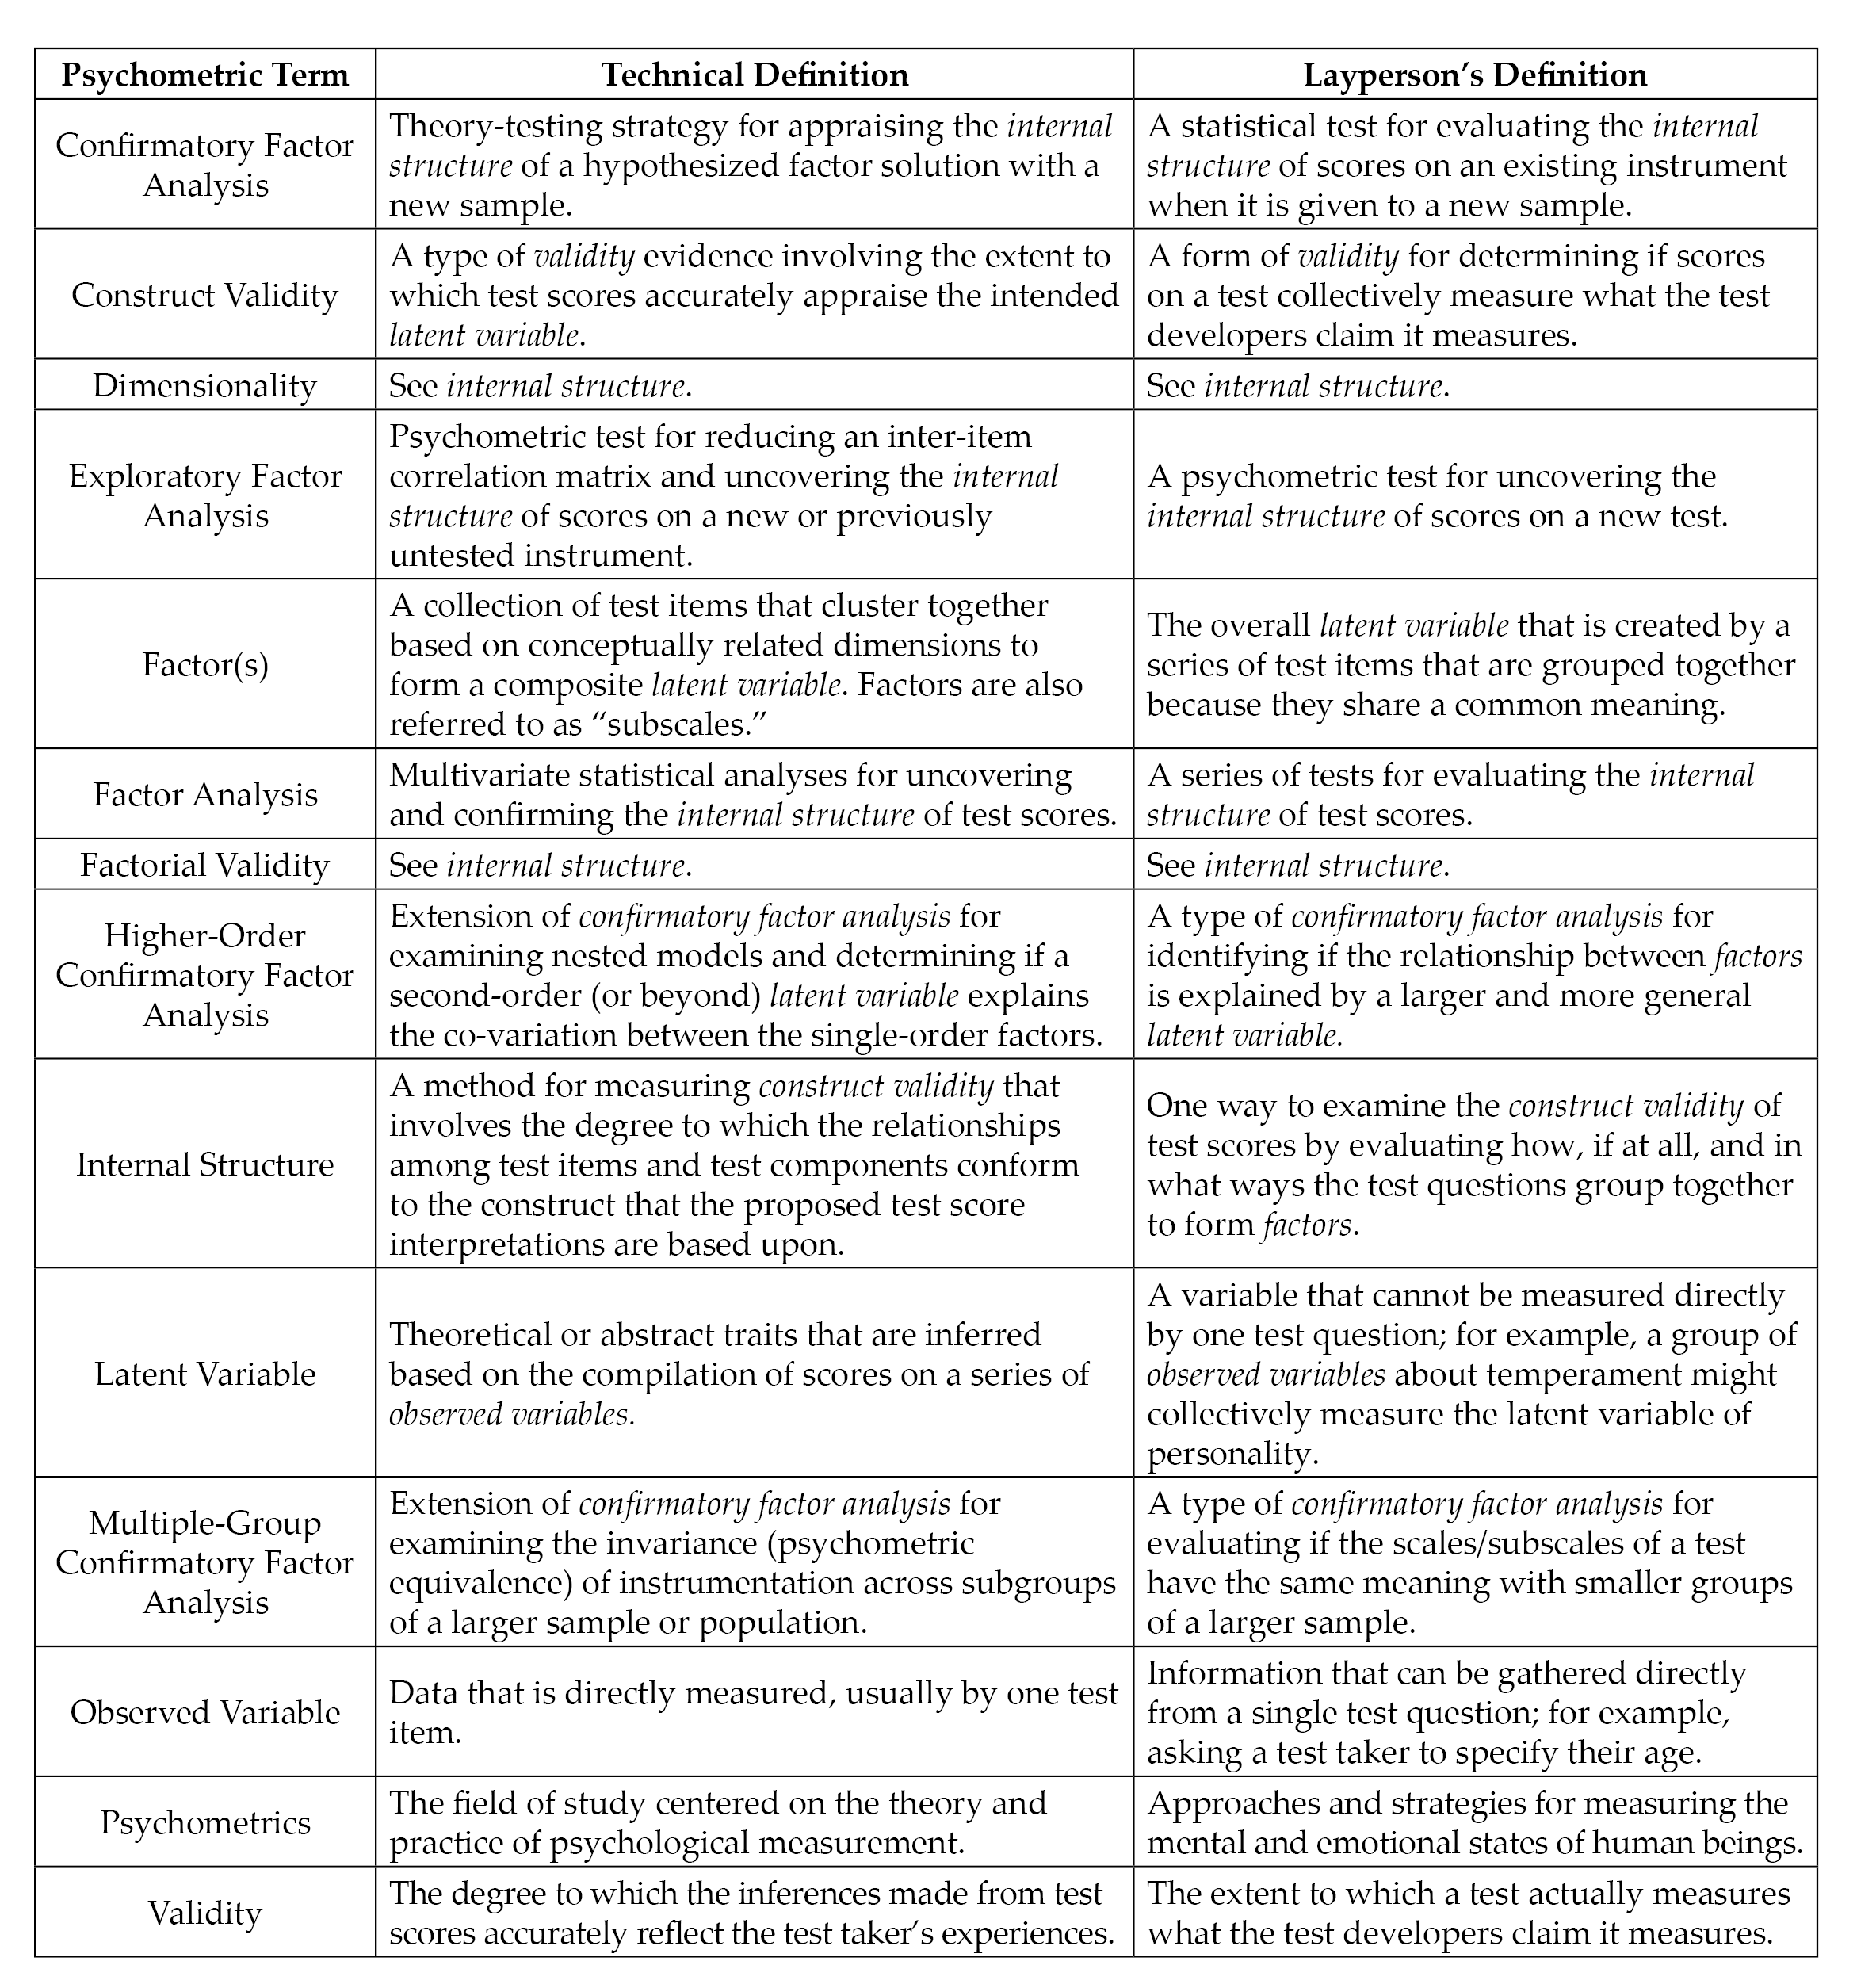 Note. Italicized terms are defined in this figure.
Exploratory Factor Analysis
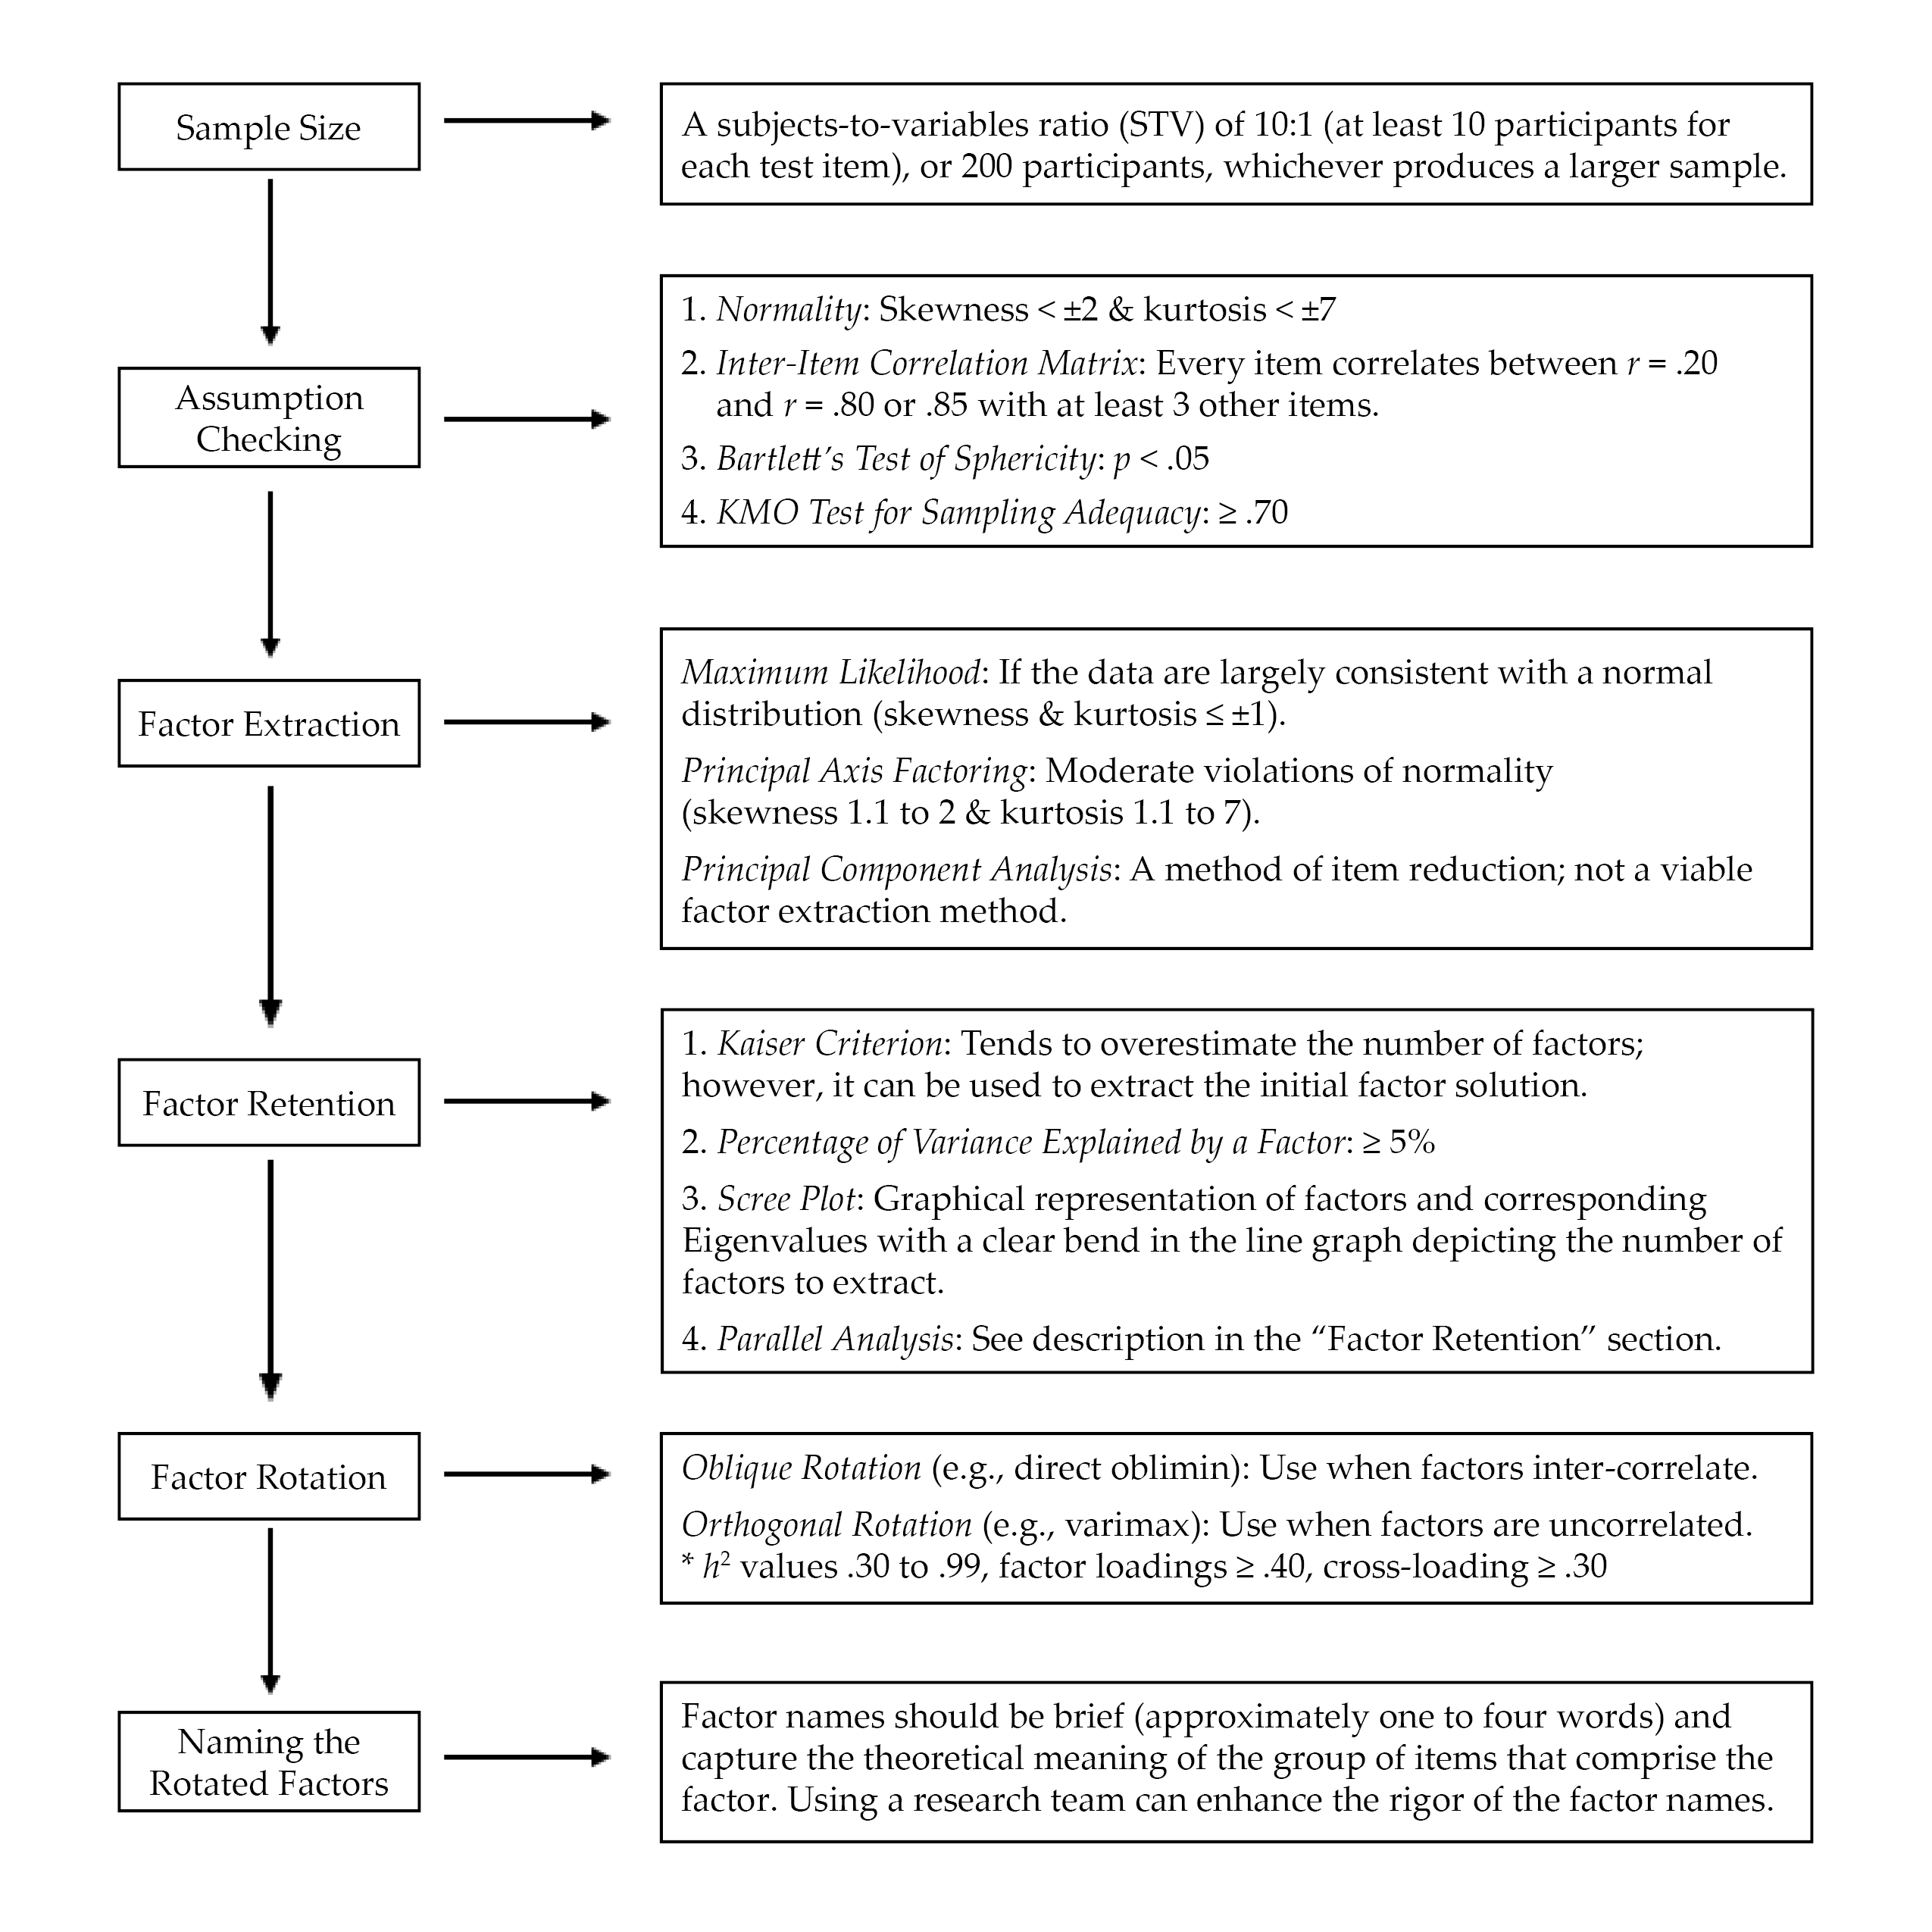
EFA is “exploratory” in that the analysis reveals how, if at all, test items band together to form factors or subscales (Mvududu & Sink, 2013; Watson, 2017). EFA has utility for testing the factor structure (i.e., how the test items group together to form one or more scales) for newly developed or untested instruments. When evaluating the rigor of EFA in an existing psychometric study or conducting an EFA firsthand, counselors should consider sample size, assumption checking, preliminary testing, factor extraction, factor retention, factor rotation, and naming rotated factors (see Figure 2).
EFA: Sample Size, Assumption Checking, and Preliminary Testing
Researchers should carefully select the minimum sample size for EFA before initiating data collection (Mvududu & Sink, 2013). My 2021 study (Kalkbrenner, 2021b) recommended that the minimal a priori sample size for EFA include either a subjects-to-variables ratio (STV) of 10:1 (at least 10 participants for each test item) or 200 participants, whichever produces a larger sample. EFA tends to be robust to moderate violations of normality; however, results are enriched if data are normally distributed (Mvududu & Sink, 2013). A review of skewness and kurtosis values is one way to test for univariate normality; according to Dimitrov (2012), extreme deviations from normality include skewness values > ±2 and kurtosis > ±7; however, ideally these values are ≤ ±1 (Mvududu & Sink, 2013). The Shapiro-Wilk and Kolmogorov-Smirnov tests can also be computed to test for normality, with non-significant p-values indicating that the parametric properties of the data are not statistically different from a normal distribution (Field, 2018); however, the Shapiro-Wilk and Kolmogorov-Smirnov tests are sensitive to large sample sizes and should be interpreted cautiously. In addition, the data should be tested for linearity (Mvududu & Sink, 2013). Furthermore, extreme univariate and multivariate outliers must be identified and dealt with (i.e., removed, transformed, or winsorized; see Field, 2018) before a researcher can proceed with factor analysis. Univariate outliers can be identified via z-scores (> 3.29), box plots, or scatter plots, and multivariate outliers can be discovered by computing Mahalanobis distance (see Field, 2018).
Figure 2
Flow Chart for Reviewing Exploratory Factor Analysis
Three preliminary tests are necessary to determine if data are factorable, including (a) an inter-item correlation matrix, (b) the Kaiser–Meyer–Olkin (KMO) test for sampling adequacy, and (c) Bartlett’s test of sphericity (Beavers et al., 2013; Mvududu & Sink, 2013; Watson, 2017). The purpose of computing an inter-item correlation matrix is to identify redundant items (highly correlated) and individual items that do not fit with any of the other items (weakly correlated). An inter-item correlation matrix is factorable if a number of correlation coefficients for each item are between approximately r = .20 and r = .80 or .85 (Mvududu & Sink, 2013; Watson, 2017). Generally, a factor or subscale should be composed of at least three items (Mvududu & Sink, 2013); thus, an item should display intercorrelations between r = .20 and r = .80/.85 with at least three other items. However, inter-item correlations in this range with five to 10+ items are desirable (depending on the total number of items in the inter-item correlation matrix).
Bartlett’s test of sphericity is computed to test if the inter-item correlation matrix is an identity matrix, in which the correlations between the items is zero (Mvududu & Sink, 2013). An identity matrix is completely unfactorable (Mvududu & Sink, 2013); thus, desirable findings are a significant p-value, indicating that the correlation matrix is significantly different from an identity matrix. Finally, before proceeding with EFA, researchers should compute the KMO test for sampling adequacy, which is a measure of the shared variance among the items in the correlation matrix (Watson, 2017). Kaiser (1974) suggested the following guidelines for interpreting KMO values: “in the .90s – marvelous, in the .80s – meritorious, in the .70s – middling, in the .60s – mediocre, in the .50s – miserable, below .50 – unacceptable” (p. 35).
Factor Extraction Methods
Factor extraction produces a factor solution by dividing up shared variance (also known as common variance) between each test item from its unique variance, or variance that is not shared with any other variables, and error variance, or variation in an item that cannot be accounted for by the factor solution (Mvududu & Sink, 2013). Historically, principal component analysis (PCA) was the dominant factor extraction method used in social sciences research. PCA, however, is now considered a method of data reduction rather than an approach to factor analysis because PCA extracts all of the variance (shared, unique, and error) in the model. Thus, although PCA can reduce the number of items in an inter-item correlation matrix, one cannot be sure if the factor solution is held together by shared variance (a potential theoretical model) or just by random error variance.
More contemporary factor extraction methods that only extract shared variance—for example, principal axis factoring (PAF) and maximum likelihood (ML) estimation methods—are generally recommended for EFA (Mvududu & Sink, 2013). PAF has utility if the data violate the assumption of normality, as PAF is robust to modest violations of normality (Mvududu & Sink, 2013). If, however, data are largely consistent with a normal distribution (skewness and kurtosis values ≤ ±1), researchers should consider using the ML extraction method. ML is advantageous, as it computes the likelihood that the inter-item correlation matrix was acquired from a population in which the extracted factor solution is a derivative of the scores on the items (Watson, 2017).
Factor Retention. Once a factor extraction method is deployed, psychometric researchers are tasked with retaining the most parsimonious (simple) factor solution (Watson, 2017), as the purpose of factor analysis is to account for the maximum proportion of variance (ideally, 50%–75%+) in an inter-item correlation matrix while retaining the fewest possible number of items and factors (Mvududu & Sink, 2013). Four of the most commonly used criteria for determining the appropriate number of factors to retain in social sciences research include the (a) Kaiser criterion, (b) percentage of variance among items explained by each factor, (c) scree plot, and (d) parallel analysis (Mvududu & Sink, 2013; Watson, 2017). Kaiser’s criterion is a standard for retaining factors with Eigenvalues (EV) ≥ 1. An EV represents the proportion of variance that is explained by each factor in relation to the total amount of variance in the factor matrix.
The Kaiser criterion tends to overestimate the number of retainable factors; however, this criterion can be used to extract an initial factor solution (i.e., when computing the EFA for the first time). Interpreting the percentage of variance among items explained by each factor is another factor retention criterion based on the notion that a factor must account for a large enough percentage of variance to be considered meaningful (Mvududu & Sink, 2013). Typically, a factor should account for at least 5% of the variance in the total model. A scree plot is a graphical representation or a line graph that depicts the number of factors on the X-axis and the corresponding EVs on the Y-axis (see Figure 6 in Mvududu & Sink, 2013, p. 87, for a sample scree plot). The cutoff for the number of factors to retain is portrayed by a clear bend in the line graph, indicating the point at which additional factors fail to contribute a substantive amount of variance to the total model. Finally, in a parallel analysis, EVs are generated from a random data set based on the number of items and the sample size of the real (sample) data. The factors from the sample data with EVs larger than the EVs from the randomly generated data are retained based on the notion that these factors explain more variance than would be expected by random chance. In some instances, these four criteria will reveal different factor solutions. In such cases, researchers should retain the simplest factor solution that makes both statistical and substantive sense.
Factor Rotation. After determining the number of factors to retain, researchers seek to uncover the association between the items and the factors or subscales (i.e., determining which items load on which factors) and strive to find simple structure or items with high factor loadings (close to ±1) on one factor and low factor loadings (near zero) on the other factors (Watson, 2017). The factors are rotated on vectors to enhance the readability or detection of simple structure (Mvududu & Sink, 2013). Orthogonal rotation methods (e.g., varimax, equamax, and quartimax) are appropriate when a researcher is measuring distinct or uncorrelated constructs of measurement. However, orthogonal rotation methods are rarely appropriate for use in counseling research, as counselors almost exclusively appraise variables that display some degree of inter-correlation (Mvududu & Sink, 2013). Oblique rotation methods (e.g., direct oblimin and promax) are generally more appropriate in counseling research, as they allow factors to inter-correlate by rotating the data on vectors at angles less than 90○. The nature of oblique rotations allows the total variance accounted for by each factor to overlap; thus, the total variance explained in a post–oblique rotated factor solution can be misleading (Bandalos & Finney, 2019). For example, the total variance accounted for in a post–oblique rotated factor solution might add up to more than 100%. To this end, counselors should report the total variance explained by the factor solution before rotation as well as the sum of each factor’s squared structure coefficient following an oblique factor rotation.
Following factor rotation, researchers examine a number of factor retention criteria to determine the items that load on each factor (Watson, 2017). Commonality values (h2) represent the proportion of variance that the extracted factor solution explains for each item. Items with h2 values that range between .30 and .99 should be retained, as they share an adequate amount of shared variance with the other items and factors (Watson, 2017). Items with small h2 values (< .30) should be considered for removal. However, commonality values should not be too high (≥ 1), as this suggests one’s sample size was insufficient or too many factors were extracted (Watson, 2017). Items with problematic h2 values should be removed one at a time, and the EFA should be re-computed after each removal because these values will fluctuate following each deletion. Oblique factor rotation methods produce two matrices, including the pattern matrix, which displays the relationship between the items and a factor while controlling for the items’ association with the other factors, and the structure matrix, which depicts the correlation between the items and all of the factors (Mvududu & Sink, 2013). Researchers should examine both the pattern and the structure matrices and interpret the one that displays the clearest evidence of simple structure with the least evidence of cross-loadings.
Items should display a factor loading of at least ≥ .40 (≥ .50 is desirable) to mark a factor. Items that fail to meet a minimum factor loading of ≥ .40 should be deleted. Cross-loading is evident when an item displays factor loadings ≥ .30 to .35 on two or more factors (Beavers et al., 2013; Mvududu & Sink, 2013; Watson, 2017). Researchers may elect to assign a variable to one factor if that item’s loading is .10 higher than the next highest loading. Items that cross-load might also be deleted. Once again, items should be deleted one at a time and the EFA should be re-computed after each removal.
Naming the Rotated Factors
The final step in EFA is naming the rotated factors; factor names should be brief (approximately one to four words) and capture the theoretical meaning of the group of items that comprise the factor (Mvududu & Sink, 2013). This is a subjective process, and the literature is lacking consistent guidelines for the process of naming factors. A research team can be incorporated into the process of naming their factors. Test developers can separately name each factor and then meet with their research team to discuss and eventually come to an agreement about the most appropriate name for each factor.
Confirmatory Factor Analysis
CFA is an application of structural equation modeling for testing the extent to which a hypothesized factor solution (e.g., the factor solution that emerged in the EFA or another existing factor solution) demonstrates an adequate fit with a different sample (Kahn, 2006; Lewis, 2017). When validating scores on a new test, investigators should compute both EFA and CFA with two different samples from the same population, as the emergent internal structure in EFA can vary substantially. Researchers can collect two sequential samples or they may elect to collect one large sample and divide it into two smaller samples, one for EFA and the second for CFA.
Evaluating model fit in CFA is a complex task that is typically determined by examining the collective implications of multiple goodness-of-fit (GOF) indices, which include absolute, incremental, and parsimonious (Lewis, 2017). Absolute fit indices evaluate the extent to which the hypothesized model or the dimensionality of the existing measure fits with the data collected from a new sample. Incremental fit indices compare the improvement in fit between the hypothesized model and a null model (also referred to as an independence model) in which there is no correlation between observed variables. Parsimonious fit indices take the model’s complexity into account by testing the extent to which model fit is improved by estimating fewer pathways (i.e., creating a more parsimonious or simple model). Psychometric researchers generally report a combination of absolute, incremental, and parsimonious fit indices to demonstrate acceptable model fit (Mvududu & Sink, 2013). Table 1 includes tentative guidelines for interpreting model fit based on the synthesized recommendations of leading psychometric researchers from a comprehensive search of the measurement literature (Byrne, 2016; Dimitrov, 2012; Fabrigar et al., 1999; Hooper et al., 2008; Hu & Bentler, 1999; Kahn, 2006; Lewis, 2017; Mvududu & Sink, 2013; Schreiber et al., 2006; Worthington & Whittaker, 2006).
Table 1
Fit Indices and Tentative Thresholds for Evaluating Model Fit
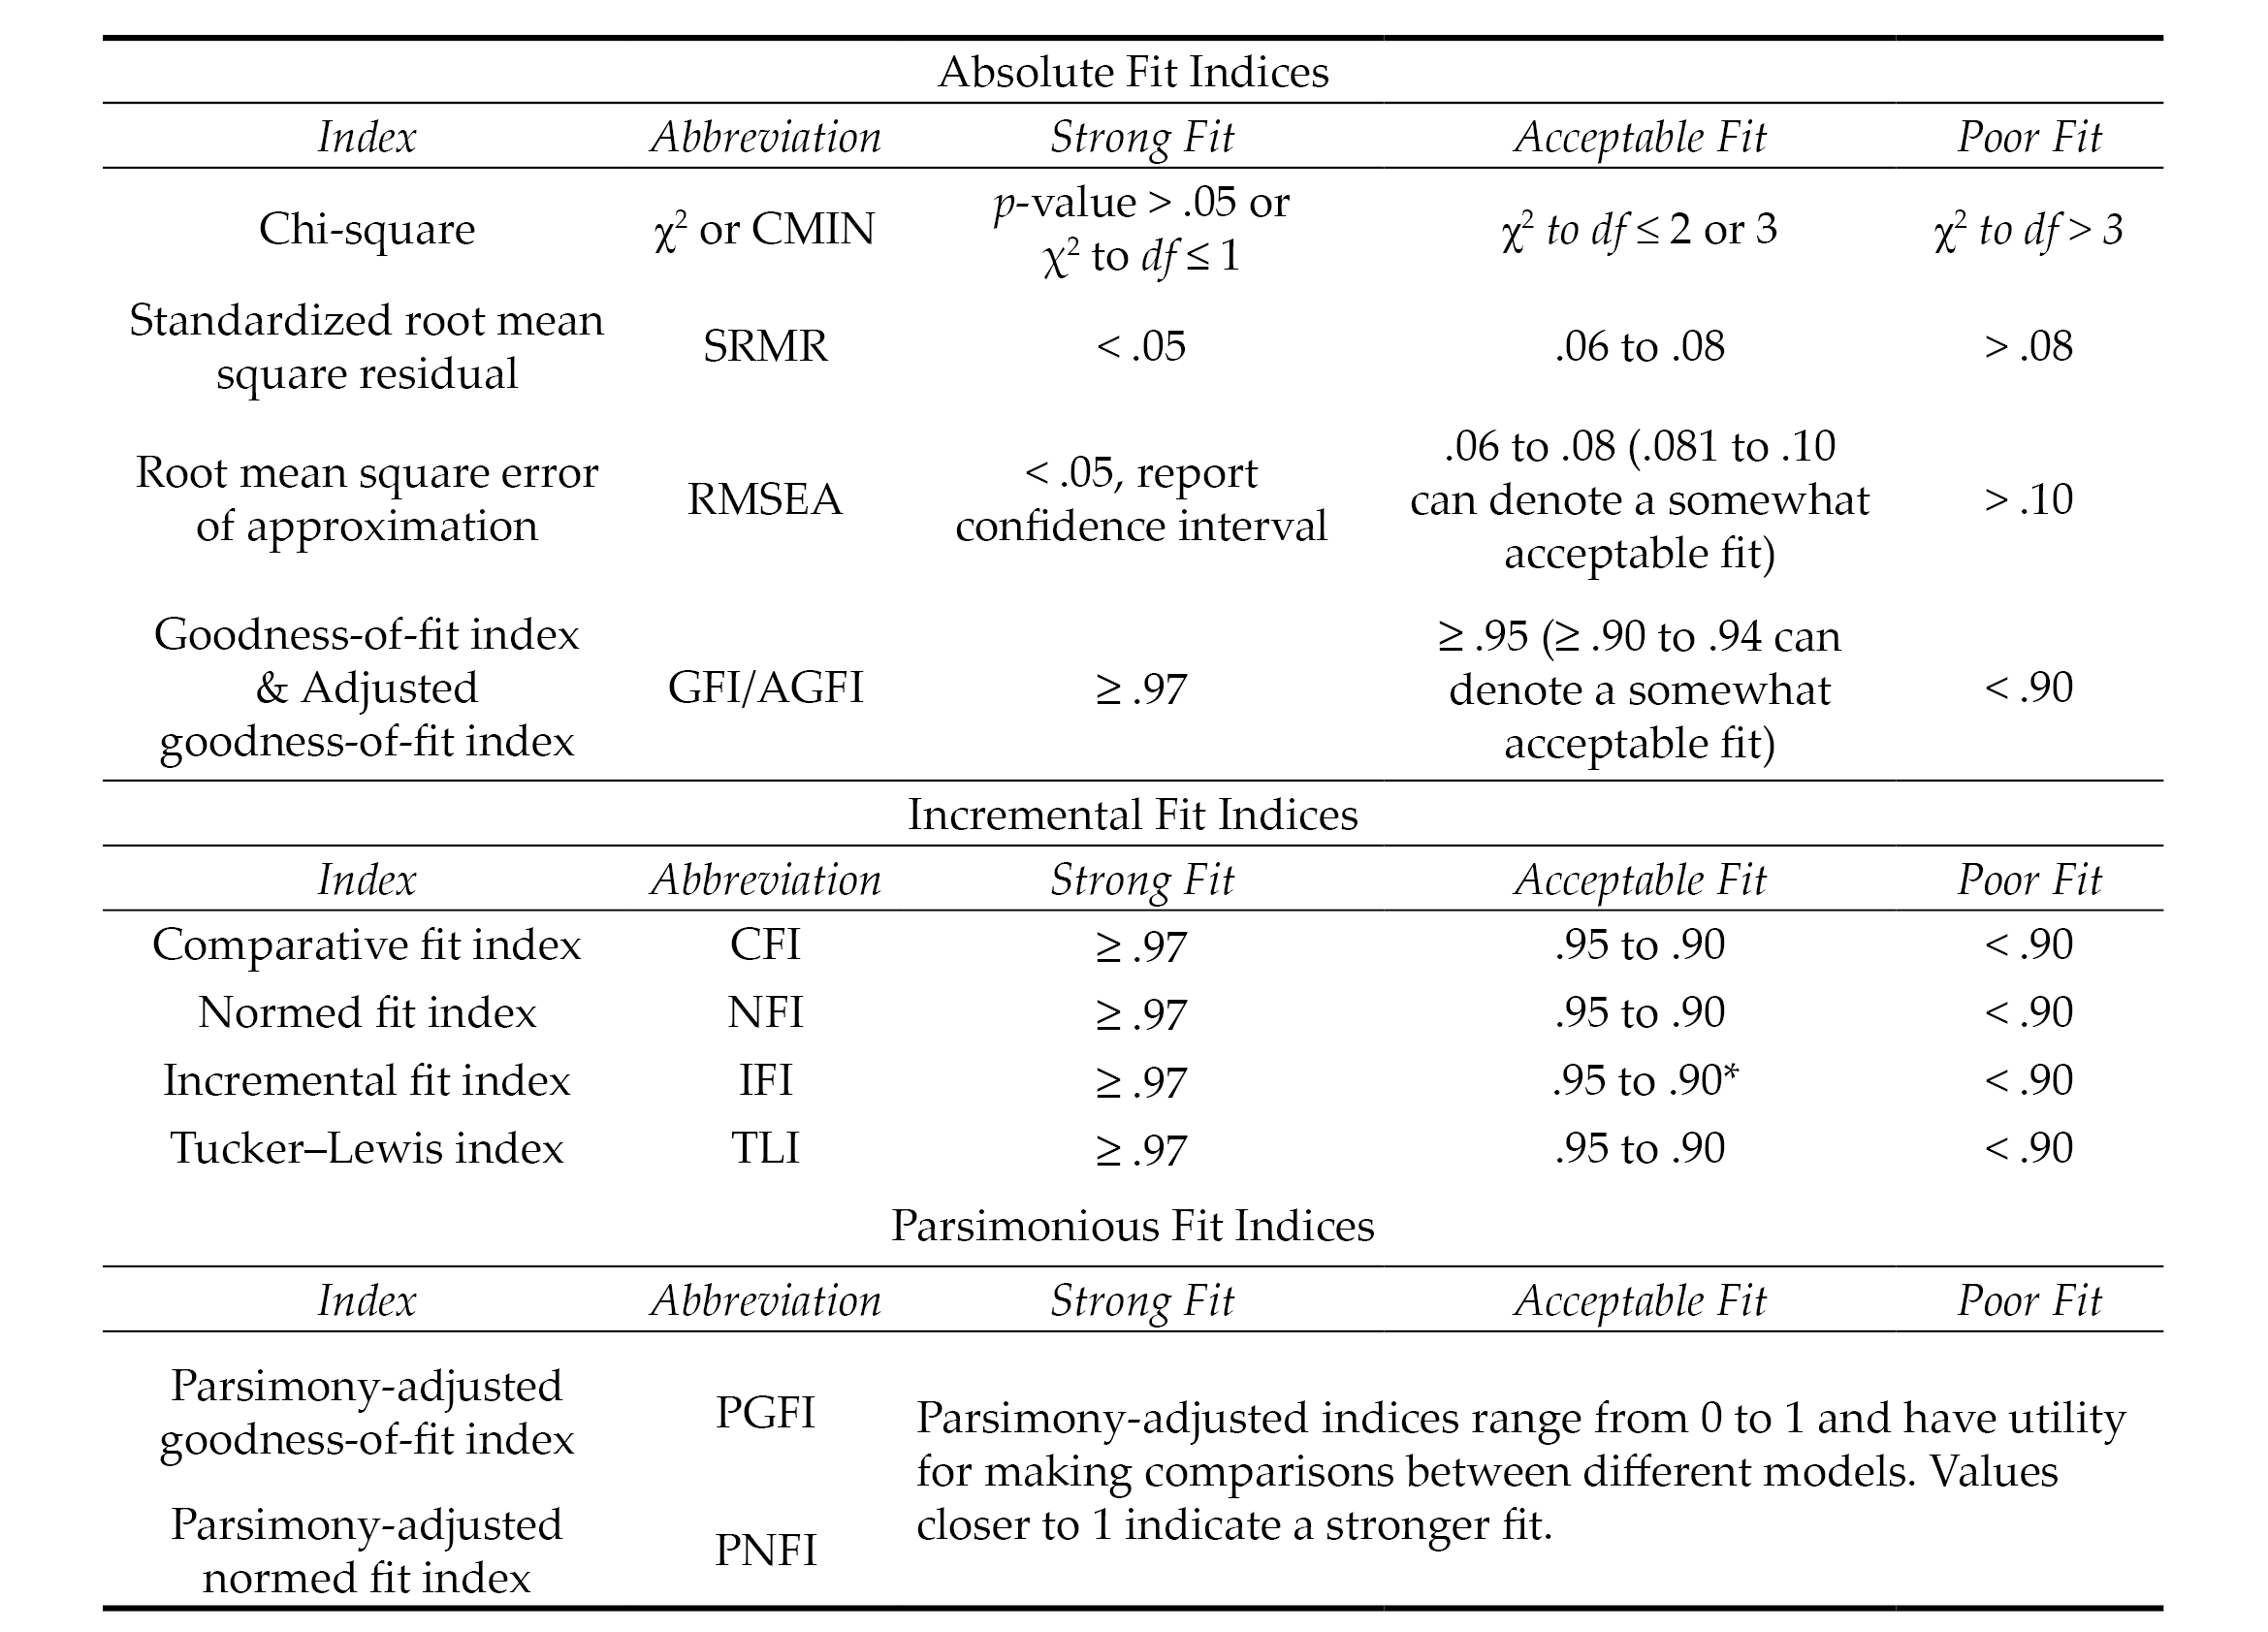
Note. The fit indices and benchmarks to estimate the degree of model fit in this table are offered as tentative guidelines for scores on attitudinal measures based on the synthesized recommendations of numerous psychometric researchers (see citations in the “Confirmatory Factor Analysis” section of this article). The list of fit indices in this table are not all-inclusive (i.e., not all of them are typically reported). There is no universal approach for determining which fit indices to investigate nor are there any absolute thresholds for determining the degree of model fit. No single fix index is sufficient for determining model fit. Researchers are tasked with selecting and interpreting fit indices holistically (i.e., collectively), in ways that make both statistical and substantive sense based on their construct of measurement and goals of the study.
*.90 to .94 can denote an acceptable model fit for incremental fix indices; however, the majority of values should be ≥ .95.
Model Respecification
The results of a CFA might reveal a poor or unacceptable model fit (see Table 1), indicating that the dimensionality of the hypothesized model that emerged from the EFA was not replicated or confirmed with a second sample (Mvududu & Sink, 2013). CFA is a rigorous model-fitting procedure and poor model fit in a CFA might indicate that the EFA-derived factor solution is insufficient for appraising the construct of measurement. CFA, however, is a more stringent test of structural validity than EFA, and psychometric researchers sometimes refer to the modification indices (also referred to as Lagrange multiplier statistics), which denote the expected decrease in the X2 value (i.e., degree of improvement in model fit) if the parameter is freely estimated (Dimitrov, 2012). In these instances, correlating the error terms between items or removing problematic items will improve model fit; however, when considering model respecification, psychometric researchers should proceed cautiously, if at all, as a strong theoretical justification is necessary to defend model respecification (Byrne, 2016; Lewis, 2017; Schreiber et al., 2006). Researchers should also be clear that model respecification causes the CFA to become an EFA because they are investigating the dimensionality of a different or modified model rather than confirming the structure of an existing, hypothesized model.
Higher-Order CFA
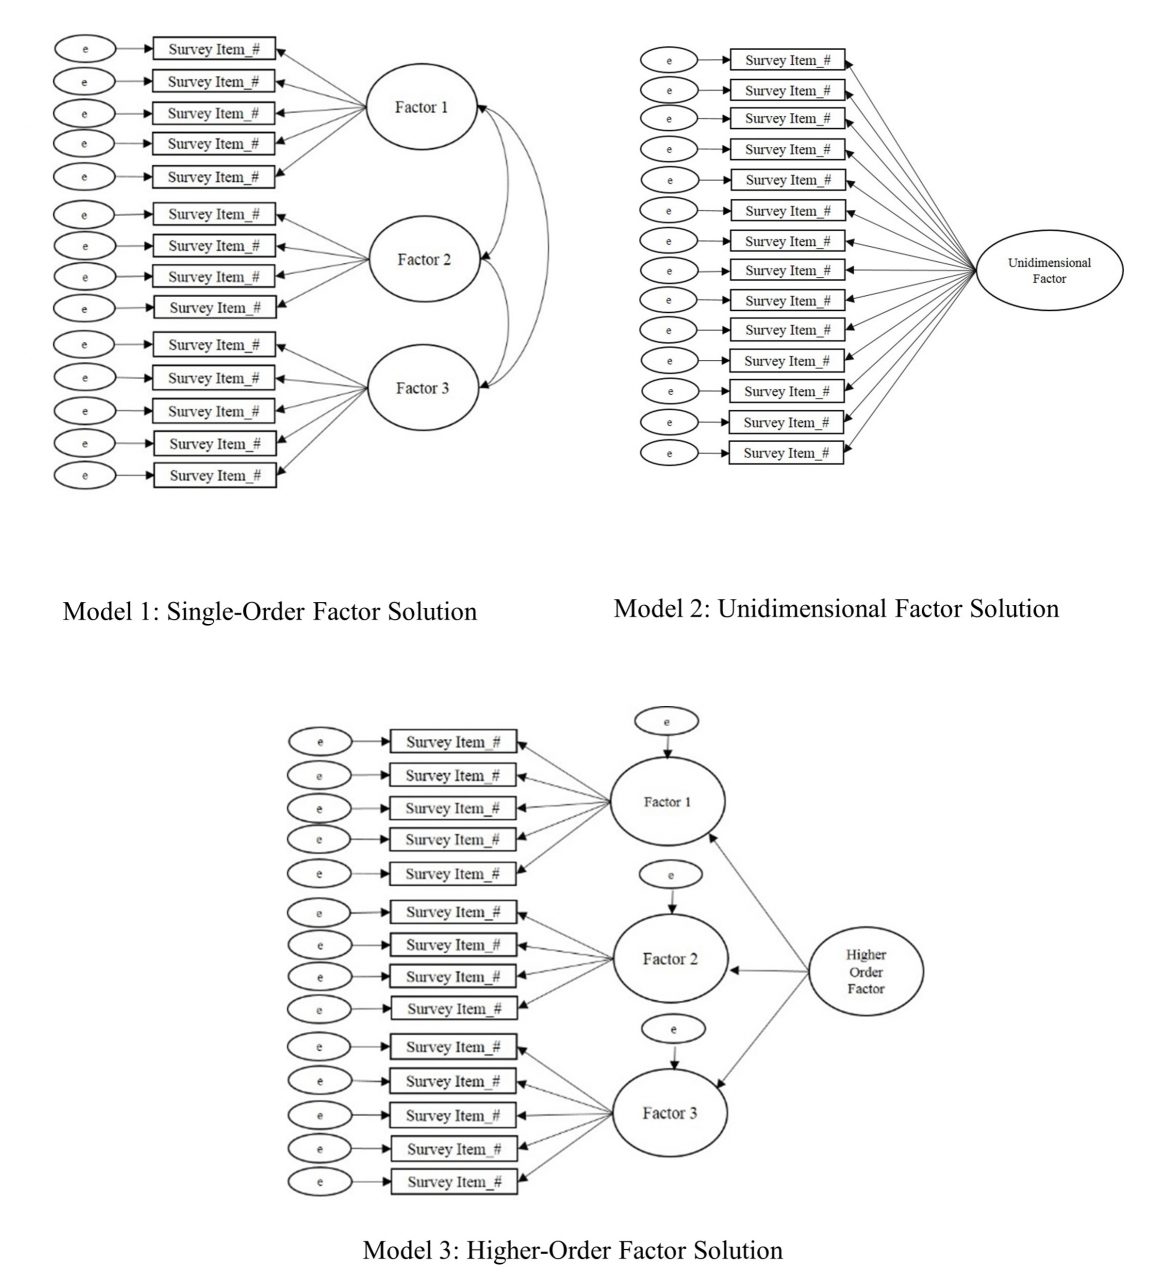
Higher-order CFA is an extension of CFA that allows researchers to test nested models and determine if a second-order latent variable (factor) explains the associations between the factors in a single-order CFA (Credé & Harms, 2015). Similar to single-order CFA (see Figure 3, Model 1) in which the test items cluster together to form the factors or subscales, higher-order CFA reveals if the factors are related to one another strongly enough to suggest the presence of a global factor (see Figure 3, Model 3). Suppose, for example, the test developer of a scale for measuring dimensions of the therapeutic alliance confirmed the three following subscales via single-order CFA (see Figure 3, Model 1): Empathy, Unconditional Positive Regard, and Congruence. Computing a higher-order CFA would reveal if a higher-order construct, which the research team might name Therapeutic Climate, is present in the data. In other words, higher-order CFA reveals if Empathy, Unconditional Positive Regard, and Congruence, collectively, comprise the second-order factor of Therapeutic Climate.
Determining if a higher-order factor explains the co-variation (association) between single-order factors is a complex undertaking. Thus, researchers should consider a number of criteria when deciding if their data are appropriate for higher-order CFA (Credé & Harms, 2015). First, moderate-to-strong associations (co-variance) should exist between first-order factors. Second, the unidimensional factor solution (see Figure 3, Model 2) should display a poor model fit (see Table 1) with the data. Third, theoretical support should exist for the presence of a higher-order factor. Referring to the example in the previous paragraph, person-centered therapy provides a theory-based explanation for the presence of a second-order or global factor (Therapeutic Climate) based on the integration of the single-order factors (Empathy, Unconditional Positive Regard, and Congruence). In other words, the presence of a second-order factor suggests that Therapeutic Climate explains the strong association between Empathy, Unconditional Positive Regard, and Congruence.
Finally, the single-order factors should display strong factor loadings (approximately ≥ .70) on the higher-order factor. However, there is not an absolute consensus among psychometric researchers regarding the criteria for higher-order CFA and the criteria summarized in this section are not a dualistic decision rule for retaining or rejecting a higher-order model. Thus, researchers are tasked with presenting that their data meet a number of criteria to justify the presence of a higher-order factor. If the results of a higher-order CFA reveal an acceptable model fit (see Table 1), researchers should directly compare (e.g., chi-squared test of difference) the single-order and higher-order models to determine if one model demonstrates a superior fit with the data at a statistically significant level.
Figure 3
Single-Order, Unidimensional, and Higher-Order Factor Solutions
Multiple-Group Confirmatory Factor Analysis
Multiple-group confirmatory factor analysis (MCFA) is an extension of CFA for testing the factorial invariance (psychometric equivalence) of a scale across subgroups of a sample or population (C.-C. Chen et al., 2020; Dimitrov, 2010). In other words, MCFA has utility for testing the extent to which a particular construct has the same meaning across different groups of a larger sample or population. Suppose, for example, the developer of the Therapeutic Climate scale (see example in the previous section) validated scores on their scale with undergraduate college students. Invariance testing has potential to provide further support for the internal structure validity of the scale by testing whether Empathy, Unconditional Positive Regard, and Congruence have the same meaning across different subgroups of undergraduate college students (e.g., between different gender identities, ethnic identities, age groups, and other subgroups of the larger sample).
Levels of Invariance. Factorial invariance can be tested in a number of different ways and includes the following primary levels or aspects: (a) configural invariance, (b) measurement (metric, scalar, and strict) invariance, and (c) structural invariance (Dimitrov, 2010, 2012). Configural invariance (also referred to as pattern invariance) serves as the baseline mode (typically the best fitting model with the data), which is used as the point of comparison when testing for metric, scalar, and structural invariance. In layperson’s terms, configural invariance is a test of whether the scales are approximately similar across groups.
Measurement invariance includes testing for metric and scalar invariance. Metric invariance is a test of whether each test item makes an approximately equal contribution (i.e., approximately equal factor loadings) to the latent variable (composite scale score). In layperson’s terms, metric invariance evaluates if the scale reasonably captures the same construct. Scalar invariance adds a layer of rigor to metric invariance by testing if the differences between the average scores on the items are attributed to differences in the latent variable means. In layperson’s terms, scalar invariance indicates that if the scores change over time, they change in the same way.
Strict invariance is the most stringent level of measurement invariance testing and tests if the sum total of the items’ unique variance (item variation that is not in common with the factor) is comparable to the error variance across groups. In layperson’s terms, the presence of strict invariance demonstrates that score differences between groups are exclusively due to differences in the common latent variables. Strict invariance, however, is typically not examined in social sciences research because the latent factors are not composed of residuals. Thus, residuals are negligible when evaluating mean differences in latent scores (Putnick & Bornstein, 2016).
Finally, structural invariance is a test of whether the latent factor variances are equivalent to the factor covariances (Dimitrov, 2010, 2012). Structural invariance tests the null hypothesis that there are no statistically significant differences between the unconstrained and constrained models (i.e., determines if the unconstrained model is equivalent to the constrained model). Establishing structural invariance indicates that when the structural pathways are allowed to vary across the two groups, they naturally produce equal results, which supports the notion that the structure of the model is invariant across both groups. In layperson’s terms, the presence of structural invariance indicates that the pathways (directionality) between variables behave in the same way across both groups. It is necessary to establish configural and metric invariance prior to testing for structural invariance.
Sample Size and Criteria for Evaluating Invariance. Researchers should check their sample size before computing invariance testing, as small samples (approximately < 200) can overestimate model fit (Dimitrov, 2010). Similar to single-order CFA, no absolute sample size guidelines exist in the literature for invariance testing. Generally, a minimum sample of at least 200 participants per group is recommended for invariance testing (although < 200 to 300+ is advantageous). Referring back to the Therapeutic Climate scale example (see the previous section), investigators would need a minimum sample of 400 if they were seeking to test the invariance of the scale by generational status (200 first generation + 200 non-first generation = 400). The minimum sample size would increase as more levels are added. For example, a minimum sample of 600 would be recommended if investigators quantified generational status on three levels (200 first generation + 200 second generation + 200 third generation and beyond = 600).
Factorial invariance is investigated through a computation of the change in model fit at each level of invariance testing (F. F. Chen, 2007). Historically, the Satorra and Bentler chi-square difference test was the sole criteria for testing factorial invariance, with a non-significant p-value indicating factorial invariance (Putnick & Bornstein, 2016). The chi-square difference test is still commonly reported by contemporary psychometric researchers; however, it is rarely used as the sole criteria for determining invariance, as the test is sensitive to large samples. The combined recommendations of F. F. Chen (2007) and Putnick and Bornstein (2016) include the following thresholds for investigating invariance: ≤ ∆ 0.010 in CFI, ≤ ∆ 0.015 in RMSEA, and ≤ ∆ 0.030 in SRMR for metric invariance or ≤ ∆ 0.015 in SRMR for scalar invariance. In a simulation study, Kang et al. (2016) found that McDonald’s NCI (MNCI) outperformed the CFI in terms of stability. Kang et al. (2016) recommend < ∆ 0.007 in MNCI for the 5th percentile and ≤ ∆ 0.007 in MNCI for the 1st percentile as cutoff values for measurement quality. Strong measurement invariance is achieved when both metric and scalar invariance are met, and weak invariance is accomplished when only metric invariance is present (Dimitrov, 2010).
Exemplar Review of a Psychometric Study
The following section will include a review of an exemplar psychometric study based on the recommendations for EFA (see Figure 2) and CFA (see Table 1) that are provided in this manuscript. In 2020, I collaborated with Ryan Flinn on the development and validation of scores on the Mental Distress Response Scale (MDRS) for appraising how college students are likely to respond when encountering a peer in mental distress (Kalkbrenner & Flinn, 2020). A total of 13 items were entered into an EFA. Following the steps for EFA (see Figure 1), the sample size (N = 569) exceeded the guidelines for sample size that I published in my 2021 article (Kalkbrenner, 2021b), including an STV of 10:1 or 200 participants, whichever produces a larger sample. Flinn and I (2020) ensured that our 2020 study’s data were consistent with a normal distribution (skewness & kurtosis values ≤ ±1) and computed preliminary assumption checking, including inter-item correlation matrix, KMO (.73), and Bartlett’s test of sphericity (p < .001).
An ML factor extraction method was employed, as the data were largely consistent (skewness & kurtosis values ≤ ±1) with a normal distribution. We used the three most rigorous factor retention criteria—percentage of variance accounted for, scree test, and parallel analysis—to extract a two-factor solution. An oblique factor rotation method (direct oblimin) was employed, as the two factors were correlated. We referred to the recommended factor retention criteria, including h2 values .30 to .99, factor loadings ≥ .40, and cross-loading ≥ .30, to eliminate one item with low commonalities and two cross-loading items. Using a research team, we named the first factor Diminish/Avoid, as each item that marked this factor reflected a dismissive or evasive response to encountering a peer in mental distress. The second factor was named Approach/Encourage because each item that marked this factor included a response to a peer in mental distress that was active and likely to help connect their peer to mental health support services.
Our next step was to compute a CFA by administering the MDRS to a second sample of undergraduate college students to confirm the two-dimensional factor solution that emerged in the EFA. The sample size (N = 247) was sufficient for CFA (STV > 10:1 and > 200 participants). The MDRS items were entered into a CFA and the following GOF indices emerged: CMIN = χ2 (34) = 61.34, p = .003, CMIN/DF = 1.80, CFI = .96, IFI = .96, RMSEA = .06, 90% CI [0.03, 0.08], and SRMR = .04. A comparison between our GOF indices from the 2020 study with the thresholds for evaluating model fit in Table 1 reveal an acceptable-to-strong fit between the MDRS model and the data. Collectively, our 2020 procedures for EFA and CFA were consistent with the recommendations in this manuscript.
Implications for the Profession
Implications for Counseling Practitioners
Assessment literacy is a vital component of professional counseling practice, as counselors who practice in a variety of specialty areas select and administer tests to clients and use the results to inform diagnosis and treatment planning (C.-C. Chen et al., 2020; Mvududu & Sink, 2013; NBCC, 2016; Neukrug & Fawcett, 2015). It is important to note that test results alone should not be used to make diagnoses, as tests are not inherently valid (Kalkbrenner, 2021b). In fact, the authors of the Diagnostic and Statistical Manual of Mental Disorders stated that “scores from standardized measures and interview sources must be interpreted using clinical judgment” (American Psychiatric Association, 2013, p. 37). Professional counselors can use test results to inform their diagnoses; however, diagnostic decision making should ultimately come down to a counselor’s clinical judgment.
Counseling practitioners can refer to this manuscript as a reference for evaluating the internal structure validity of scores on a test to help determine the extent to which, if any at all, the test in question is appropriate for use with clients. When evaluating the rigor of an EFA for example, professional counselors can refer to this manuscript to evaluate the extent to which test developers followed the appropriate procedures (e.g., preliminary assumption checking, factor extraction, retention, and rotation [see Figure 2]). Professional counselors are encouraged to pay particular attention to the factor extraction method that the test developers employed, as PCA is sometimes used in lieu of more appropriate methods (e.g., PAF/ML). Relatedly, professional counselors should be vigilant when evaluating the factor rotation method employed by test developers because oblique rotation methods are typically more appropriate than orthogonal (e.g., varimax) for counseling tests.
CFA is one of the most commonly used tests of the internal structure validity of scores on psychological assessments (Kalkbrenner, 2021b). Professional counselors can compare the CFA fit indices in a test manual or journal article to the benchmarks in Table 1 and come to their own conclusion about the internal structure validity of scores on a test before using it with clients. Relatedly, the layperson’s definitions of common psychometric terms in Figure 1 might have utility for increasing professional counselors’ assessment literacy by helping them decipher some of the psychometric jargon that commonly appears in psychometric studies and test manuals.
Implications for Counselor Education
Assessment literacy begins in one’s counselor education program and it is imperative that counselor educators teach their students to be proficient in recognizing and evaluating internal structure validity evidence of test scores. Teaching internal structure validity evidence can be an especially challenging pursuit because counseling students tend to fear learning about psychometrics and statistics (Castillo, 2020; Steele & Rawls, 2015), which can contribute to their reticence and uncertainty when encountering psychometric research. This reticence can lead one to read the methodology section of a psychometric study briefly, if at all. Counselor educators might suggest the present article as a resource for students taking classes in research methods and assessment as well as for students who are completing their practicum, internship, or dissertation who are evaluating the rigor of existing measures for use with clients or research participants.
Counselor educators should urge their students not to skip over the methodology section of a psychometric study. When selecting instrumentation for use with clients or research participants, counseling students and professionals should begin by reviewing the methodology sections of journal articles and test manuals to ensure that test developers employed rigorous and empirically supported procedures for test development and score validation. Professional counselors and their students can compare the empirical steps and guidelines for structural validation of scores that are presented in this manuscript with the information in test manuals and journal articles of existing instrumentation to evaluate its internal structure. Counselor educators who teach classes in assessment or psychometrics might integrate an instrument evaluation assignment into the course in which students select a psychological instrument and critique its psychometric properties. Another way that counselor educators who teach classes in current issues, research methods, assessment, or ethics can facilitate their students’ assessment literacy development is by creating an assignment that requires students to interview a psychometric researcher. Students can find psychometric researchers by reviewing the editorial board members and authors of articles published in the two peer-reviewed journals of the Association for Assessment and Research in Counseling, Measurement and Evaluation in Counseling and Development and Counseling Outcome Research and Evaluation. Students might increase their interest and understanding about the necessity of assessment literacy by talking to researchers who are passionate about psychometrics.
Assessment Literacy: Additional Considerations
Internal structure validity of scores is a crucial component of assessment literacy for evaluating the construct validity of test scores (Bandalos & Finney, 2019). Assessment literacy, however, is a vast construct and professional counselors should consider a number of additional aspects of test worthiness when evaluating the potential utility of instrumentation for use with clients. Reviewing these additional considerations is beyond the scope of this manuscript; however, readers can refer to the following features of assessment literacy and corresponding resources: reliability (Kalkbrenner, 2021a), practicality (Neukrug & Fawcett, 2015), steps in the instrument development process (Kalkbrenner, 2021b), and convergent and divergent validity evidence of scores (Swank & Mullen, 2017). Moreover, the discussion of internal structure validity evidence of scores in this manuscript is based on Classical Test Theory (CTT), which tends to be an appropriate platform for attitudinal measures. However, Item Response Theory (see Amarnani, 2009) is an alternative to CTT with particular utility for achievement and aptitude testing.
Cross-Cultural Considerations in Assessment Literacy
Professional counselors have an ethical obligation to consider the cross-cultural fairness of a test before use with clients, as the validity of test scores are culturally dependent (American Counseling Association [ACA], 2014; Kane, 2010; Neukrug & Fawcett, 2015; Swanepoel & Kruger, 2011). Cross-cultural fairness (also known as test fairness) in testing and assessment “refers to the comparability of score meanings across individuals, groups or settings” (Swanepoel & Kruger, 2011, p. 10). There exists some overlap between internal structure validity and cross-cultural fairness; however, some distinct differences exist as well.
Using CFA to confirm the factor structure of an established test with participants from a different culture is one way to investigate the cross-cultural fairness of scores. Suppose, for example, an investigator found acceptable internal structure validity evidence (see Table 1) for scores on an anxiety inventory that was normed in America with participants in Eastern Europe who identify with a collectivist cultural background. Such findings would suggest that the dimensionality of the anxiety inventory extends to the sample of Eastern European participants. However, internal structure validity testing alone might not be sufficient for testing the cross-cultural fairness of scores, as factor analysis does not test for content validity. In other words, although the CFA confirmed the dimensionality of an American model with a sample of Eastern European participants, the analysis did not take potential qualitative differences about the construct of measurement (anxiety severity) into account. It is possible (and perhaps likely) that the lived experience of anxiety differs between those living in two different cultures. Accordingly, a systems-level approach to test development and score validation can have utility for enhancing the cross-cultural fairness of scores (Swanepoel & Kruger, 2011).
A Systems-Level Approach to Test Development and Score Validation
Swanepoel and Kruger (2011) outlined a systemic approach to test development that involves circularity, which includes incorporating qualitative inquiry into the test development process, as qualitative inquiry has utility for uncovering the nuances of participants’ lived experiences that quantitative data fail to capture. For example, an exploratory-sequential mixed-methods design in which qualitative findings are used to guide the quantitative analyses is a particularly good fit with systemic approaches to test development and score validation. Referring to the example in the previous section, test developers might conduct qualitative interviews to develop a grounded theory of anxiety severity in the context of the collectivist culture. The grounded theory findings could then be used as the theoretical framework (see Kalkbrenner, 2021b) for a psychometric study aimed at testing the generalizability of the qualitative findings. Thus, in addition to evaluating the rigor of factor analytic results, professional counselors should also review the cultural context in which test items were developed before administering a test to clients.
Language adaptions of instrumentation are another relevant cross-cultural fairness consideration in counseling research and practice. Word-for-word translations alone are insufficient for capturing cross-cultural fairness of instrumentation, as culture extends beyond just language (Lenz et al., 2017; Swanepoel & Kruger, 2011). Pure word-for-word translations can also cause semantic errors. For example, feeling “fed up” might translate to feeling angry in one language and to feeling full after a meal in another language. Accordingly, professional counselors should ensure that a translated instrument was subjected to rigorous procedures for maintaining cross-cultural fairness. Reviewing such procedures is beyond the scope of this manuscript; however, Lenz et al. (2017) outlined a 6-step process for language translation and cross-cultural adaptation of instruments.
Conclusion
Gaining a deeper understanding of the major approaches to factor analysis for demonstrating internal structure validity in counseling research has potential to increase assessment literacy among professional counselors who work in a variety of specialty areas. It should be noted that the thresholds for interpreting the strength of internal structure validity coefficients that are provided throughout this manuscript should be used as tentative guidelines, not unconditional standards. Ultimately, internal structure validity is a function of test scores and the construct of measurement. The stakes or consequences of test results should be considered when making final decisions about the strength of validity coefficients. As professional counselors increase their familiarity with factor analysis, they will most likely become more cognizant of the strengths and limitations of counseling-related tests to determine their utility for use with clients. The practical overview of factor analysis presented in this manuscript can serve as a one-stop shop or resource that professional counselors can refer to as a reference for selecting tests with validated scores for use with clients, a primer for teaching courses, and a resource for conducting their own research.
Conflict of Interest and Funding Disclosure
The author reported no conflict of interest
or funding contributions for the development
of this manuscript.
References
Amarnani, R. (2009). Two theories, one theta: A gentle introduction to item response theory as an alternative to classical test theory. The International Journal of Educational and Psychological Assessment, 3, 104–109.
American Counseling Association. (2014). ACA code of ethics. https://www.counseling.org/resources/aca-code-of-ethics.pdf
American Educational Research Association, American Psychological Association, National Council on Measurement in Education. (2014). Standards for educational and psychological testing. https://www.apa.org/science/programs/testing/standards
American Psychiatric Association. (2013). Diagnostic and statistical manual of mental disorders (5th ed.).
https://doi.org/10.1176/appi.books.9780890425596
Bandalos, D. L., & Finney, S. J. (2019). Factor analysis: Exploratory and confirmatory. In G. R. Hancock, L. M. Stapleton, & R. O. Mueller (Eds.), The reviewer’s guide to quantitative methods in the social sciences (2nd ed., pp. 98–122). Routledge.
Beavers, A. S., Lounsbury, J. W., Richards, J. K., Huck, S. W., Skolits, G. J., & Esquivel, S. L. (2013). Practical considerations for using exploratory factor analysis in educational research. Practical Assessment, Research and Evaluation, 18(5/6), 1–13. https://doi.org/10.7275/qv2q-rk76
Byrne, B. M. (2016). Structural equation modeling with AMOS: Basic concepts, applications, and programming (3rd ed.). Routledge.
Castillo, J. H. (2020). Teaching counseling students the science of research. In M. O. Adekson (Ed.), Beginning your counseling career: Graduate preparation and beyond (pp. 122–130). Routledge.
Chen, C.-C., Lau, J. M., Richardson, G. B., & Dai, C.-L. (2020). Measurement invariance testing in counseling. Journal of Professional Counseling: Practice, Theory & Research, 47(2), 89–104.
https://doi.org/10.1080/15566382.2020.1795806
Chen, F. F. (2007). Sensitivity of goodness of fit indexes to lack of measurement invariance. Structural Equation Modeling, 14(3), 464–504. https://doi.org/10.1080/10705510701301834
Council for Accreditation of Counseling and Related Educational Programs. (2015). 2016 CACREP standards. http://www.cacrep.org/wp-content/uploads/2017/08/2016-Standards-with-citations.pdf
Credé, M., & Harms, P. D. (2015). 25 years of higher-order confirmatory factor analysis in the organizational sciences: A critical review and development of reporting recommendations. Journal of Organizational
Behavior, 36(6), 845–872. https://doi.org/10.1002/job.2008
Dimitrov, D. M. (2010). Testing for factorial invariance in the context of construct validation. Measurement and Evaluation in Counseling and Development, 43(2), 121–149. https://doi.org/10.1177/0748175610373459
Dimitrov, D. M. (2012). Statistical methods for validation of assessment scale data in counseling and related fields. American Counseling Association.
Fabrigar, L. R., Wegener, D. T., MacCallum, R. C., & Strahan, E. J. (1999). Evaluating the use of exploratory factor analysis in psychological research. Psychological Methods, 4(3), 272–299.
https://doi.org/10.1037/1082-989X.4.3.272
Field, A. (2018). Discovering statistics using IBM SPSS statistics (5th ed.). SAGE.
Hooper, D., Coughlan, J., & Mullen, M. R. (2008). Structural equation modelling: Guidelines for determining model fit. The Electronic Journal of Business Research Methods, 6(1), 53–60.
Hu, L., & Bentler, P. M. (1999). Cutoff criteria for fit indexes in covariance structure analysis: Conventional criteria versus new alternatives. Structural Equation Modeling: A Multidisciplinary Journal, 6(1), 1–55. https://doi.org/10.1080/10705519909540118
Kahn, J. H. (2006). Factor analysis in counseling psychology research, training, and practice: Principles, advances, and applications. The Counseling Psychologist, 34(5), 684–718. https://doi.org/10.1177/0011000006286347
Kaiser, H. F. (1974). An index of factorial simplicity. Psychometrika, 39(1), 31–36. https://doi.org/10.1007/BF02291575
Kalkbrenner, M. T. (2021a). Alpha, omega, and H internal consistency reliability estimates: Reviewing these options and when to use them. Counseling Outcome Research and Evaluation. Advance online publication. https://doi.org/10.1080/21501378.2021.1940118
Kalkbrenner, M. T. (2021b). A practical guide to instrument development and score validation in the social sciences: The MEASURE Approach. Practical Assessment, Research, and Evaluation, 26, Article 1. https://scholarworks.umass.edu/pare/vol26/iss1/1
Kalkbrenner, M. T., & Flinn, R. E. (2020). The Mental Distress Response Scale and promoting peer-to-peer mental health support: Implications for college counselors and student affairs officials. Journal of College Student Development, 61(2), 246–251. https://doi.org/10.1353/csd.2020.0021
Kane, M. (2010). Validity and fairness. Language Testing, 27(2), 177–182. https://doi.org/10.1177/0265532209349467
Kang, Y., McNeish, D. M., & Hancock, G. R. (2016). The role of measurement quality on practical guidelines for assessing measurement and structural invariance. Educational and Psychological Measurement, 76(4), 533–561. https://doi.org/10.1177/0013164415603764
Lenz, A. S., Gómez Soler, I., Dell’Aquilla, J., & Uribe, P. M. (2017). Translation and cross-cultural adaptation of assessments for use in counseling research. Measurement and Evaluation in Counseling and Development, 50(4), 224–231. https://doi.org/10.1080/07481756.2017.1320947
Lewis, T. F. (2017). Evidence regarding the internal structure: Confirmatory factor analysis. Measurement and Evaluation in Counseling and Development, 50(4), 239–247. https://doi.org/10.1080/07481756.2017.1336929
Mvududu, N. H., & Sink, C. A. (2013). Factor analysis in counseling research and practice. Counseling Outcome Research and Evaluation, 4(2), 75–98. https://doi.org/10.1177/2150137813494766
National Board for Certified Counselors. (2016). NBCC code of ethics. https://www.nbcc.org/Assets/Ethics/NBCCCodeofEthics.pdf
Neukrug, E. S., & Fawcett, R. C. (2015). Essentials of testing and assessment: A practical guide for counselors, social workers, and psychologists (3rd ed.). Cengage.
Putnick, D. L., & Bornstein, M. H. (2016). Measurement invariance conventions and reporting: The state of the art and future directions for psychological research. Developmental Review, 41, 71–90. https://doi.org/10.1016/j.dr.2016.06.004
Schreiber, J. B., Nora, A., Stage, F. K., Barlow, E. A., & King, J. (2006). Reporting structural equation modeling and confirmatory factor analysis results: A review. Journal of Educational Research, 99(6), 323–338.
https://doi:10.3200/JOER.99.6.323-338
Steele, J. M., & Rawls, G. J. (2015). Quantitative research attitudes and research training perceptions among master’s-level students. Counselor Education and Supervision, 54(2), 134–146. https://doi.org/10.1002/ceas.12010
Swanepoel, I., & Kruger, C. (2011). Revisiting validity in cross-cultural psychometric-test development: A systems-informed shift towards qualitative research designs. South African Journal of Psychiatry, 17(1), 10–15. https://doi.org/10.4102/sajpsychiatry.v17i1.250
Swank, J. M., & Mullen, P. R. (2017). Evaluating evidence for conceptually related constructs using bivariate correlations. Measurement and Evaluation in Counseling and Development, 50(4), 270–274.
https://doi.org/10.1080/07481756.2017.1339562
Tate, K. A., Bloom, M. L., Tassara, M. H., & Caperton, W. (2014). Counselor competence, performance assessment, and program evaluation: Using psychometric instruments. Measurement and Evaluation in Counseling and Development, 47(4), 291–306. https://doi.org/10.1177/0748175614538063
Watson, J. C. (2017). Establishing evidence for internal structure using exploratory factor analysis. Measurement and Evaluation in Counseling and Development, 50(4), 232–238. https://doi.org/10.1080/07481756.2017.1336931
Worthington, R. L., & Whittaker, T. A. (2006). Scale development research: A content analysis and recommendations for best practices. The Counseling Psychologist, 34(6), 806–838. https://doi.org/10.1177/0011000006288127
Michael T. Kalkbrenner, PhD, NCC, is an associate professor at New Mexico State University. Correspondence may be addressed to Michael T. Kalkbrenner, Department of Counseling and Educational Psychology, New Mexico State University, Las Cruces, NM 88003, mkalk001@nmsu.edu.