Jul 25, 2025 | Volume 15 - Issue 2
Michael T. Kalkbrenner, Shannon Esparza
Physicians in the United States are a client population facing increased risks for mental distress coupled with a reticence to seek professional counseling. Screening tools with valid scores have utility for helping counselors understand why prospective client populations who might benefit from counseling avoid seeking services. The Revised Fit, Stigma, and Value (RFSV) Scale is a screener for measuring barriers to counseling. The primary aims of the present study were to validate RFSV scores with physicians in the United States and to investigate demographic differences in physicians’ RFSV scores. Results revealed that the RFSV Scale and its dimensionality were estimated sufficiently with a national sample of physicians (N = 437). Physicians’ RFSV scores were a significant predictor (p = .002, Nagelkerke R2 = .05) of peer-to-peer referrals to counseling. We also found that male physicians and physicians with help-seeking histories were more sensitive to barriers to counseling than female physicians and physicians without help-seeking histories, respectively. Recommendations for how counselors can use the RFSV Scale when working with physician clients are provided.
Keywords: Revised Fit, Stigma, and Value Scale; counseling; barriers to counseling; help-seeking; physicians
Because of the particularly stressful nature of their work, coupled with the pressure in medical culture to not display psychological vulnerability (Linzer et al., 2016), physicians in the United States must be vigilant about their self-care. Physicians are responsible for treating over 300 million patients in the United States, which can lead to elevated psychological distress that may undermine the quality of patient services and physicians’ personal well-being (Walker & Pine, 2018). Attending personal counseling is associated with a number of personal and professional benefits for physicians (Melnyk et al., 2020). However, a stigma toward seeking counseling and other mental health support services exists in the U.S. medical culture (Dyrbye et al., 2015). Lobelo and de Quevedo (2016) found that physicians are attending counseling at lower rates since 2000, with approximately 40%–70% attending counseling before the year 2000 and only 12%–40% after 2000. One of the next steps in this line of research is gaining a better understanding of barriers to counseling, including reasons why physicians are reluctant to attend.
Screening tools with valid scores are one way to understand why individuals are reticent to attend counseling (Goldman et al., 2018). For example, the Revised Fit, Stigma, and Value (RFSV) Scale is a screening tool with rigorously validated scores for measuring barriers to counseling (Kalkbrenner et al., 2019). Scores on the RFSV Scale have been validated with seven different normative samples since 2018, including adults in the United States (Kalkbrenner & Neukrug, 2018), mental health counselors (Kalkbrenner et al. 2019), counselors-in-training (Kalkbrenner & Neukrug, 2019), college students attending a Hispanic Serving Institution (HSI; Kalkbrenner et al., 2022), and STEM students (Kalkbrenner & Miceli 2022).
At the time of this writing, RFSV scores have not been validated with a normative sample of physicians. Validity evidence of test scores can fluctuate between normative samples (American Educational Research Association [AERA] et al., 2014; Lenz et al., 2022). Accordingly, counseling practitioners, researchers, and students have a responsibility to validate scores with untested populations before using the test in clinical practice or research (Lenz et al., 2022). Validating RFSV scores with a national sample of U.S. physicians may provide professional counselors with a clinically appropriate screening tool for ascertaining what barriers contribute to physicians’ reluctance to attend counseling services. Identifying barriers to counseling within this population may also promote efforts to increase physicians’ support-seeking behaviors (Mortali & Moutier, 2018).
Barriers to Counseling
Counseling interventions provide physicians with protective factors such as promoting overall health and wellness (Major et al., 2021) and decreasing emotional exhaustion associated with burnout (Wiederhold et al., 2018). Despite these correlations, Kase et al. (2020) found that although 43% of a sample of U.S. pediatric physicians had access to professional counseling and support groups, only 17% utilized these services. Participants cited barriers to attending counseling, including inconvenience, time constraints, preference for handling mental health issues on their own, and perceiving mental health services as unhelpful.
A significant barrier contributing to U.S. physicians’ reticence to attend counseling is the influence of medical culture which reinforces physician self-neglect and pressure to maintain an image of invincibility (Shanafelt et al., 2019). This pressure can begin as early as medical school and may lead to a decreased likelihood of seeking counseling, as medical students who endorsed higher perceptions of public stigma within their workplace culture perceived counseling as less efficacious and considered depression a personal weakness (Wimsatt et al., 2015). An association of frailty with mental health diagnoses and treatment may be driven by incongruences in medical culture between espoused values and actual behaviors, such as teaching that self-care is important, yet practicing excessive hours, delaying in seeking preventive health care, and tolerating expectations of perfectionism (Shanafelt et al., 2019). Such hidden curricula may perpetuate the stigma of seeking mental health treatment, which is considered a primary driver of suicide in the health care workforce (American Hospital Association [AHA], 2022).
In addition to the barrier presented by medical culture, the stigmatization and negative impact on licensure of receiving a diagnosis also discourages physicians from seeking care (Mehta & Edwards, 2018). Almost 50% of a sample of female U.S. physicians believed that they met the criteria for a mental health diagnosis but had not sought treatment, citing reasons such as a belief that a diagnosis is embarrassing or shameful and fear of being reported to a medical licensing board (Gold et al., 2016). It is recommended best practice for state medical licensing boards to phrase initial and renewal licensure questions to only inquire about current mental health conditions, to ask only if the physician is impaired by these conditions, to allow for safe havens, and to use supportive language; yet in a review of all 50 states, the District of Columbia, and four U.S. territories, only three states’ or territories’ applications met all four conditions (Douglas et al., 2023). Thus, it is unsurprising that out of a sample of 5,829 U.S. physicians, nearly 40% indicated reluctance to seek formal care for a mental health condition because of licensure concerns (Dyrbye et al., 2017). The barriers of medical culture and its expectations, stigma, and diagnosis are consequential; further research is needed given the pressure physicians may experience to remain silent on these issues (Mehta & Edwards, 2018).
Demographic Differences
A number of demographic variables are related to differences in physicians’ mental health and their attitudes about seeking counseling (Creager et al., 2019; Duarte et al., 2020). For example, demographic differences such as gender and ethnoracial identity can add complexity to physicians’ risk of negative mental health outcomes (Duarte et al., 2020). Sudol et al. (2021) found that female physicians were at higher risk of depersonalization and emotional exhaustion than male physicians, while physicians from racial/ethnic minority backgrounds were more likely to report burnout than White physicians. Gender identity can also affect help-seeking behavior, as female physicians are more likely than male physicians to utilize social and emotional supports and less likely to prefer handling mental health symptoms alone (Kase et al., 2020). Work setting is another demographic variable that is associated with physicians’ mental health wellness, as Creager et al. (2019) identified lower burnout and stress rates among physicians working in private practice than those working in non–private practice settings.
Help-seeking history has become a more frequently examined variable in counseling research, often categorized into two groups: (a) individuals who have attended at least one session of personal counseling or (b) those who have never sought counseling (Cheng et al., 2018). This demographic variable is especially important when evaluating the psychometric properties of screening tools for physicians, who encounter numerous obstacles to accessing counseling services. Help-seeking history is related to more positive attitudes about seeking counseling, as Kevern et al. (2023) found that 80% of a sample of U.S. resident physicians who attended mental health counseling reported their sessions increased their willingness to attend counseling. These collective findings suggest demographic variables such as gender, ethnoracial identity, work setting, and help-seeking history may impact physicians’ mental health and their sensitivity to barriers to attending counseling and thus warrant further investigation.
The Revised Fit, Stigma, and Value Scale
Neukrug et al. (2017) developed and validated scores on the original 32-item Fit, Stigma, and Value (FSV) Scale with a sample of human service professionals in order to appraise barriers to attending personal counseling. The FSV subscales assess sensitivity to three potential barriers to counseling attendance, including fit, the extent to which a respondent trusts the counseling process; stigma, the feelings of shame or embarrassment associated with attending counseling; and value, the perceived benefit of being in counseling. Kalkbrenner et al. (2019) also developed and validated scores on a briefer 14-item version of the FSV Scale (the RFSV Scale), that contains the original three subscales. Additionally, Kalkbrenner and Neukrug (2019) identified a higher-order factor, the Global Barriers to Counseling Scale, which is the composite score of the RFSV’s Fit, Stigma, and Value single-order subscales.
Integrative Behavioral Health Care
Mental health challenges and attitudes toward seeking support are shaped by both individual (microsystemic) and broader societal (macrosystemic) factors, making it impossible for a single discipline to address these issues (Lenz & Lemberger-Truelove, 2023; Pester et al., 2023). As a result, the counseling profession is increasingly adopting interdisciplinary collaboration models, in which mental health professionals work together to deliver holistic care to clients or patients. Emerging research highlights interventions aimed at reducing barriers to accessing counseling services (e.g., Lannin et al., 2019). However, the complex interplay of ecological factors influencing mental health distress and service utilization makes evaluating these interventions challenging. Accordingly, counselors and other members of interdisciplinary teams need screening tools with valid scores to help determine the effectiveness of such interventions.
The primary aims of the present study were to validate RFSV scores with a national sample of physicians in the United States and to investigate demographic differences in physicians’ RFSV scores. The validity and meaning of latent traits (i.e., RFSV scores) can differ between different normative samples (AERA, 2014; Lenz et al., 2022). RFSV scores have not been normed with physicians. Accordingly, testing for factorial invariance of RFSV scores is a pivotal next step in this line of research. In other words, the internal structure validity of RFSV scores must be confirmed with physicians before the scale can be used to measure the intended construct. Although a number of different forms of validity evidence of scores exists, internal structure validity is a crucial consideration when testing the psychometric properties of an inventory with a new normative sample (AERA, 2014; Lenz et al., 2022). If RFSV scores are validated with a national sample of U.S. physicians, counselors can use the scale to better understand why physicians, as a population, are reticent to seek counseling.
Pending at least acceptable validity evidence, we sought to investigate the capacity of physicians’ RFSV scores for predicting referrals to counseling and to examine demographic differences in RFSV scores. Results have the potential to offer professional counselors a screening tool for understanding why physicians might be reticent to seek counseling. Findings also have the potential to reveal subgroups of physicians who might be especially unlikely to access counseling services. To these ends, the following research questions (RQs) were posed:
RQ1. What is the factorial invariance of scores on the RFSV Scale among a national sample of U.S. physicians?
RQ2. Are U.S. physicians’ RFSV scores statistically significant predictors of making at least one referral to counseling?
RQ3. Are there demographic differences to the RFSV barriers among U.S. physicians’ RFSV scores?
Method
Participants and Procedures
A quantitative cross-sectional psychometric research design was utilized to answer the research questions. The current study is part of a larger grant-funded project with an aim to promote health-based screening efforts and wellness among physicians. The aim of the previous study (Kalkbrenner et al., 2025) was to test the psychometric properties of three wellness-based screening tools with physicians. In the present study, we further analyzed the data in Kalkbrenner et al. (2025) to answer different research questions about a different scale (the RFSV Scale) on barriers to counseling. This data set was collected following approval from our IRB. Crowdsourcing is an increasingly common data collection strategy in counseling research with utility for accessing prospective participants on national and global levels (Mullen et al., 2021). Qualtrics Sample Services is a crowdsource solutions service with access to over 90 million prospective participants who voluntarily participate in survey research for monetary compensation. Grant funding was utilized to engage the services of a data collection agency to enlist a nationwide cohort of U.S. physicians. Qualtrics Sample Services was selected because they were the only crowdsource service we came across that could provide a sample of more than 400 licensed U.S. physicians. A sample greater than 400 was necessary for answering the first research question because 200 participants per group is the lower end of acceptable for multiple-group confirmatory factor analysis (MG-CFA; Meade & Kroustalis, 2006). Qualtrics Sample Services provided us with a program manager and a team of analysts who undertook a meticulous quality assessment of the data. This quality assessment involved filtering out respondents exhibiting excessive speed in responding, random response patterns, failed attention checks, and instances of implausible responses (e.g., individuals claiming to be 18 years old with an MD).
A total of N = 437 valid responses that met quality standards were obtained. An analysis of missing values indicated an absence of missing data. Examination of standardized z-scores and Mahalanobis (D) distances identified no univariate outliers (z > ± 3.29) and no multivariate outliers, respectively. Skewness and kurtosis values for physicians’ scores on the RFSV Scale were within the range indicative of a normal distribution of test scores (skewness < ± 2 and kurtosis < ± 7). Participants in the sample (N = 437) ranged in age from 25 to 85 (M = 47.80, SD = 11.74); see Table 1 for the demographic profile of the sample.
Table 1
Demographic Profile of the Sample (N = 437)
| Sample Characteristics |
n |
% |
| Gender |
|
|
| Male |
217 |
49.7 |
| Female |
215 |
49.2 |
| Transgender |
1 |
0.2 |
| Nonbinary |
1 |
0.2 |
| Preferred not to answer |
3 |
0.7 |
| Ethnoracial Identity |
|
|
| American Indian or Alaska Native |
1 |
0.2 |
| Asian or Asian American |
28 |
6.4 |
| Black or African American |
76 |
17.4 |
| Hispanic, Latinx, or Spanish origin |
97 |
22.2 |
| Middle Eastern or North African |
6 |
1.4 |
| Multiethnic |
6 |
1.4 |
| White or European American |
216 |
49.4 |
| Identified as another race, ethnicity, or origin |
1 |
0.2 |
| Preferred not to answer |
4 |
0.9 |
| Help-Seeking History |
|
|
| No help-seeking history |
228 |
52.2 |
| Help-seeking history |
208 |
47.6 |
| Work Setting |
|
|
| Private practice |
202 |
46.2 |
| Non–private practice |
233 |
53.3 |
| Did not report work setting |
2 |
0.5 |
Measures
Prospective participants voluntarily indicated their informed consent and confirmed that they met the eligibility criteria for participation, including being a physician licensed as an MD, treating patients in the United States, and being over 18 years old at the time of data collection. Participants then responded to a demographic questionnaire and completed the RFSV Scale.
The RFSV Scale
The RFSV Scale is a screening tool designed to measure respondents’ sensitivity to barriers to attending counseling (Kalkbrenner et al., 2019) and is comprised of three subscales. Participants respond to a stem (“I am less likely to attend counseling because . . . ”) on the following Likert scale: 1 = Strongly Disagree, 2 = Disagree, 3 = Neither Agree nor Disagree, 4 = Agree, or 5 = Strongly Agree. Higher scores indicate greater reluctance to seek counseling. The Fit subscale measures the degree to which a respondent believes that the counseling process is congruent with their personality, values, or beliefs (e.g. “I couldn’t find a counselor who would understand me”). The Stigma subscale measures one’s reluctance to attend counseling because of shame or embarrassment (e.g. “It would damage my reputation”). The Value subscale appraises the degree to which a respondent perceives the effort required to attend counseling as beneficial (e.g. “It is not an effective use of my time”).
Kalkbrenner et al. (2019) found moderate to strong reliability evidence of scores on the RFSV subscales (Fit α = .82, Stigma α = .91, Value α = .78) and support for the internal structure validity of the RFSV through factor analysis. Additionally, Kalkbrenner and Neukrug (2018) demonstrated evidence of internal structure validity of RFSV scores through confirmatory factor analysis (CFA). Moreover, Kalkbrenner et al. (2022) found internal structure validity and criterion validity evidence of RFSV scores. More specifically, Kalkbrenner et al. (2022) found internal structure validity evidence of RFSV scores via CFA with a normative sample of STEM students. In addition, Kalkbrenner et al. (2022) found that STEM students’ scores on the Value barrier were a statistically significant predictor of a non-test criterion (referrals to the counseling center), which supported criterion validity of RFSV scores.
Cronbach’s alpha (α) and McDonald’s omega (ω) were calculated to estimate the reliability of physicians’ scores on the RFSV Scale. Consistent with the Responsibilities of Users of Standardized Tests (RUST-4E) standards, we computed confidence intervals (CIs) for each point reliability estimate (Lenz et al., 2022). All CIs were estimated at the 95% level. The following interpretive guidelines for internal consistency reliability evidence of test scores were used: α > .70 (Tavakol & Dennick, 2011) and ω > .65 (Nájera Catalán, 2019). Among the sample of physicians in the present study, scores on the Fit subscale showed acceptable internal consistency reliability of scores (α = .819, 95% CI [.789, .846]; ω = .827, 95% CI [.799, .851]). Scores on the Stigma subscale displayed acceptable-to-strong internal consistency reliability evidence of scores (α = .896, 95% CI [.877, .912]; ω =. 902, 95% CI [.885, .918]). Physicians’ scores on the Value subscale displayed acceptable internal consistency reliability of scores (α = .817, 95% CI [.781, .848]; ω =.820, 95% CI [.783, .850]). Finally, we found strong internal consistency reliability estimates of scores on the Global Barriers scale (α = .902, 95% CI [.885, .915]; ω = .897, 95% CI [.887, .911]).
Data Analytic Plan
MG-CFA is an advanced psychometric analysis for determining the extent to which the meaning of latent constructs remain stable across subgroups of a sample (Dimitrov, 2012). MG-CFA is particularly sensitive to sample size (Meade & Kroustalis, 2006). A number of guidelines for MG-CFA sample size exist; however, at least 200 participants per each level of every invariance variable tends to be the minimum. To ensure that the present sample included 200+ participants in each group (see Table 2), the gender identity and ethnoracial identity variables were coded as female or male and White or non-White, respectively, for sample size considerations. This method of dummy coding highlights a frequent sample size–based challenge encountered in survey research, particularly in the context of assessing gender or ethnoracial identity (Ross et al., 2020). However, this coding method can be appropriate for survey research provided that the authors openly acknowledge the limitations inherent in such procedures, and that there is at least some degree of consistency between the dummy-coded groups and both the existing literature and the research questions (Ross et al., 2020). The coded groups are consistent with the literature and RQs, as findings in the extant literature (e.g., Duarte et al., 2022) demonstrated mental health care disparities between White and non-White and between male and female physicians. There are macro- and microlevel inequalities in the U.S. health care system between White and non-White populations (Matthew, 2015). Using the comparative method between participants with White and non-White ethnoracial identifies can have utility for highlighting the discrepancies in the U.S. health care system (Matthew, 2015; Ross et al., 2020). The limitations of this statistical aggregation procedure in terms of external validity will be articulated in the Discussion section.
Table 2
Multiple-Group Confirmatory Factor Analysis: RFSV Scale With U.S. Physicians
| Invariance Forms |
CFI |
∆CFI |
RMSEA |
∆RMSEA |
RMSEA CIs |
SRMR |
∆SRMR |
Model Comparison |
| Ethnoracial Identity: White (n = 216) vs. Non-White (n = 215) |
| Configural |
.934 |
|
.057 |
|
.049; .064 |
.070 |
|
|
| Metric |
.933 |
.001 |
.055 |
.002 |
.048; .063 |
.070 |
< .001 |
Configural |
| Scalar |
.928 |
.005 |
.055 |
< .001 |
.048; .062 |
.071 |
.001 |
Metric |
| Gender Identity: Female (n = 215) vs. Male (n = 217) |
|
| Configural |
.936 |
|
.056 |
|
.048; .063 |
.060 |
|
|
| Metric |
.935 |
.001 |
.055 |
.001 |
.047; .062 |
.066 |
.006 |
Configural |
| Scalar |
.921 |
.014 |
.057 |
.002 |
.051; .064 |
.067 |
.001 |
Metric |
| Help-Seeking History: Yes (n = 208) vs. No (n = 228) |
|
| Configural |
.921 |
|
.062 |
|
.055; .070 |
.080 |
|
|
| Metric |
.921 |
< .001 |
.061 |
.001 |
.053; .068 |
.080 |
< .001 |
Configural |
| Scalar |
.906 |
.015 |
.063 |
.001 |
.057; .070 |
.079 |
.001 |
Metric |
| Work Setting: Private Practice (n = 202) vs. Non-Private Practice (n = 233) |
|
| Configural |
.942 |
|
.053 |
|
.045; .061 |
.062 |
|
|
| Metric |
.937 |
.005 |
.054 |
.001 |
.046; .061 |
.075 |
.013 |
Configural |
| Scalar |
.936 |
.001 |
.052 |
.002 |
.044; .059 |
.075 |
< .001 |
Metric |
|
|
|
|
|
|
|
|
|
|
We computed an MG-CFA to test the factorial invariance of U.S. physicians’ RFSV scores (RQ1). All statistical analyses were computed in IBM SPSS AMOS version 29 with a maximum likelihood estimation method. The fit of the baseline configural models was compared to the following cutoff scores: root mean square error of approximation (RMSEA < .08 = acceptable fit and < .06 = strong fit), standardized root mean square residual (SRMR < .08 = acceptable fit and < .06 = strong fit), and the comparative fit index (CFI, .90 to .95 = acceptable fit and > .95 = strong fit (Dimitrov, 2012; Schreiber et al., 2006). Pending at least acceptable fit of the baseline models, we used the following guidelines for factorial invariance testing: < ∆ 0.010 in the CFI, < ∆ 0.015 in the RMSEA, and < ∆ 0.030 in the SRMR for metric invariance or < ∆ 0.015 in SRMR for scalar invariance (Chen, 2007; Cheung & Rensvold, 2002).
A binary logistic regression analysis was computed to investigate the predictive capacity of physicians’ RFSV scores (RQ2). The predictor variables included physicians’ interval level scores on the RFSV Scale. The criterion variable was whether or not physicians have made at least one referral to counseling (0 = no or 1 = yes). Interscale corrections between the RFSV scales ranged from r = .44 to r = .55, indicating that multicollinearity was not present in the data.
A 2 (gender) X 2 (ethnicity) X 2 (work setting) X 2 (help-seeking history) factorial multivariate analysis of variance (MANOVA) was computed to investigate differences in physicians’ RFSV scores (RQ3). The categorical level independent variables (IVs) included gender (female or male), ethnoracial identity (White or non-White), help-seeking history (yes or no), and work setting (private practice or non–private practice). The dependent variables (DVs) were physicians’ interval level scores on the RFSV Scale. Box’s M test demonstrated that the assumption of equity of covariance matrices was met, F = (90, 73455.60) = 86.28, p = .719.
Results
Factorial Invariance Testing
An MG-CFA was computed to answer the first research question regarding the factorial invariance of U.S. physicians’ scores on the RFSV Scale. First, the baseline configural models were investigated for fit. We then tested for invariance, as the baseline models showed acceptable fit based on the previously cited guidelines provided by Dimitrov (2012) and Schreiber et al. (2006), including gender identity (CFI = .936, RMSEA = .056, 90% CI [.048, .063], and SRMR = .060), ethnoracial identity (CFI = .934, RMSEA = .057, 90% CI [.049, .064], and SRMR = .070), help-seeking history (CFI = .921, RMSEA = .062, 90% CI [.055, .070], and SRMR = .080), and work setting (CFI = .942, RMSEA = .053, 90% CI [.045, .061], and SRMR = .062).
In terms of invariance, all of the fit indices (∆CFI, ∆RMSEA, and ∆SRMR) supported both metric and scalar invariance of scores for ethnoracial identity and work setting (see Table 2). For the gender identity and help-seeking history variables, the ∆RMSEA and ∆SRMR supported both metric and scalar invariance of scores. The ∆CFI supported metric but not scalar invariance of scores for the help-seeking history and gender identity variables. Demonstrating invariance can be deemed acceptable solely based on metric invariance (Dimitrov, 2010). This is particularly true when only a single fit index, such as the CFI, confirms metric invariance but not scalar invariance of scores.
Logistic Regression
A logistic regression analysis was computed to answer the second research question regarding the predictive capacity of physicians’ RFSV scores. The logistic regression model was statistically significant, X2 (3) = 15.36, p = .002, Nagelkerke R2 = .05. The odds ratios, Exp(B), demonstrated that an increase of one unit in physicians’ scores on the Stigma subscale (higher scores = higher barriers to counseling) was associated with a decrease in the odds of having made at least one referral to counseling by a factor of .711, Exp(B) 95% CI [.517, .947], p = .036. In addition, an increase of one unit in physicians’ scores on the Value subscale was associated with a decrease in the odds of having made at least one referral to counseling by a factor of .707, Exp(B) 95% CI [.508, .984], p = .040.
Factorial MANOVA
A 2 (gender) X 2 (ethnicity) X 2 (work setting) X 2 (help-seeking history) factorial MANOVA was computed to investigate differences in physicians’ RFSV scores (RQ3). A significant main effect emerged for gender on the combined DVs, F = (3, 409) = 6.50, p < .001, Λ = 0.95, n2p = .05. The statistically significant findings in the MANOVA were followed up with post-hoc discriminant analyses. The discriminant function significantly discriminated between groups, λ = 0.94, X2 = 25.07, df = 3, Canonical correlation = .29, p < .001. The correlations between the latent factors and discriminant functions showed that Fit (−1.17) loaded more strongly on the function than Stigma (0.68) and Value (0.62), suggesting that Fit contributed the most to group separation in gender identity. The mean discriminant score on the function for male physicians was 0.24 and the mean score for female physicians was −0.25 (higher scores = greater barriers to counseling).
A significant main effect emerged for help-seeking history on the combined DVs, F = (3, 409) = 4.57, p = .004, Λ = 0.95, n2p = .03. The post-hoc discriminant function significantly discriminated between groups, Wilks λ = 0.96, X2 = 19.61, df = 3, Canonical correlation = .21, p < .001. The correlations between the latent factors and discriminant functions showed that Value (1.03) loaded more strongly on the function than Stigma (0.28) and Fit (0.26), suggesting Value contributed the most to group separation in help-seeking history. The mean discriminant score on the function for physicians with a help-seeking history was −0.23 and the mean score was 0.21 for physicians without a help-seeking history.
Discussion
The aims of the present study were to: validate RFSV scores with a national sample of physicians in the United States, investigate the capacity of RFSV scores for predicting physician referrals to counseling, and investigate demographic differences in physicians’ RFSV scores. The findings will be discussed in accordance with the RQs. The model fit estimates for each of the baseline configural models were all in the acceptable range based on the recommendations of Dimitrov (2012) and Schreiber et al. (2006; see Table 2). The acceptable fit of the configural models supported that the RFSV Scale and its dimensionality were estimated adequately with a normative sample of physicians. RFSV scores have been normed with seven different normative samples since 2018, including adults in the United States (Kalkbrenner & Neukrug, 2018), mental health counselors (Kalkbrenner et al., 2019), counselors-in-training (Kalkbrenner & Neukrug, 2019), college students at an HSI (Kalkbrenner et al., 2022), and STEM students (Kalkbrenner & Miceli, 2022). The baseline CFA results in the present study extend the generalizability of RFSV scores to a normative sample of physicians in the United States. Because we found support for the baseline configural models, we proceeded to test for invariance of scores.
Invariance testing via MG-CFA takes internal structure validity testing to a higher level by revealing if the meaning of a latent trait stays consistent (i.e., invariant) between specific groups of a normative sample (Dimitrov, 2012). The results of factorial invariance testing were particularly strong and evidenced both metric and scalar invariance of RFSV scores for the ethnoracial identity and work setting variables. The ∆ in RMSEA and SRMR also supported both metric and scalar invariance for the help-seeking history and gender identity variables. The ∆ in CFI revealed metric, but not scalar invariance of scores for the help-seeking history and gender identity variables. Metric invariance alone can be sufficient for demonstrating invariance of scores across a latent trait (Dimitrov, 2010). This is particularly true when only a single fit index, such as the CFI, supports metric invariance but not scalar invariance of scores. In totality, the MG-CFA results supported invariance of physicians’ RFSV scores by ethnoracial identity, work setting, and, to a lesser but acceptable degree, help-seeking history and gender identity.
The MG-CFA results demonstrated that RFSV scores were valid among a national sample of U.S. physicians (RQ1). This finding adds rigor to the results of RQs 2 and 3 on predictive and demographic differences in physicians’ RFSV scores, as the scale was appropriately calibrated with a new normative sample. A test of the predictive capacity of RFSV scores revealed that physicians’ scores on the Stigma and Value subscales were statistically significant predictors of having made one or more referrals to counseling (RQ2). In other words, lower levels of stigma and higher attributions to the value of counseling were associated with higher odds of physicians making one or more referrals to counseling at a statistically significant level. This finding is consistent with Kalkbrenner and Miceli (2022), who found that scores on the Value subscale were predictors of referrals to counseling among STEM students. Similarly, Kalkbrenner et al. (2022) found that scores on the Value subscale predicted supportive responses to encountering a peer in mental distress among college students attending an HSI. Collectively, the findings of the present study are consistent with past investigators (e.g., Kalkbrenner et al., 2022) who found that more positive attitudes about counseling tend to predict increases in the odds of having made one or more peer referrals to counseling.
The final aim of the present study was to test for demographic differences in physicians’ sensitivity to the RFSV barriers (RQ3). We found statistically significant main effects for the gender identity and help-seeking history variables. Results revealed that male physicians were more sensitive to the Fit barrier than female physicians. This finding suggests that physicians who identify as male might be more skeptical about the counseling process in general and may doubt their chances of finding a counselor they feel comfortable with. This finding adds to the extant literature on physicians’ mental health and attitudes about seeking counseling. Past investigators (e.g., Sudol et al., 2021) documented female physicians’ increased risk for mental health stress when compared to male physicians. The findings of the present study showed that male physicians were more sensitive to the Fit barrier than female physicians. Accordingly, it is possible that female physicians are more likely to report symptoms of and seek support services for mental health issues than male physicians. This might be due, in part, to differences between male and female physicians’ beliefs about the fit of counseling. Future research is needed to test this possible explanation for this finding.
We found that physicians with a help-seeking history (i.e., attended one or more counseling sessions in the past) were less sensitive to the Value barrier when compared to physicians without a help-seeking history. Similarly, past investigators found associations between help-seeking history and more positive attitudes about the value and benefits of seeking counseling, including among STEM students (Kalkbrenner & Miceli 2022), college students at an HSI (Kalkbrenner et al., 2022), and adults living in the United States (Kalkbrenner & Neukrug, 2018). Collectively, the results of the present study are consistent with these existing findings, which suggest that physicians and members of other populations with help-seeking histories tend to attribute more value toward the anticipated benefits of counseling.
Limitations and Future Research
We recommend that readers consider the limitations of the present study before the implications for practice. Causal attributions cannot be drawn from a cross-sectional survey research design. Future researchers can build upon this line of research by testing the RFSV barriers using an experimental approach. Such research could involve administering the scale to physician clients before and after their counseling sessions. Such an approach might yield evidence on how counseling reduces sensitivity to certain barriers. However, it is important to note that pretest/posttest approaches can come with a number of limitations, including attrition, regression to the mean, history, and maturation.
Dummy coding the sociodemographic variables into broader categories to ensure adequate sample sizes for MG-CFA was a particularly challenging decision, especially for the ethnoracial identity variable. Although this statistical aggregation procedure can be useful for making broad and tentative generalizations about ethnicity and other variables (Ross et al., 2020), it limited our ability to explore potential differences in the meaning of the RFSV barriers among physicians with identities beyond White or non-White, and male or female. Future research with a more diverse sample by gender and ethnoracial identity is recommended.
Implications for Practice
The findings from this study provide robust psychometric evidence that supports the dimensionality of U.S. physicians’ scores on the RFSV Scale and carries important implications for counseling professionals. The National Board for Certified Counselors (NBCC; 2023) emphasizes the use of screening tools with valid scores as a means of improving clinical practice. Additionally, ethical guidelines for counselors stress the importance of ensuring that the screening tools that they utilize offer valid and reliable scores, derived from representative client samples, to uphold their effectiveness and proper application (AERA, 2014; Lenz et al., 2022; NBCC, 2023). Mental health issues and attitudes about utilizing mental health support services are influenced by microsystemic and macrosystemic factors (Lenz & Lemberger-Truelove, 2023; Pester et al., 2023). To this end, implications for practice will be discussed on both microsystemic and macrosystemic levels.
The practicality of the RFSV Scale adds to its utility, as it is free to use, simple to score, and typically takes between 5 and 8 minutes to complete. Identifying barriers or doubts that physician clients have about counseling during the intake process might help increase physician client retention. To these ends, counselors can include the RFSV Scale with intake paperwork for physician clients. Counselors can use the results as one way to gather information about doubts that their physician clients might have about attending counseling. Suppose, for example, that a physician client scores higher on the Fit subscale (higher scores = higher barriers to counseling) than the Stigma or Value subscales. It might be helpful for the counselor and client to discuss how they can make the counseling process a good fit (i.e., how and in what ways the counseling process can be congruent with their personality, values, or beliefs). Increasing physician clients’ buy-in regarding the counseling process may increase retention.
Counselors could also administer the RFSV Scale at the beginning, middle, and end of the counseling process when working with clients who are physicians or medical students. Results might reveal the utility of counseling for reducing barriers to counseling among clients who are physicians or medical students. Our results revealed that physicians with help-seeking histories perceived greater value about the benefits of counseling than physicians without help-seeking histories. Mental health support services provided by counselor education students can be a helpful resource for medical students and residents (Gerwe et al., 2017). Accordingly, there may be utility in counselor education programs collaborating with medical colleges and schools to address stigma around seeking counseling that can exist in the medical field. This broader perspective is consistent with the ecological systems direction that the counseling profession spearheaded (Lenz & Lemberger-Truelove, 2023; Pester et al., 2023) and could help address stigma toward seeking counseling before medical students become physicians. More specifically, directors and clinical coordinators of counseling programs can reach out to directors of medical schools to establish collaborative relationships in which counseling interns provide supervised counseling services to medical students and residents. This might have dual benefits because medical schools would be able to offer their students free mental health support services and counseling programs would provide additional internship sites for their students. Early intervention before students become physicians could reduce stigma toward counseling throughout their careers.
Time constraints can be a barrier to counseling among physicians, residents, and medical students (Gerwe et al., 2017; Kase et al., 2020). Accordingly, it could be beneficial for counseling students who are interested in working with medical students or residents to complete their internship placements in the same settings where medical students and residents work. In all likelihood, providing supervised group and individual counseling for medical students at their work sites would increase the accessibility of counseling.
The counseling profession is moving toward interdisciplinary collaboration models that involve teams of mental health professionals working together to provide comprehensive client/patient care (Lenz & Lemberger-Truelove, 2023; Pester et al., 2023). Interventions designed to reduce barriers to counseling are only beginning to appear in the extant literature (e.g., Lannin et al., 2019). The ecological systemic nature of mental health distress and influences on attitudes about accessing mental health support services makes evaluating the utility of reducing barriers to counseling interventions complex. To address this, counselors and interdisciplinary teams need screening tools with reliable and valid scores in order to effectively assess the impact of these interventions.
The results of CFA and MG-CFA in the present study confirmed that the RFSV Scale measured the intended construct of measurement with a national sample of U.S. physicians (RQ1). Thus, the RFSV Scale may have utility as a pretest/posttest for measuring the effectiveness of interventions geared toward reducing barriers to counseling. The extant literature on interventions for reducing barriers to counseling is in its infancy. Lannin et al. (2019) started to fill this gap in the knowledge base by conducting an intervention study with random assignment. Lannin et al. (2019) tested the extent to which contemplation about seeking counseling and self-affirmation were related to seeking mental health screening and general information about mental health support services. Results revealed that participants who used both self-affirming personal values and contemplation were significantly more likely to seek mental health screening and general information about mental health than participants in the contemplation-only group. In addition, participants in the contemplation about seeking counseling group only reported higher self-stigma. Findings indicated that interventions including both contemplation and self-affirmation of participants’ personal values were more likely to increase receptivity to outreach efforts.
Lannin et al. (2019) sampled undergraduate students attending a historically Black college/university. Lannin et al.’s (2019) intervention might have utility with physicians. However, to the best of our knowledge, the screening tools used by Lannin et al. have not been validated with U.S. physicians. Accordingly, professional counselors can use the RFSV Scale as one way to measure potential reductions in barriers to seeking counseling before and after participating in interventions geared toward promoting help-seeking among physicians. Fully developing an intervention that reduces barriers to counseling is beyond the scope of this study. Although future research is needed in this area, the results of this study confirmed that the RFSV Scale measured the intended construct of measurement with a national sample of U.S. physicians. Accordingly, professional counselors can use the RFSV Scale to better understand why prospective or current physician clients are reluctant to seek counseling. For example, professional counselors can work with medical supervisors and the directors of physician residency programs to administer the RFSV Scale at orientations for new physician employees and medical residents. The results could reveal specific barriers that are particularly salient in a given medical setting. Professional counselors can use the results to structure psychoeducation sessions about the utility of counseling for physicians. Suppose, for example, that physicians in a particular setting score higher on the Stigma subscale. A counselor can structure the content of the psychoeducation session on reducing stigma toward counseling. Specifically, the session could involve reframing seeking counseling in the context of the courage it takes for one to reach out to a counselor and the benefits associated with participating in counseling. These sessions may also help strengthen interpersonal bonds among physicians and begin to normalize mental health support within the medical community.
Consistent with the findings of Kalkbrenner and Miceli (2022), we found that lower scores on the Value subscale (lower scores = greater perceived benefits of counseling) was a statistically significant predictor of higher odds of participants having made one or more peer referrals to counseling. This finding, combined with the extant literature on physicians’ vulnerability to mental health distress and reticence to seek counseling (Lobelo & de Quevedo, 2016; Walker & Pine, 2018), suggested that peer-to-peer support may be a valuable resource for counselors who work in medical settings. In other words, we found that greater perceived value of the benefits of counseling was a statistically significant predictor of an increase in the odds of physicians recommending counseling to another physician. Accordingly, professional counselors who work in medical settings are encouraged to organize peer-to-peer support networks among physicians within their work setting. For example, professional counselors can work to promote physicians’ awareness of the value of attending professional counseling, particularly for reducing burnout, grieving the loss of a patient, coping with the demanding work life of physicians, and increasing general health (Major et al., 2021; Trivate et al., 2019; Wiederhold et al., 2018). Our results revealed that when compared to female physicians, male physicians scored higher on the Fit subscale (higher RFSV scores = poorer attitudes about counseling) and physicians with a help-seeking history scored higher on the Value subscale than those without help-seeking histories. To this end, there may be utility in focusing outreach sessions about the benefits of counseling to male physicians. For example, professional counselors could produce short videos, flyers, or other types of media on the benefits that attending counseling can have for physicians. These media sources can be shared with physicians. Such awareness advocacy about the benefits of counseling may result in an increase of peer-to-peer referrals to counseling among physicians.
Summary and Conclusion
Physicians in the United States face increased risks for mental distress and often hesitate to seek professional counseling (Lobelo & de Quevedo, 2016; Walker & Pine, 2018). Screening tools with validated scores are essential resources for helping professional counselors to understand why potential clients avoid seeking counseling services. The RFSV Scale measures barriers to counseling. This study aimed to validate RFSV scores among U.S. physicians and investigated demographic differences in their scores. Results indicated that the RFSV Scale and its dimensions were adequately estimated with a national sample of physicians in the United States. Physicians’ RFSV scores significantly predicted peer-to-peer counseling referrals. We identified demographic differences in sensitivity to barriers to counseling based on gender identity and help-seeking history. Physicians who self-identified as male and those without help-seeking histories were more sensitive to barriers to counseling than female physicians or physicians with help-seeking histories, respectively. At this phase of development, professional counselors can use the RFSV Scale as a tool for understanding barriers to seeking counseling among physicians.
Conflict of Interest and Funding Disclosure
The authors reported no conflict of interest
or funding contributions for the development
of this manuscript.
References
American Educational Research Association, American Psychological Association, National Council on Measurement in Education, & Joint Committee on Standards for Educational and Psychological Testing (U.S.). (2014). Standards for educational and psychological testing. https://www.apa.org/science/programs/testing/standards
American Hospital Association. (2022). Suicide prevention: Evidence-informed interventions for the health care workforce. https://www.aha.org/system/files/media/file/2022/09/suicide-prevention_evidence-informed-interventions-for-the-health-care-workforce.pdf
Chen, F. F. (2007). Sensitivity of goodness of fit indexes to lack of measurement invariance. Structural Equation Modeling, 14(3), 464–504. https://doi.org/10.1080/10705510701301834
Cheng, H.-L., Wang, C., McDermott, R. C., Kridel, M., & Rislin, J. L. (2018). Self-stigma, mental health literacy, and attitudes toward seeking psychological help. Journal of Counseling & Development, 96(1), 64–74. https://doi.org/10.1002/jcad.12178
Cheung, G. W., & Rensvold, R. B. (2002). Evaluating goodness-of-fit indexes for testing measurement invariance. Structural Equation Modeling, 9(2), 233–255. https://doi.org/10.1207/S15328007SEM0902_5
Creager, J., Coutinho, A. J., & Peterson, L. E. (2019). Associations between burnout and practice organization in family physicians. Annals of Family Medicine, 17(6), 502–509. https://doi.org/10.1370/afm.2448
Dimitrov, D. M. (2010). Testing for factorial invariance in the context of construct validation. Measurement and Evaluation in Counseling and Development, 43(2), 121–149. https://doi.org/10.1177/0748175610373459
Dimitrov, D. M. (2012). Statistical methods for validation of assessment scale data in counseling and related fields. American Counseling Association.
Douglas, R. N., Sharpe, E. E., Kraus, M., Saddawi-Konefka, D., Hanson, A. C., & Pulos, B. (2023). Mental health questions on state medical license applications and evaluation of updates. JAMA Network Open, 6(9), 1–5. https://doi.org/10.1001/jamanetworkopen.2023.33360
Duarte, D., El-Hagrassy, M. M., Castro e Couto, T., Gurgel, W., Fregni, F., & Correa, H. (2020). Male and female physician suicidality: A systematic review and meta-analysis. JAMA Psychiatry, 77(6), 587–597. https://doi.org/10.1001/jamapsychiatry.2020.0011
Duarte, D., El-Hagrassy, M. M., Couto, T., Gurgel, W., Frey, B. N., Kapczinski, F., & Correa, H. (2022). Physician suicide demographics and the COVID-19 pandemic. Brazilian Journal of Psychiatry, 44(2). https://doi.org/10.1590/1516-4446-2021-1865
Dyrbye, L. N., Eacker, A., Durning, S. J., Brazeau, C., Moutier, C., Massie, F. S., Satele, D., Sloan, J. A., & Shanafelt, T. D. (2015). The impact of stigma and personal experiences on the help-seeking behaviors of medical students with burnout. Academic Medicine, 90(7), 961–969. https://doi.org/10.1097/ACM.0000000000000655
Dyrbye, L. N., West, C. P., Sinsky, C. A., Goeders, L. E., Satele, D. V., & Shanafelt, T. D. (2017). Medical licensure questions and physician reluctance to seek care for mental health conditions. Mayo Clinic Proceedings, 92(10), 1486–1493. https://doi.org/10.1016/j.mayocp.2017.06.020
Gerwe, C., Parks-Savage, A. C., Bertolet, C. L., Kalkbrenner, M. T., & Archer, L. (2017). Promoting the wellness of physician-residents: Counselor-delivered coaching. Counseling & Wellness: A Professional Counseling Journal, 6(1), 1–19.
Gold, K. J., Andrew, L. B., Goldman, E. B., & Schwenk, T. L. (2016). “I would never want to have a mental health diagnosis on my record”: A survey of female physicians on mental health diagnosis, treatment, and reporting. General Hospital Psychiatry, 43(1), 51–57. https://doi.org/10.1016/j.genhosppsych.2016.09.004
Goldman, M. L., Bernstein, C. A., & Summers, R. F. (2018). Potential risks and benefits of mental health screenings of physicians. JAMA, 320(24), 2527–2528. https://doi.org/10.1001/jama.2018.18403
Kalkbrenner, M. T., & Miceli, G. (2022). Barriers to seeking counseling among STEM students: The Revised Fit, Stigma, and Value Scale. The Professional Counselor, 12(3), 249–261. https://doi.org/10.15241/mtk.12.3.249
Kalkbrenner, M. T., & Neukrug, E. S. (2018). Identifying barriers to attendance in counseling among adults in the United States: Confirming the factor structure of the Revised Fit, Stigma, & Value Scale. The Professional Counselor, 8(4), 299–313. https://doi.org/10.15241/mtk.8.4.299
Kalkbrenner, M. T., & Neukrug, E. S. (2019). The utility of the Revised Fit, Stigma, and Value Scale with counselor trainees: Implications for enhancing clinical supervision. The Clinical Supervisor, 38(2), 262–280.
https://doi.org/10.1080/07325223.2019.1634665
Kalkbrenner, M. T., Neukrug, E. S., & Esquivel, L. E. (2022). Mental health literacy screening of students in Hispanic Serving Institutions. Journal of Counseling & Development, 100(3), 319–329. https://doi.org/10.1002/jcad.12428
Kalkbrenner, M. T., Neukrug, E. S., & Griffith, S.-A. M. (2019). Appraising counselors’ attendance in counseling: The validation and application of the Revised Fit, Stigma, and Value Scale. Journal of Mental Health Counseling, 41(1), 21–35. https://doi.org/10.17744/mehc.41.1.03
Kalkbrenner, M. T., Sun, H., & Peterson, S. (2025). Psychometric evaluation of wellness-based screeners: National sample of U.S. physicians. Journal of Mental Health Counseling, 47(1), 74–94. https://doi.org/10.1080/07481756.2024.2441135
Kase, S. M., Gribben, J. L., Waldman, E. D., & Weintraub, A. S. (2020). A pilot study exploring interventions for physician distress in pediatric subspecialists. Pediatric Research, 88(1), 398–403. https://doi.org./10.1038/s41390-020-0805-x
Kevern, T., Davies, D. R., Stiel, K., & Raaum, S. (2023). Impact of opt-out therapy appointments on resident physicians’ mental health, well-being, stigma, and willingness to engage. Journal of Graduate Medical Education, 15(6), 734–737. https://doi.org/10.4300/JGME-D-22-00898.1
Lannin, D. G., Ludwikowski, W. M. A., Vogel, D. L., Seidman, A. J., & Anello, K. (2019). Reducing psychological barriers to therapy via contemplation and self-affirmation. Stigma and Health, 4(3), 247–255. https://doi.org/10.1037/sah0000139
Lenz, A. S., Ault, H., Balkin, R. S., Barrio Minton, C., Erford, B. T., Hays, D. G., Kim, B. S. K., & Li, C. (2022). Responsibilities of users of standardized tests (RUST-4E): Prepared for the Association for Assessment and Research in Counseling. Measurement and Evaluation in Counseling and Development, 55(4), 227–235. https://doi.org/10.1080/07481756.2022.2052321
Lenz, A. S., & Lemberger-Truelove, M. E. (2023). The social determinants of mental health and professional counseling: A call to action. Journal of Counseling & Development, 101(4), 375–380. https://doi.org/10.1002/jcad.12489
Linzer, M., Poplau, S., Babbott, S., Collins, T., Guzman-Corrales, L., Menk, J., Murphy, M. L., & Ovington, K. (2016). Worklife and wellness in academic general internal medicine: Results from a national survey. Journal of General Internal Medicine, 31(9), 1004–1010. https://doi.org/10.1007/s11606-016-3720-4
Lobelo, F., & de Quevedo, I. G. (2016). The evidence in support of physicians and health care providers as physical activity role models. American Journal of Lifestyle Medicine, 10(1), 36–52. https://doi.org/10.1177/1559827613520120
Major, A., Williams, J. G., McGuire, W. C., Floyd, E., & Chacko, K. (2021). Removing barriers: A confidential opt-out mental health pilot program for internal medicine interns. Academic Medicine, 96(5), 686–689. https://doi.org/10.1097/ACM.0000000000003965
Matthew, D. B. (2015). Just medicine: A cure for racial inequality in American health care. New York University Press.
Meade, A. W., & Kroustalis, C. M. (2006). Problems with item parceling for confirmatory factor analytic tests of measurement invariance. Organizational Research Methods, 9(3), 369–403. https://doi.org/10.1177/1094428105283384
Mehta, S. S., & Edwards, M. L. (2018). Suffering in silence: Mental health stigma and physicians’ licensing fears. The American Journal of Psychiatry Residents’ Journal, 13(11), 2–4. https://doi.org/10.1176/appi.ajp-rj.2018.131101
Melnyk, B. M., Kelly, S. A., Stephens, J., Dhakal, K., McGovern, C., Tucker, S., Hoying, J., McRae, K., Ault, S., Spurlock, E., & Bird, S. B. (2020). Interventions to improve mental health, well-being, physical health, and lifestyle behaviors in physicians and nurses: A systematic review. American Journal of Health Promotion, 34(8), 929–941. https://doi.org/10.1177/0890117120920451
Mortali, M., & Moutier, C. (2018). Facilitating help-seeking behavior among medical trainees and physicians using the Interactive Screening Program. Journal of Medical Regulation, 104(2), 27–36. https://doi.org/10.30770/2572-1852-104.2.27
Mullen, P. R., Fox, J., Goshorn, J. R., & Warraich, L. K. (2021). Crowdsourcing for online samples in counseling research. Journal of Counseling & Development, 99(2), 221–226. https://doi.org/10.1002/jcad.12369
Nájera Catalán, H. E. (2019). Reliability, population classification and weighting in multidimensional poverty measurement: A Monte Carlo study. Social Indicators Research, 142(3), 887–910. https://doi.org/10.1007/s11205-018-1950-z
National Board for Certified Counselors. (2023). NBCC code of ethics. https://bit.ly/NBCCCodeofEthics
Pester, D. A., Jones, L. K., & Talib, Z. (2023). Social determinants of mental health: Informing counseling practice and professional identity. Journal of Counseling & Development, 101(4), 392–401. https://doi.org/10.1002/jcad.12473
Ross, P. T., Hart-Johnson, T., Santen, S. A., & Zaidi, N. L. B. (2020). Considerations for using race and ethnicity as quantitative variables in medical education research. Perspectives on Medical Education, 9(5), 318–323. https://doi.org/10.1007/s40037-020-00602-3
Schreiber, J. B., Nora, A., Stage, F. K., Barlow, E. A., & King, J. (2006). Reporting structural equation modeling and confirmatory factor analysis results: A review. The Journal of Educational Research, 99(6), 323–338.
https://doi.org/10.3200/JOER.99.6.323-338
Shanafelt, T. D., Schein, E., Minor, L. B., Trockel, M., Schein, P., & Kirch, D. (2019). Healing the professional culture of medicine. Mayo Clinic Proceedings, 94(8), 1556–1566. https://doi.org/10.1016/j.mayocp.2019.03.026
Sudol, N. T., Guaderrama, N. M., Honsberger, P., Weiss, J., Li, Q., & Whitcomb, E. L. (2021). Prevalence and nature of sexist and racial/ethnic microaggressions against surgeons and anesthesiologists. JAMA Surgery, 156(5), 1–10. https://doi.org/10.1001/jamasurg.2021.0265
Tavakol, M., & Dennick, R. (2011). Making sense of Cronbach’s alpha. International Journal of Medical Education, 2(1), 53–55. https://doi.org/10.5116/ijme.4dfb.8dfd
Trivate, T., Dennis, A. A., Sholl, S., & Wilkinson, T. (2019). Learning and coping through reflection: Exploring patient death experiences of medical students. BMC Medical Education, 19(1), 451. https://doi.org/10.1186/s12909-019-1871-9
Walker, R., & Pine, H. (2018). Physician wellness is an ethical and public health issue. Otolaryngology–Head and Neck Surgery, 158(6), 970–971. https://doi.org/10.1177/0194599818773296
Wiederhold, B. K., Cipresso, P., Pizzioli, D., Wiederhold, M., & Riva, G. (2018). Intervention for physician burnout: A systematic review. Open Medicine, 13(1), 253–263. https://doi.org/10.1515/med-2018-0039
Wimsatt, L. A., Schwenk, T. L., & Sen, A. (2015). Predictors of depression stigma in medical students: Potential targets for prevention and education. American Journal of Preventive Medicine, 49(5), 703–714.
https://doi.org/10.1016/j.amepre.2015.03.021
Michael T. Kalkbrenner, PhD, NCC, is a full professor at New Mexico State University. Shannon Esparza, BA, is a graduate student at New Mexico State University. Correspondence may be addressed to Michael T. Kalkbrenner, Department of Counseling and Educational Psychology, New Mexico State University, Las Cruces, NM 88003, mkalk001@nmsu.edu.
Nov 9, 2022 | Volume 12 - Issue 3
Michael T. Kalkbrenner, Gabriella Miceli
Meeting the mental health needs of students enrolled in science, technology, engineering, and mathematics (STEM) majors is particularly challenging for professional counselors who work in college settings, as STEM students are a subgroup of college students that face unique risks for developing mental health issues. The scarcity of literature on STEM student mental health coupled with their reticence to seek counseling is concerning. An important next step in this line of research is understanding why STEM students are reticent to seek counseling. Accordingly, the present investigators validated STEM students’ scores on the Revised Fit, Stigma, and Value (RFSV) Scale, a screening tool for measuring barriers to seeking counseling. Results also established the capacity of STEM students’ RFSV scores to predict peer-to-peer referrals to the counseling center and revealed demographic differences in barriers to counseling. Findings have implications for enhancing professional counselors’ efforts to support STEM students’ mental health.
Keywords: Revised Fit, Stigma, and Value Scale; STEM; student mental health; barriers to counseling; peer-to-peer referrals
The frequency and complexity of college students presenting with mental health issues is a notable concern for professional counselors who work in university settings (Al-Maraira & Shennaq, 2021; Hong et al., 2022). Students enrolled in science, technology, engineering, and mathematics (STEM) majors are a distinctive group of college students who face unique risks for developing mental health issues (Daker et al., 2021; Kalkbrenner, James, & Pérez-Rojas, 2022; Lipson et al., 2016; Shapiro & Sax, 2011). When compared to their non-STEM counterparts, STEM students are less likely to recognize warning signs of mental distress, and they access mental health support services at lower rates than their peers. In addition, the harsh and competitive academic environment in STEM majors can exacerbate students’ risk for mental health distress (Lipson et al., 2016; Shapiro & Sax, 2011). Moreover, Rice et al. (2015) demonstrated that STEM students exhibit higher levels of maladaptive perfectionism, which is associated with higher levels of mental distress.
Whereas substantial academic and financial resources exist to support STEM students (U.S. Department of Education, 2020), there is a dearth of literature on supporting STEM students’ mental health, which is essential for retaining students and ensuring their success both in and out of the classroom (Kivlighan et al., 2021; Schwitzer et al., 2018). This gap in the literature is concerning, as STEM students are at risk for mental health issues, which can lead to attrition, isolation, and suicide (Daker et al., 2021; Kalkbrenner, James, & Pérez-Rojas, 2022; Lipson et al., 2016). As just one example, academic mental health distress is a significant predictor of lower enrollment and completion rates in STEM fields (Daker et al., 2021). Moreover, Muenks et al. (2020) found that higher levels of psychological vulnerability among STEM students was a significant predictor of lower class attendance, higher dropout intentions, and less class engagement.
The literature is lacking research on why STEM students tend to seek counseling at lower rates than non-STEM students. One of the first steps in supporting STEM students’ mental health is validating scores on a screening tool for identifying barriers to accessing mental health support services among STEM students. Although screening tools that appraise barriers to counseling exist, none of them have been validated with STEM students. The Revised Fit, Stigma, and Value (RFSV) Scale is a screening tool for appraising barriers to counseling that has been normed with non–college-based populations (e.g., adults in the United States; Kalkbrenner & Neukrug, 2018) and college students with mental health backgrounds (e.g., graduate counseling students; Kalkbrenner & Neukrug, 2019), as just a few examples. When compared to the existing normative RFSV Scale samples, STEM students are a distinct college student population who utilize counseling services at lower rates than students in mental health majors (e.g., psychology; Kalkbrenner, James, & Pérez-Rojas, 2022). The psychometric properties of instrumentation can fluctuate significantly between different populations, and researchers and practitioners have an ethical obligation to validate scores on instruments before interpreting the results with untested populations (Mvududu & Sink, 2013). Accordingly, the primary aims of the present study were to validate STEM students’ scores on the RFSV Scale (Kalkbrenner & Neukrug, 2019), test the capacity of RFSV scores for predicting referrals to the counseling center, and investigate demographic differences in STEM students’ RFSV scores.
The Revised Fit, Stigma, and Value (RFSV) Scale
Neukrug et al. (2017) developed and validated scores on the original version of the Fit, Stigma, and Value (FSV) Scale for appraising barriers to counseling among a large sample of human services professionals. The FSV Scale contains the three following subscales or latent traits behind why one would be reluctant to seek personal counseling: Fit, Stigma, and Value. Kalkbrenner et al. (2019) validated scores on a more concise version of the FSV Scale, which became known as the RFSV Scale, which includes the same three subscales as the original version. Building on this line of research, Kalkbrenner and Neukrug (2019) found a higher-order factor, the Global Barriers to Counseling scale. The Global Barriers to Counseling scale is composed of a total composite score across the three single-order subscales (Fit, Stigma, and Value). Accordingly, the Fit, Stigma, and Value subscales can be scored separately and/or users can compute a total score for the higher-order Global Barriers to Counseling scale.
Scores on the RFSV Scale have been validated with a number of non-college populations, including adults in the United States (Kalkbrenner & Neukrug, 2018), professional counselors (Kalkbrenner et al., 2019), counselors-in-training (Kalkbrenner & Neukrug, 2019), and high school students (Kalkbrenner, Goodman-Scott, & Neukrug, 2020). If scores are validated with STEM students, the RFSV Scale could be used to enhance professional counselors’ mental health screening efforts to understand and promote STEM student mental health. Specifically, campus-wide mental health screening has implications for promoting peer-to-peer mental health support. For example, college counselors are implementing peer-to-peer mental health support initiatives by training students to recognize warning signs of mental distress in their peers and, in some instances, refer them to college counseling services (Kalkbrenner, Sink, & Smith, 2020).
Peer-to-Peer Mental Health Support
College students tend to discuss mental health concerns with their peers more often than with a faculty member or student affairs professional (Wawrzynski et al., 2011; Woodhead et al., 2021). To this end, the popularity and utility of peer-to-peer mental health support initiatives has grown in recent years (Kalkbrenner, Lopez, & Gibbs, 2020; Olson et al., 2016). The effectiveness of these peer-to-peer support initiatives can be evaluated by test scores (e.g., scores on mental distress and well-being inventories) as well as non-test criteria (e.g., increases in the frequency of peer-to-peer mental health referrals). For example, Olson et al. (2016) found that college students who attended a Recognize & Refer workshop were significantly more likely to refer a peer to counseling when compared to students who did not attend the workshop. Similarly, Kalkbrenner, Lopez, and Gibbs (2020) found that increases in college students’ awareness of warning signs for mental distress were predictive of substantial increases in the odds of making peer-to-peer referrals to the counseling center.
Peer-to-peer mental health support also has implications for improving college student mental health (Bryan & Arkowitz, 2015; Byrom, 2018; Caporale-Berkowitz, 2022). For example, Bryan and Arkowitz (2015) found that peer-run support programs for depression were associated with significant reductions in depressive symptoms. In addition, Byrom (2018) demonstrated that peer support interventions were associated with increases in college students’ well-being. The synthesized results of the studies cited in this section suggest that peer-to-peer mental health support has utility for promoting mental health among general samples of undergraduate college students. However, to the best of our knowledge, the literature is lacking research on peer-to-peer mental health support with STEM majors, a subgroup of college students with unique mental health needs (Daker et al., 2021; Lipson et al., 2016; Shapiro & Sax, 2011).
The Present Study
College counseling services are a valuable resource for students, as attendance in counseling is associated with increases in GPA and retention rates (Kivlighan et al., 2021; Lockard et al., 2019; Schwitzer et al., 2018). Considering STEM students’ unique vulnerability to mental health distress (Daker et al., 2021; Lipson et al., 2016; Shapiro & Sax, 2011) and their reticence to seek counseling (Kalkbrenner, James, & Pérez-Rojas, 2022), professional counselors who work in university settings need screening tools with validated scores for identifying why STEM students might avoid accessing counseling services. The RFSV Scale has potential to fill this gap in the measurement literature, as a number of recent psychometric studies (e.g., Kalkbrenner, Goodman-Scott, & Neukrug, 2020; Kalkbrenner & Neukrug, 2018) demonstrated support for the psychometric properties of scores on the RFSV Scale with non-college populations. However, the literature is lacking a screening tool for appraising barriers to counseling with validated scores among STEM students. Accordingly, a score validation study with STEM students is an important next step in this line of research, as the internal structure of instrumentation can vary notably between different samples (Mvududu & Sink, 2013). The literature is also lacking research on the potential of peer-to-peer mental support (e.g., students recognizing and referring a peer to counseling) among STEM students. This is another notable gap in the literature, as college students are more likely to discuss mental health concerns with a peer than with faculty or other university personnel (Wawrzynski et al., 2011; Woodhead et al., 2021). If STEM students’ scores on the RFSV Scale are validated, we will proceed to test the capacity of scores for predicting peer-to-peer referrals to the counseling center as well as examine demographic differences in STEM students’ RFSV scores.
The findings of the present investigation have implications for campus-wide mental health screening, increasing peer-to-peer mental health support, and identifying subgroups of STEM students that might be particularly reticent to seek counseling. To this end, the following research questions (RQs) and hypotheses (Ha) guided the present investigation: RQ1: Is the internal structure of scores on the RFSV Scale confirmed with STEM students? Ha1: The dimensionality of the RFSV Scale will be confirmed with STEM students. RQ2: Are STEM students’ RFSV scores significant predictors of making at least one referral to the counseling center? Ha2: Higher RFSV scores will emerge as a statistically significant positive predictor of STEM students making one or more peer referrals to the counseling center. RQ3: Are there significant demographic differences in FSV barriers to counseling among STEM students? Ha3: Statistically significant demographic differences in STEM students’ RFSV scores will emerge.
Methods
Participants and Procedures
Following IRB approval, first author Michael T. Kalkbrenner obtained an email list from the Office of University Student Records of all students who were enrolled in a STEM major at a research-intensive university with four campus locations in three cities located in the Southwestern United States. A recruitment message was sent out to the email list via Qualtrics Secure Online Survey Platform. A total of 407 prospective participants clicked on the survey link. A response rate could not be calculated, as Qualtrics does not track inaccurate or inactive email addresses. A review of the raw data revealed 41 cases with 100% missing data. Likely, these 41 prospective participants clicked on the link to the survey and decided not to participate. Following the removal of those 41 cases, less than 20% of data were missing for the remaining 366 cases. Little’s Missing Completely at Random test indicated that the data could be treated as missing completely at random (p = .118) and expectation maximization was used to impute missing values. An investigation of standardized z-scores revealed six univariate outliers (z > ± 3.29) and Mahalanobis distances displayed eight multivariate outliers, which were removed from the data set, yielding a robust sample of N = 352.
Participants ranged in age from 18 to 63 (M = 24.29; SD = 8.59). The demographic profile for gender identity consisted of 65.1% (n = 229) female, 30.4% (n = 107) male, 2.0% (n = 7) non-binary, 1.1% (n = 4) transgender, 0.6% (n = 2) an identity not listed (“please specify”), and 0.9% (n = 3) prefer not to answer. The ethnoracial demographic profile consisted of 2.6% (n = 9) Native Indian or Alaska Native; 3.1% (n = 11) Asian or Asian American; 2.0% (n = 7) Black or African American; 48.3% (n = 170) Hispanic, Latinx, or Spanish origin; 2.0% (n = 7) Middle Eastern or North African; 3.4% (n = 12) Multiethnic; 36.6% (n = 129) White or European American; 1.1% (n = 4) Another race, ethnicity, or origin (“please specify”); and 0.9% (n = 3) preferred not to answer. The present sample was composed of notably more diverse groups of STEM students when compared to national estimates of STEM students (National Center for Educational Statistics [NCES], 2020). The NCES’s estimates revealed fewer women (33.0%, n = 263,034) and Latinx (12.3%, n = 94,927) STEM students as well as fewer White students (49.8%, n = 385,132). But the NCES’s national estimates included larger proportions of Black (7.2%, n = 55,642) and Asian (11.0%, n = 85,135) STEM students when compared to the present sample.
Instrumentation
Participants completed a demographic questionnaire by indicating their informed consent, then confirming they met the following inclusion criteria for participation: (a) 18 years or older, (b) enrolled in at least one undergraduate STEM course, and (c) currently a STEM major. The demographic questionnaire concluded with questions about respondents’ age, gender identity, ethnoracial identity, help-seeking history, and if they had referred one or more peers to the counseling center.
The Revised FSV Scale
The RFSV Scale is a screening tool that was designed to measure barriers to seeking counseling (Kalkbrenner, Neukrug, & Griffith, 2019). Participants respond to a prompt (“I am less likely to attend counseling because . . . ”) for 14 declarative statements on the following Likert scale: 1 = Strongly Disagree, 2 = Disagree, 3 = Neither Agree nor Disagree, 4 = Agree, or 5 = Strongly Agree. The RFSV Scale is composed of three subscales or latent traits behind one’s reticence to seek counseling, including Fit, Stigma, and Value. Scores on the Fit subscale can range from 5 to 25, with higher scores indicating more restraint from seeking counseling because one believes the process of counseling is not suitable with their personal worldview (e.g., “I couldn’t find a counselor who would understand me”). Scores on the Stigma subscale also range from 5 to 25, and higher scores denote a greater hesitation to seek counseling due to feelings of embarrassment or shame (e.g., “It would damage my reputation”). Scores on the Value subscale range from 4 to 20, with higher scores indicating a greater disinclination to seek counseling because they believe the effort required would not be worth the potential benefits (e.g., “Counseling is unnecessary because my problems will resolve naturally”).
The Global Barriers to Counseling scale is composed of test takers’ average composite score across the three Fit, Stigma, and Value subscales and produces an overall estimation of a test taker’s sensitivity to barriers toward seeking counseling. Scores on the Global Barriers to Counseling scale range from 13 to 65, with higher scores indicating a greater reticence to seek counseling. The collective findings of past investigators demonstrated evidence for the internal structure validity (confirmatory factor analysis) and internal consistency reliability (α = .70 to α = .91) of scores on the RFSV Scale with a number of non-college populations (Kalkbrenner, Goodman-Scott, & Neukrug, 2020; Kalkbrenner & Neukrug, 2018, 2019; Kalkbrenner et al., 2019).
Data Analysis
A confirmatory factor analysis (CFA) based on structural equation modeling was computed in IBM SPSS AMOS version 26 to answer the first RQ about the dimensionality of STEM students’ RFSV scores. We used the joint suggestions from Dimitrov (2012) and Schreiber et al. (2006) for acceptable model fit in CFA: chi-square absolute fit index (CMIN; non-significant p-value or χ2 to df < 3), comparative fit index (CFI; .90 to .95 = acceptable fit and > .95 = close fit), root mean square error of approximation (RMSEA; ≤ .08), and the standardized root mean square residual (SRMR; ≤ .08). Internal consistency reliability evidence of test scores is another important step in testing a scale’s psychometric properties. Cronbach’s coefficient alpha (α) is the most popular internal consistency reliability estimate; however, its proper use is dependent on the data meeting several statistical assumptions (McNeish, 2018). Composite internal consistency reliability estimates, such as McDonald’s coefficient omega (ω), tend to produce more stable reliability estimates of scores. Accordingly, the present investigators computed both α and ω.
College students are more likely to discuss mental health concerns with their peers than with faculty, staff, or other university personnel (Wawrzynski et al., 2011; Woodhead et al., 2021). Accordingly, college counseling researchers and practitioners are devoting more time to peer-to-peer mental health support initiatives with the goal of increasing peer-to-peer referrals to the counseling center (Kalkbrenner, Sink, & Smith, 2020; Olson et al., 2016). Past investigators (e.g., Kalkbrenner, Neukrug, & Esquivel, 2022) found that the RFSV barriers were significant predictors of peer-to-peer referrals to the counseling center with non-STEM students. To test the generalizability of this finding with STEM students, we conducted a logistic regression analysis to answer the second RQ regarding the capacity of STEM students’ RFSV scores to predict at least one peer referral to the counseling center. STEM students’ interval-level composite scores on the Fit, Stigma, and Value subscales were entered into the model as predictor variables. The criterion variable was quantified on a categorical scale. On the demographic questionnaire, students responded to the following question: “Have you ever referred (recommended) another student to counseling services?” and selected either “0 = never referred a peer to the counseling center” or “1 = referred one or more peers to the counseling center.”
A 2(gender) X 3(race/ethnicity) X 2(help-seeking history) multivariate analysis of variance (MANOVA) was computed to investigate the third RQ regarding demographic differences in RFSV barriers among STEM students. The three categorical-level independent variables included gender (male or female), race/ethnicity (Latinx, White, or other ethnicity), and help-seeking history (never attended counseling or attended at least one counseling session). The three interval-level dependent variables included STEM students’ composite scores on the Fit, Stigma, and Value subscales. Discriminant analysis was employed as a post hoc test for MANOVA (Warne, 2014).
Results
The RFSV Scale items were entered into a CFA to test the dimensionality of scores with STEM students (RQ1). Excluding the CMIN (χ2 [74] = 257.55, p < .001, χ2 to df = 3.48), results revealed a satisfactory model fit: CFI = .92; RMSEA = .08, 90% CI [.07, .10]; and SRMR = .08. The CMIN tends to underestimate model fit with samples that are large enough for CFA (Dimitrov, 2012). Thus, adequate internal structure validity evidence of scores was achieved based on the collective CFI, RMSEA, and SRMR results. The standardized factor loadings were all acceptable-to-strong and ranged from .48 to .90 (see Figure 1, Model 1).
Figure 1
Revised FSV Scale Path Models With Standardized Coefficients
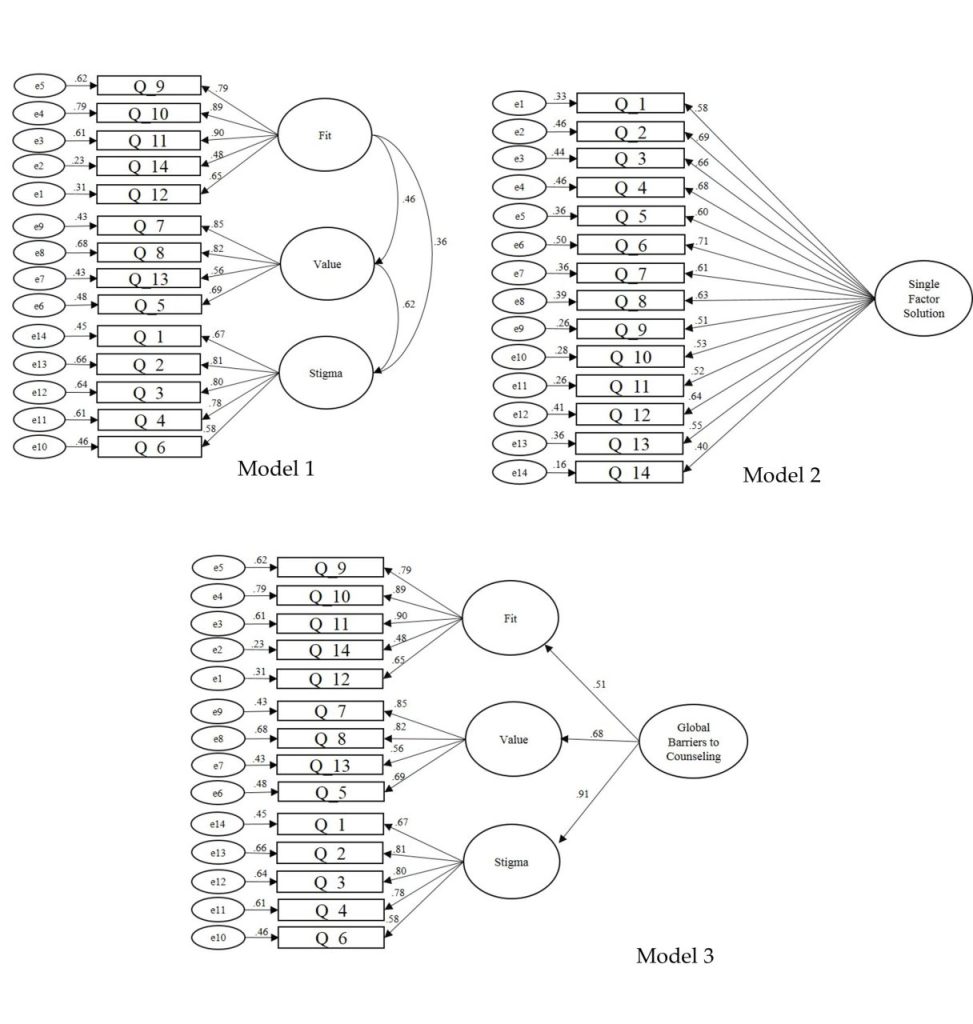
Based on the findings of Kalkbrenner and Neukrug (2019), we computed a higher-order confirmatory factor analysis (HCFA) to test for a Global Barriers to Counseling scale. As expected, the single-factor RFSV model (see Figure 1, Model 2) revealed poor model fit: CMIN (χ2 [77] = 1,013.71, p < .001, χ2 to df = 13.17); CFI = .61; RMSEA = .19, 90% CI [.18, .20]; and SRMR = .13. Accordingly, the theoretical support for a higher-order model (Kalkbrenner & Neukrug, 2019) coupled with the poor fitting single-factor model (see Figure 1, Model 2) indicated that computing an HCFA was appropriate. Except for the CMIN (χ2 [74] = 257.55, p < .001, χ2 to df = 3.48), the higher-order model (see Figure 1, Model 3) displayed a satisfactory model fit: CFI = .92; RMSEA = .08, 90% CI [.07, .10]; and SRMR = .08. Tests of internal consistency reliability revealed satisfactory reliability evidence of scores on the Fit (α = .84, ω = .83), Stigma (α = .86, ω = .87), and Value (α = .79, ω = .79) subscales and the Global Barriers to Counseling scale (α = .88, ω = .88).
STEM students’ RFSV scores were entered into a logistic regression analysis to answer RQ2 regarding the capacity of STEM students’ RFSV scores to predict at least one referral to the counseling center. The logistic regression model was statistically significant, X2(1) = 80.97, p < .001, Nagelkerke R2 = .064. The odds ratios, Exp(B), revealed that a decrease of one unit in STEM students’ scores on the Value subscale (higher scores = less value toward counseling) was associated with a decrease in the odds of having made at least one peer-to-peer referral to the counseling center by a factor of .559.
A factorial MANOVA was computed to answer RQ3 regarding demographic differences in RFSV barriers among STEM students. A significant main effect emerged for gender on the combined dependent variables, F(3, 316) = 5.23, p = .002, Pillai’s Trace = 0.05, η2p = 0.047. The post hoc discriminant analysis (DA) revealed a significant discriminant function, Wilks λ = 0.93, χ2 = 23.60, df = 3, canonical correlation = 0.26, p < .001. The standardized canonical discriminant function coefficients between the latent factors and discriminant functions showed that the Value factor loaded more strongly on the discriminant function (1.10) than the Stigma (0.17) or Fit (−0.62) factors. The mean discriminant score on the function for male participants was 0.40. The mean discriminant score on the function for female participants was −0.19. In other words, the MANOVA and post hoc DA revealed that male STEM students scored significantly higher (higher scores reflect greater reluctance to seek counseling) on the Value barrier when compared to female STEM students.
A significant main effect also emerged for help-seeking history on the combined dependent variables, F(3, 467) = 4.65, p = .003, Pillai’s Trace = 0.04, η2p = 0.042. The post hoc DA displayed a significant discriminant function, Wilks λ = 0.93, χ2 = 24.10, df = 3, canonical correlation = 0.26, p < .001. The standardized canonical discriminant function coefficients between the latent factors and discriminant functions showed that the Value factor loaded more strongly on the discriminant function (1.10) than the Stigma (0.01) or Fit (−0.71) factors. The mean discriminant score on the function for participants without a help-seeking history was 0.25. The mean discriminant score on the function for participants with a help-seeking history was −0.29. In other words, the MANOVA and post hoc DA showed that STEM students without a help-seeking history scored significantly higher on the Value barrier than STEM students with a help-seeking history.
Discussion
The purpose of the present study was to validate STEM students’ scores on the RFSV Scale and investigate demographic correlates with the Fit, Stigma, and Value barriers. The CFA results demonstrated that the RFSV Scale and its dimensions were estimated adequately with a sample of STEM students. This finding is consistent with the existing body of literature on the generalizability of scores on the RFSV Scale with a number of non-college populations (e.g., Kalkbrenner, Goodman-Scott, & Neukrug, 2020; Kalkbrenner & Neukrug, 2018). In addition to a stringent test of internal structure validity, CFA is also a theory-testing procedure (Mvududu & Sink, 2013). Thus, our CFA results indicated that Fit, Stigma, and Value comprise a tri-dimensional theoretical model of barriers to counseling among STEM students. Consistent with the results of Kalkbrenner and Neukrug (2019), we found support for a higher-order Global Barriers to Counseling scale. The presence of a higher-order factor (see Figure 1, Model 3) indicates that the covariation between the first-order Fit, Stigma, and Value subscales comprises a meta-level latent trait. Collectively, the single-order and higher-order CFA results indicate that Fit, Stigma, and Value are discrete dimensions of an interconnected latent trait. Accordingly, CFA results provided support for the dimensionality of both the single-order RFSV model (see Figure 1, Model 1) and the higher-order model (see Figure 1, Model 3) with STEM students.
STEM students face unique risks for mental health issues, including maladaptive perfectionism as well as intense pressure to perform in harsh and competitive academic environments (Rice et al. 2015; Shapiro & Sax, 2011). These unique risk factors coupled with STEM students’ reticence to seek counseling (Kalkbrenner, James, & Pérez-Rojas, 2022) created a need for a screening tool for appraising why STEM students might avoid accessing counseling services. The results of the CFA and HCFA in the present study begin to address the gap in the literature regarding the lack of a screening tool with validated scores for appraising barriers to counseling among STEM students. Our CFA and HCFA results suggest that college counselors can use the RFSV Scale as one way to understand why STEM students on their campus are reluctant to access counseling services.
Consistent with the findings of Kalkbrenner and Neukrug (2019), we found statistically significant differences in peer-to-peer referrals and demographic differences in STEM students’ scores on the Value barrier. Specifically, increases in STEM students’ belief in the value of attending counseling were associated with significant increases in the odds of making one or more peer referrals to the counseling center, as indicated by the moderate effect size of the finding. It appears that STEM students’ attendance in personal counseling increases their propensity for recommending counseling to their peers. Similar to Kalkbrenner and Neukrug (2018), tests of group demographic differences revealed that STEM students in the present study with a help-seeking history were less sensitive to the Value barrier than STEM students without a help-seeking history. These findings indicate that attendance in counseling might enhance STEM students’ belief that the effort required to attend counseling is worth the benefits. Perhaps experiencing counseling firsthand increases STEM students’ belief in the value of counseling as well as their disposition to refer a peer to counseling. This finding has particularly important implications, as STEM students are a distinct college-based population with unique mental health needs who tend to utilize mental health support services at lower rates than non-STEM students (Kalkbrenner, James, & Pérez-Rojas, 2022; Rice et al., 2015; Shapiro & Sax, 2011). In particular, our results suggest that STEM students who access counseling services usually see value in the process. STEM students’ general attitudes about counseling might become more positive if more and more STEM students participate in counseling.
Also, consistent with the findings of Kalkbrenner and Neukrug (2018), we found demographic differences in STEM students’ scores on the Value barrier by gender identity, with males attributing less value to attending counseling than females. Macro- and micro-systemic gender role forces tend to contribute to men’s reticence to seek counseling (Neukrug et al., 2013). These forces might be intensified among male STEM students considering the intersectionality between gender roles and the high-pressure environment in STEM majors to not show vulnerability (Lipson et al., 2016; Neukrug et al., 2013). Specifically, gender-role pressures to avoid showing vulnerability coupled with a high-pressure academic environment might make male STEM students especially reluctant to seek counseling. Men are also less likely than women to recognize and seek treatment for mental health issues (Kalkbrenner & Neukrug 2018; Neukrug et al., 2013). Thus, it is also possible that male STEM students are less likely to recognize mental distress as a potentially serious health issue, which contributes to them placing less value on the benefits of counseling when compared to their female counterparts. Future research is needed to test these possible explanations for this finding.
Implications
The findings of this study have a number of implications for professional counselors who work in college settings. The CFA and HCFA results extend the psychometric properties of the RFSV Scale to STEM students (RQ1), which is an important contribution to the measurement literature, as the scale offers professional counselors a brief screening tool that usually takes 10 minutes or less to complete. The RFSV Scale can be administered at the systemic level (e.g., all STEM students at a university). Tests of internal structure reveal support for a three-dimensional RFSV model (see Figure 1, Model 1) as well as a higher-order model (see Figure 1, Model 3) with STEM students. Accordingly, professional counselors can administer and score one or both RFSV models depending on their mental health screening goals. The Global Barriers to Counseling scale might have utility for college counselors who are aiming to gather baseline information about STEM students’ general reticence to seek counseling. The three-dimensional model can provide more specific information (Fit, Stigma, and/or Value) about the reasons why STEM students on a particular campus are reluctant to seek counseling.
Our results reveal that increases in STEM students’ scores on the Value subscale were associated with a noteworthy increase in the odds of making a peer-to-peer referral to the counseling center. This finding coupled with STEM students’ vulnerability to mental distress (Daker et al., 2021; Kalkbrenner, James, & Pérez-Rojas, 2022; Lipson et al., 2016; Shapiro & Sax, 2011) suggests that peer-to-peer referrals to mental health support services might be more important than ever before in connecting STEM students in mental distress to support services. Professional counselors who work in college settings can administer the RFSV Scale to STEM students and use the results as one method of informing the content of peer-to-peer mental health support initiatives. If, for example, STEM students on a particular campus score higher on the Value subscale (higher scores denote less value toward counseling), there might be utility in including information about the many benefits of counseling in peer-to-peer outreach initiatives for STEM students. Specifically, it might be beneficial to discuss both the academic and personal benefits associated with attending counseling. For groups of STEM students who score higher on the Stigma scale, college counselors might take a strengths-based perspective by discussing how attending counseling takes courage and strength.
College counselors and student affairs officials can reach STEM students by partnering with STEM faculty and administrators to attend STEM orientations and classes that are held in large lecture halls. College counselors may build relationships with department heads and program directors of STEM programs through sharing empirical evidence on STEM students’ unique mental health needs and their reticence to access mental health support services (Kalkbrenner, James, & Pérez-Rojas, 2022; Lipson et al., 2016; Shapiro & Sax, 2011). College counselors might also discuss how increases in STEM students’ mental health is associated with greater retention and academic success, which are key values in STEM programs (Daker et al., 2021; Lockard et al., 2019; Meaders et al., 2020; Muenks et al., 2020). As buy-in from STEM department heads and program directors increases, there might be utility in professional counselors regularly making presentations and facilitating discussions about mental health and the benefits of attending counseling during new STEM student orientations. The content of these presentations can be based on the extant literature regarding the socio-personal factors that can place STEM students at risk for mental distress—for example, maladaptive perfectionism (Rice et al., 2015), high-pressure academic environments (Shapiro & Sax, 2011), and difficulty recognizing warning signs for mental distress (Kalkbrenner, James, & Pérez-Rojas, 2022). Once STEM students learn about these socio-personal factors, the presentation content can shift to psychoeducation about the utility of counseling for improving both personal and academic outcomes (Lockard et al., 2019).
The RFSV Scale can also be administered on more targeted levels, for example, to specific groups of STEM students who might be particularly vulnerable to mental health distress. There might be utility in administering the RFSV Scale to male STEM students considering that we found male STEM students were more sensitive to the Value barrier than female STEM students. College counselors can use the RFSV results to identify specific barriers (e.g., Value) that might be making STEM students on their campus unlikely to access counseling services. Such results can be used to inform thes curriculum of mental health programming (e.g., peer-to-peer support initiatives). When working with male STEM students, college counselors might consider the intersectionality of academic pressure (Lipson et al., 2016) and gender-role–based mental health stressors (Neukrug et al., 2013) they might be facing. In all likelihood, considering the intersectionality between these socio-personal factors will help college counselors address their clients’ presenting concerns holistically.
Limitations and Future Research
The methodological limitations of this research should be reviewed when considering the implications of the results. The preset data were collected from STEM students in three different cities located in the Southwestern United States; however, results might not generalize to STEM students in other geographical locations. Future researchers can validate RFSV scores with national and international samples of STEM students. Moreover, the findings of cross-sectional research designs are correlational, which prevents researchers from drawing conclusions regarding cause-and-effect. Now that STEM students’ scores on the RFSV Scale are validated, future investigators can extend this line of inquiry by conducting outcome research on the effectiveness of interventions geared toward promoting the utilization of mental health support services among STEM students.
Although factor analytic results in the present study were promising, STEM students are not a homogenous group. To this end, future investigators can extend this line of research by conducting factorial invariance testing to examine the psychometric equivalence of RFSV scores across subgroups of STEM students. As just one example, past investigators (e.g., Shapiro & Sax, 2011) found differences in STEM students’ mental health by gender identity. Relatedly, our results did not reveal demographic differences by race/ethnicity in STEM students’ vulnerability to barriers to counseling. However, we used a dummy-coding procedure to create racial/ethnic identity comparison groups (Latinx, White, or other ethnicity) that were large enough for statistical analyses. Clustering participants with racial/ethnic identities other than White or Latinx into one group might have masked significant findings within the other race/ethnicity group. It is also possible that some participants identified as White and Latinx, as White is a racial category and Latinx is an ethnic category. Future researchers should examine potential disparities in barriers to counseling among more racially and ethnically diverse samples of STEM students. In an extension of the extant literature on samples of primarily male STEM students, the present study included notably more (> 50%) female STEM students when compared to a national demographic profile of STEM students (NCES, 2020). However, the findings of the present study might not generalize to STEM students with gender identities that extend beyond only male or female. Accordingly, future researchers can test the invariance of RFSV scores with more gender-diverse samples.
The findings of the CFA and HCFA in the present study supported Fit, Stigma, and Value as barriers to counseling among STEM students. However, the deductive nature of quantitative research does not capture the nuances of participants’ lived experiences. One way that future investigators can extend this line of research is through qualitative investigations of STEM students’ attitudes and values about seeking counseling services. Qualitative results might reveal important nuances and insights into STEM students’ propensity to access mental health support services.
Conclusion
To the best of our knowledge, the present investigation is the first to establish the psychometric properties of a barriers to counseling tool with STEM students. The results represent an important contribution to the measurement literature, as confirming the internal structure of test scores on an existing measure with a previously untested population is a vital step in demonstrating construct validity. We also found that decreases in STEM students’ reticence to seek counseling was predictive of statistically significant increases in the odds of making a peer referral to the counseling center. In addition, results revealed demographic differences in barriers to counseling among STEM students by gender and help-seeking history. Collectively, our findings suggest that professional counselors who work in college settings can use the RFSV Scale as one way to support STEM college student mental health by identifying why STEM students might be reticent to access counseling services. Supporting STEM students’ mental health has implications for increasing their retention rates, completion rates, and overall psychological well-being.
Conflict of Interest and Funding Disclosure
The authors reported no conflict of interest
or funding contributions for the development
of this manuscript.
References
Al-Maraira, O. A., & Shennaq, S. Z. (2021). Investigation of depression, anxiety and stress levels of health-care students during COVID-19 pandemic. Mental Health Review Journal, 26(2), 113–127.
https://doi.org/10.1108/MHRJ-10-2020-0070
Bryan, A. E. B., & Arkowitz, H. (2015). Meta-analysis of the effects of peer-administered psychosocial interventions on symptoms of depression. American Journal of Community Psychology, 55(3–4), 455–471. https://doi.org/10.1007/s10464-015-9718-y
Byrom, N. (2018). An evaluation of a peer support intervention for student mental health. Journal of Mental Health, 27(3), 240–246. https://doi.org/10.1080/09638237.2018.1437605
Caporale-Berkowitz, N. A. (2022). Let’s teach peer support skills to all college students: Here’s how and why. Journal of American College Health, 70(7), 1921–1925. https://doi.org/10.1080/07448481.2020.1841775
Daker, R. J., Gattas, S. U., Sokolowski, H. M., Green, A. E., & Lyons, I. M. (2021). First-year students’ math anxiety predicts STEM avoidance and underperformance throughout university, independently of math ability. NPJ Science of Learning, 6(1), Article 17. https://doi.org/10.1038/s41539-021-00095-7
Dimitrov, D. M. (2012). Statistical methods for validation of assessment scale data in counseling and related fields. American Counseling Association.
Hong, V., Busby, D. R., O’Chel, S., & King, C. A. (2022). University students presenting for psychiatric emergency services: Socio-demographic and clinical factors related to service utilization and suicide risk. Journal of American College Health, 70(3), 773–782. https://doi.org/10.1080/07448481.2020.1764004
Kalkbrenner, M. T., Goodman-Scott, E., & Neukrug, E. S. (2020). Validation of high school students’ scores on the Revised Fit, Stigma, and Value Scale: Implications for school counseling screening. Professional School Counseling, 23(1). https://doi.org/10.1177/2156759X20912750
Kalkbrenner, M. T., James, C., & Pérez-Rojas, A. E. (2022). College students’ awareness of mental disorders and resources: Comparison across academic disciplines. Journal of College Student Psychotherapy, 36(2), 113–134. https://doi.org/10.1080/87568225.2020.1791774
Kalkbrenner, M. T., Lopez, A. L., & Gibbs, J. R. (2020). Establishing the initial validity of the REDFLAGS Model: Implications for college counselors. Journal of College Counseling, 23(2), 98–112. https://doi.org/10.1002/jocc.12152
Kalkbrenner, M. T., & Neukrug, E. S. (2018). Identifying barriers to attendance in counseling among adults in the United States: Confirming the factor structure of the Revised Fit, Stigma, & Value Scale. The Professional Counselor, 8(4), 299–313. https://doi.org/10.15241/mtk.8.4.299
Kalkbrenner, M. T., & Neukrug, E. S. (2019). The utility of the Revised Fit, Stigma, and Value Scale with counselor trainees: Implications for enhancing clinical supervision. The Clinical Supervisor, 38(2), 262–280. https://doi.org/10.1080/07325223.2019.1634665
Kalkbrenner, M. T., Neukrug, E. S., & Esquivel, L. E. (2022). Mental health literacy screening of students in Hispanic Serving Institutions. Journal of Counseling & Development, 100(3), 319–329. https://doi.org/10.1002/jcad.12428
Kalkbrenner, M. T., Neukrug, E. S., & Griffith, S. A. (2019). Appraising counselor attendance in counseling: The validation and application of the Revised Fit, Stigma, and Value Scale. Journal of Mental Health Counseling, 41(1), 21–35. https://doi.org/10.17744/mehc.41.1.03
Kalkbrenner, M. T., Sink, C. A., & Smith, J. L. (2020). Mental health literacy and peer-to-peer counseling referrals among community college students. Journal of Counseling & Development, 98(2), 172–182. https://doi.org/10.1002/jcad.12311
Kivlighan, D. M., III, Schreier, B. A., Gates, C., Hong, J. E., Corkery, J. M., Anderson, C. L., & Keeton, P. M. (2021). The role of mental health counseling in college students’ academic success: An interrupted time series analysis. Journal of Counseling Psychology, 68(5), 562–570. https://doi.org/10.1037/cou0000534
Lipson, S. K., Zhou, S., Wagner, B., Beck, K., & Eisenberg, D. (2016). Major differences: Variations in undergraduate and graduate student mental health and treatment utilization across academic disciplines. Journal of College Student Psychotherapy, 30(1), 23–41. https://doi.org/10.1080/87568225.2016.1105657
Lockard, A. J., Hayes, J. A., Locke, B. D., Bieschke, K. J., & Castonguay, L. G. (2019). Helping those who help themselves: Does counseling enhance retention? Journal of Counseling & Development, 97(2), 128–139. https://doi.org/10.1002/jcad.12244
McNeish, D. (2018). Thanks coefficient alpha, we’ll take it from here. Psychological Methods, 23(3), 412–433. https://doi.org/10.1037/met0000144
Meaders, C. L., Lane, A. K., Morozov, A. I., Shuman, J. K., Toth, E. S., Stains, M., Stetzer, M. R., Vinson, E., Couch, B. A., & Smith, M. K. (2020). Undergraduate student concerns in introductory STEM courses: What they are, how they change, and what influences them. Journal for STEM Education Research, 3(2), 195–216. https://doi.org/10.1007/s41979-020-00031-1
Muenks, K., Canning, E. A., LaCosse, J., Green, D. J., Zirkel, S., Garcia, J. A., & Murphy, M. C. (2020). Does my professor think my ability can change? Students’ perceptions of their STEM professors’ mindset beliefs predict their psychological vulnerability, engagement, and performance in class. Journal of Experimental Psychology, 149(11), 2119–2144. https://doi.org/10.1037/xge0000763
Mvududu, N. H., & Sink, C. A. (2013). Factor analysis in counseling research and practice. Counseling Outcome Research and Evaluation, 4(2), 75–98. https://doi.org/10.1177/2150137813494766
National Center for Educational Statistics. (2020). Science, Technology, Engineering, and Mathematics (STEM) education, by gender. https://nces.ed.gov/fastfacts/display.asp?id=899
Neukrug, E., Britton, B. S., & Crews, R. C. (2013). Common health-related concerns of men: Implications for counselors. Journal of Counseling & Development, 91(4), 390–397. https://doi.org/10.1002/j.1556-6676.2013.00109
Neukrug, E. S., Kalkbrenner, M. T., & Griffith, S.-A. M. (2017). Barriers to counseling among human service professionals: The development and validation of the Fit, Stigma, & Value (FSV) Scale. Journal of Human Services, 37(1), 27–40. https://digitalcommons.odu.edu/cgi/viewcontent.cgi?article=1016&context=chs_pubs
Olson, K., Koscak, G., Foroudi, P., Mitalas, E., & Noble, L. (2016). Recognize and refer: Engaging the Greek community in active bystander training. College Student Affairs Journal, 34(3), 48–61. https://doi.org/10.1353/csj.2016.0018
Rice, K. G., Ray, M. E., Davis, D. E., DeBlaere, C., & Ashby, J. S. (2015). Perfectionism and longitudinal patterns of stress for STEM majors: Implications for academic performance. Journal of Counseling Psychology, 62(4), 718–731. https://doi.org/10.1037/cou0000097
Rincon, B. E., & George-Jackson, C. E. (2016). STEM intervention programs: Funding practices and challenges. Studies in Higher Education, 41(3), 429–444. https://doi.org/10.1080/03075079.2014.927845
Schreiber, J. B., Nora, A., Stage, F. K., Barlow, E. A., & King, J. (2006). Reporting structural equation modeling and confirmatory factor analysis results: A review. The Journal of Educational Research, 99(6), 323–338. https://doi.org/10.3200/JOER.99.6.323-338
Schwitzer, A. M., Moss, C. B., Pribesh, S. L., St. John, D. J., Burnett, D. D., Thompson, L. H., & Foss, J. J. (2018). Students with mental health needs: College counseling experiences and academic success. Journal of College Student Development, 59(1), 3–20. https://doi.org/10.1353/csd.2018.0001
Shapiro, C. A., & Sax, L. J. (2011). Major selection and persistence for women in STEM. New Directions for Institutional Research, 2011(152), 5–18. https://doi.org/10.1002/ir.404
U.S. Department of Education. (2020). Science, technology, engineering, and math, including computer science. https://www.ed.gov/stem
Warne, R. (2014). A primer on multivariate analysis of variance (MANOVA) for behavioral scientists. Practical Assessment, Research, and Evaluation, 19, 1–10. https://doi.org/10.7275/sm63-7h70
Wawrzynski, M. R., LoConte, C. L., & Straker, E. J. (2011). Learning outcomes for peer educators: The national survey on peer education. Emerging Issues and Practices in Peer Education, 2011(133), 17–27.
https://doi.org/10.1002/ss.381
Woodhead, E. L., Chin-Newman, C., Spink, K., Hoang, M., & Smith, S. A. (2021). College students’ disclosure of mental health problems on campus. Journal of American College Health, 69(7), 734–741.
https://doi.org/10.1080/07448481.2019.170653
Michael T. Kalkbrenner, PhD, NCC, is an associate professor at New Mexico State University. Gabriella Miceli, MS, LPC-A, is a doctoral student at New Mexico State University. Correspondence may be addressed to Michael T. Kalkbrenner, 1780 E. University Ave., Las Cruces, NM 88003, mkalk001@nmsu.edu.
Nov 29, 2018 | Volume 8 - Issue 4
Michael T. Kalkbrenner, Edward S. Neukrug
The primary aim of this study was to cross-validate the Revised Fit, Stigma, & Value (FSV) Scale, a questionnaire for measuring barriers to counseling, using a stratified random sample of adults in the United States. Researchers also investigated the percentage of adults living in the United States that had previously attended counseling and examined demographic differences in participants’ sensitivity to barriers to counseling. The results of a confirmatory factor analysis supported the factorial validity of the three-dimensional FSV model. Results also revealed that close to one-third of adults in the United States have attended counseling, with women attending counseling at higher rates (35%) than men (28%). Implications for practice, including how professional counselors, counseling agencies, and counseling professional organizations can use the FSV Scale to appraise and reduce barriers to counseling among prospective clients are discussed.
Keywords: barriers to counseling, FSV Scale, confirmatory factor analysis, attendance in counseling, factorial validity
According to the World Health Organization (WHO), mental health disorders are widespread, with over 300 million people struggling with depressive disorders, 260 million living with anxiety disorders, and hundreds of millions having any of a number of other mental health disorders (WHO, 2017, 2018). The symptoms of anxiety and depressive disorders can be dire and include hopelessness, sadness, sleep disturbances, motivational impairment, relationship difficulties, and suicide in the most severe cases (American Psychiatric Association, 2013). Worldwide, one in four individuals will be impacted by a mental health disorder in their lifetime, which leads to over a trillion dollars in lost job productivity each year (WHO, 2018). In the United States, approximately one in five adults has a diagnosable mental illness each year, and about 20% of children and teens will develop a mental disorder that is disabling (Centers for Disease Control, 2018).
Substantial increases in mental health distress among the U.S. and global populations have impacted the clinical practice of counseling practitioners who work in a wide range of settings, including schools, social service agencies, and colleges (National Institute of Mental Health, 2017; Twenge, Joiner, Rogers, & Martin, 2017). Identifying the percentage of adults in the United States who attend counseling, as well as the reasons why many do not, can help counselors develop strategies that can make counseling more inviting and, ultimately, relieve struggles that people face. Although perceived stigma and not having health insurance have been associated with reticence to seek counseling (Han, Hedden, Lipari, Copello, & Kroutil, 2014; Norcross, 2010; University of Phoenix, 2013), the literature on barriers to counseling among people in the United States is sparse. Appraising barriers to counseling using a psychometrically sound instrument is the first step toward counteracting such barriers and making counseling more inviting for prospective clients. Evaluating barriers to counseling, with special attention to cultural differences, has the potential to help understand differences in attendance to counseling and can help develop mechanisms that promote counseling for all individuals. This is particularly important as research has shown that there are differences in help-seeking behavior as a function of gender identity and ethnicity (Hatzenbuehler, Keyes, Narrow, Grant, & Hasin, 2008).
Attendance in Counseling by Gender and Ethnicity
Previous investigations on attendance in counseling indicated that 15–38% of adults in the United States had sought counseling at some point in their lives (Han et al., 2014; University of Phoenix, 2013), with discrepancies in counselor-seeking behavior found as a function of gender and ethnicity (Han et al., 2014; Lindinger-Sternart, 2015). For instance, women are more likely to seek counseling compared to men (Abrams, 2014; J. Kim, 2017). In addition, individuals who identify as White tend to seek personal counseling at higher rates compared to those who identify with other ethnic backgrounds (Hatzenbuehler et al., 2008; Seidler, Rice, River, Oliffe, & Dhillon, 2017). Parent, Hammer, Bradstreet, Schwartz, and Jobe (2018) examined the intersection of gender, race, ethnicity, and poverty with help-seeking behavior and found the income-to-poverty ratio to be positively related to help-seeking for White males and negatively associated for African American males. In other words, as White males gained in income, they were more likely to seek counseling, whereas the opposite was true for males who identified as African American (Parent et al., 2018).
Barriers to Mental Health Treatment and Attendance in Counseling
Despite the fact that large numbers of individuals in the United States and worldwide will develop a mental disorder in their lifetime, two-thirds of them will avoid or do not have access to mental health treatment (WHO, 2018). In wealthier countries, there is one mental health worker per 2,000 people (WHO, 2015); however, in poorer countries, this drops to 1 in 100,000, and such disparities need to be addressed (Hinkle, 2014; WHO, 2015). Although the lack of attendance in counseling and related services in poorer countries is explained by lack of services, in the United States and other wealthy countries, the availability of mental health services is relatively high, and the lack of attendance is usually explained by other reasons (Neukrug, Kalkbrenner, & Griffith, 2017; WHO, 2015). Research on the lack of attendance in counseling by the general public shows adults in the United States might be reticent to seek counseling because of perceived stigma, financial burden, lack of health insurance, uncertainty about how to find a counselor, and suspicion that counseling will not be helpful (Han et al., 2014; Norcross, 2010; University of Phoenix, 2013).
Appraising Barriers to Counseling
The quantification and appraisal of barriers to counseling is a nuanced and complex construct to measure and has been previously assessed with populations of mental health professionals and with counseling students (Kalkbrenner & Neukrug, 2018; Kalkbrenner, Neukrug, & Griffith, in press; Neukrug et al., 2017). Knowing that personal counseling is a valuable self-care strategy for mental health professionals (Whitfield & Kanter, 2014), Neukrug et al. (2017) developed the original version of the Fit, Stigma, & Value (FSV) Scale, which is comprised of three latent variables, or subscales, of barriers to counseling for human service professionals: fit (the degree to which one trusts the process of counseling), stigma (hesitation to seek counseling because of feelings of embarrassment), and value (the extent to which a respondent thinks that attending personal counseling will be beneficial). Kalkbrenner et al. (in press) extended and validated a revised version of the FSV Scale with a sample of professional counselors, and Kalkbrenner and Neukrug (2018) validated the Revised FSV Scale with a sample of counselor trainees. Although the FSV Scale appears to have utility for appraising barriers to counseling among mental health professionals (Neukrug et al., 2017; Kalkbrenner et al., in press) the factorial validity of the measure has only been tested with helping professionals and counseling students. The appraisal of barriers to seeking counseling among adults in the United States is an essential first step in understanding why prospective clients do, or do not, seek counseling. If validated, researchers and practitioners can potentially use the results of the Revised FSV Scale to aid in the early identification of specific barriers and to inform the development of interventions geared toward reducing barriers to counseling among adults in the United States. Thus, we sought to answer the following research questions (RQs): RQ 1: Is the three-dimensional hypothesized model of the Revised FSV scale confirmed with a stratified random sample of adults in the United States? RQ 2: To what extent do adults in the United States attend counseling? RQ 3: Are there demographic differences to the FSV barriers among adults in the United States?
Method
The psychometric properties of the Revised FSV Scale were tested with a confirmatory factor analysis (CFA) based on structural equation modeling (RQ 1). Descriptive statistics were used to compute participants’ frequency of attendance in counseling (RQ 2). A factorial multivariate analysis of variance (MANOVA) was computed to investigate demographic differences in respondents’ sensitivity to the FSV barriers (RQ 3). A minimum sample size of 320 (10 participants for each estimated parameter) was determined to be sufficient for computing a CFA (Mvududu & Sink, 2013). An a priori power analysis was conducted using G*Power to determine the sample size for the factorial MANOVA (Faul, Erdfelder, Lang, & Buchner, 2007). Results revealed that a minimum sample size of 269 would provide an 80% power estimate (α = .05), with a moderate effect size, f 2 = 0.25 (Cohen, 1988).
Participants and Procedures
After obtaining IRB approval, an online sampling service (Qualtrics, 2018) was contracted to survey a stratified random sample (stratified by age, gender, and ethnicity) of the general U.S. population based on the 2016–2017 census data. A Qualtrics project management team generated a list of parameters and sample quota constraints for data collection. Once the researchers reviewed and confirmed these parameters, a project manager initiated the stratified random sampling procedure and data collection by sending an electronic link to the questionnaire to prospective participants. A pilot study was conducted using 41 participants and no formatting or imputation errors were found. Data collection for the main study was initiated and was completed in less than one week.
A total of 431 individuals responded to the survey. Of these, 21 responses were omitted because of missing data, yielding a useable sample of 410. Participants ranged in ages from 18 to 84 (M = 45,
SD = 15). The demographic profile included the following: 52% (n = 213) identified as female, 44%
(n = 181) as male, 0.5% (n = 2) as transgender, and 3.4% (n = 14) did not specify their gender. For ethnicity, 63% (n = 258) identified as White, 17% (n = 69) as Hispanic/Latinx, 12% (n = 49) as African American, 5% (n = 21) as Asian, 1% (n = 5) as American Indian or Alaska Native, 0.5% (n = 2) as Native Hawaiian or Pacific Islander, and 1.5% (n = 6) did not specify their ethnicity. For highest degree completed, 1% (n = 5) held a doctoral degree, 7% (n = 29) held a master’s degree, 24% (n = 98) held a bachelor’s degree, 16% (n = 65) had completed an associate degree, 49% (n = 199) had a high school diploma, and 3% (n = 14) did not specify their highest level of education. Eighty-four percent (n = 343) of participants had health insurance at the time of data collection. The demographic profile of our sample is consistent with those found in recent surveys of the general U.S. population (Lumina Foundation, 2017; U.S. Census Bureau, 2017).
Instrumentation
Using the Qualtrics e-survey platform (Qualtrics, 2018), participants were asked to respond to a series of demographic questions as well as the Revised FSV Scale.
Demographic questionnaire. Participants responded to a series of demographic items about their age, ethnicity, gender, highest level of education completed, and if they had health insurance. They also were asked to indicate if they had ever recommended counseling to another person and if they had ever participated in at least one session of counseling as defined by the American Counseling Association (ACA) in the 20/20: Consensus Definition of Counseling: “counseling is a professional relationship that empowers diverse individuals, families, and groups to accomplish mental health, wellness, education, and career goals” (2010, para. 2).
The FSV Scale. The original version of the FSV Scale contained 32 items that comprise three subscales (Fit, Stigma, and Value) for appraising barriers to counselor seeking behavior (Neukrug et al., 2017). Kalkbrenner et al. (in press) developed and validated the Revised FSV Scale by reducing the number of items to 14 (of the original 32) and confirmed the same 3-factor structure of the scale. The Revised FSV Scale (see Table 1) was used in the present study for temporal validity, as it is more current and because it is likely to reduce respondent fatigue, because it is shorter than the original. The Fit subscale appraises the degree to which one trusts the process of counseling (e.g., item 11: “I couldn’t find a counselor who would understand me.”). The Stigma subscale measures respondents’ hesitation to seek counseling because of feelings of embarrassment (e.g., item 1: “My friends would think negatively of me.”). The Value scale reflects the extent to which a respondent thinks that attending personal counseling will be beneficial (e.g., item 8: “It is not an effective use of my time.”). For each item, respondents were prompted with the stem, “I am less likely to attend counseling because . . . ” and asked to rate each item on a Likert-type scale: 1 (strongly disagree), 2 (disagree), 3 (neither agree or disagree), 4 (agree), or 5 (strongly agree). Higher scores designate a greater sensitivity to each barrier. Previous investigators demonstrated adequate to strong internal consistency reliability coefficients for the Revised FSV Scale: α = .82, α = .91, and α = .78, respectively (Kalkbrenner et al., in press) and α = .81, α = .87, and α = .77 (Kalkbrenner & Neukrug, 2018). Past investigators found validity evidence for the 3-dimensional factor structure of the original and revised versions of the FSV Scale through rigorous psychometric testing (factor analysis) with populations of human services professionals (Neukrug et al., 2017), professional counselors (Kalkbrenner et al., in press), and counseling students (Kalkbrenner & Neukrug, 2018).
Results
CFA
A review of skewness and kurtosis values (see Table 1) indicated that the 14 items on the revised FSV scale were largely within the acceptable range of a normal distribution (absolute value < 1; Field, 2013). Mahalanobis d2 indices showed no extreme multivariate outliers. An inter-item correlation matrix (see Table 2) was computed to investigate the suitability of the data for factor analysis. Inter-item correlations were favorable and ranged from r = 0.42 to r = 0.82 (see Table 2).
Table 1
Descriptive Statistics: The Revised Version of the FSV Scale (N = 410)
| Items |
M |
SD |
Skew |
Kurtosis |
| My friends would think negatively of me. (Stigma) |
2.27 |
1.18 |
0.63 |
-0.50 |
| It would suggest I am unstable. (Stigma) |
2.55 |
1.25 |
0.29 |
-0.97 |
| I would feel embarrassed. (Stigma) |
2.72 |
1.20 |
-0.02 |
-1.00 |
| It would damage my reputation. (Stigma) |
2.43 |
1.20 |
0.41 |
-0.78 |
| It would be of no benefit. (Value) |
2.46 |
1.20 |
0.39 |
-0.71 |
| I would feel badly about myself if I saw a counselor. (Stigma) |
2.35 |
1.13 |
0.45 |
-0.61 |
| The financial cost of participating is not worth the personal benefits. (Value) |
2.61 |
1.18 |
0.25 |
-0.68 |
| It is not an effective use of my time. (Value) |
2.40 |
1.16 |
0.45 |
-0.57 |
I couldn’t find a counselor with my theoretical orientation
(personal style of counseling). (Fit) |
2.42 |
1.12 |
0.62 |
-0.68 |
| I couldn’t find a counselor competent enough to work with me. (Fit) |
2.31 |
1.12 |
0.50 |
-0.47 |
| I couldn’t find a counselor who would understand me. (Fit) |
2.41 |
1.20 |
0.48 |
-0.66 |
| I don’t trust a counselor to keep my matters just between us. (Fit) |
2.50 |
1.21 |
0.33 |
-0.82 |
| Counseling is unnecessary because my problems will resolve naturally. (Value) |
2.56 |
1.31 |
0.22 |
-0.61 |
| I have had a bad experience with a previous counselor in the past. (Fit) |
2.34 |
1.17 |
0.44 |
-0.71 |
Table 2
Inter-Item Correlation Matrix
|
Q1 |
Q2 |
Q3 |
Q4 |
Q5 |
Q6 |
Q7 |
Q8 |
Q9 |
Q10 |
Q11 |
Q12 |
Q13 |
Q14 |
| Q1 |
1 |
0.70 |
0.64 |
0.72 |
0.54 |
0.63 |
0.53 |
0.57 |
0.57 |
0.60 |
0.60 |
0.53 |
0.47 |
0.53 |
| Q2 |
|
1 |
0.76 |
0.72 |
0.51 |
0.61 |
0.52 |
0.54 |
0.55 |
0.58 |
0.60 |
0.57 |
0.42 |
0.46 |
| Q3 |
|
|
1 |
0.68 |
0.51 |
0.64 |
0.54 |
0.53 |
0.53 |
0.55 |
0.58 |
0.57 |
0.50 |
0.43 |
| Q4 |
|
|
|
1 |
0.62 |
0.68 |
0.55 |
0.59 |
0.58 |
0.61 |
0.63 |
0.61 |
0.51 |
0.53 |
| Q5 |
|
|
|
|
1 |
0.67 |
0.58 |
0.69 |
0.52 |
0.59 |
0.59 |
0.48 |
0.57 |
0.49 |
| Q6 |
|
|
|
|
|
1 |
0.58 |
0.68 |
0.59 |
0.68 |
0.69 |
0.60 |
0.56 |
0.48 |
| Q7 |
|
|
|
|
|
|
1 |
0.72 |
0.60 |
0.60 |
0.57 |
0.58 |
0.59 |
0.53 |
| Q8 |
|
|
|
|
|
|
|
1 |
0.64 |
0.66 |
0.68 |
0.61 |
0.64 |
0.54 |
| Q9 |
|
|
|
|
|
|
|
|
1 |
0.71 |
0.71 |
0.61 |
0.56 |
0.57 |
| Q10 |
|
|
|
|
|
|
|
|
|
1 |
0.82 |
0.65 |
0.56 |
0.56 |
| Q11 |
|
|
|
|
|
|
|
|
|
|
1 |
0.65 |
0.52 |
0.58 |
| Q12 |
|
|
|
|
|
|
|
|
|
|
|
1 |
0.57 |
0.52 |
| Q13 |
|
|
|
|
|
|
|
|
|
|
|
|
1 |
0.44 |
| Q14 |
|
|
|
|
|
|
|
|
|
|
|
|
|
1 |
A CFA based on structural equation modeling was computed using IBM SPSS Amos version 25 to test the psychometric properties of the revised 14-item scale with adults in the United States (RQ1). A number of goodness-of-fit (GOF) indices recommended by Byrne (2016) were investigated to determine model fit. The Chi Square CMIN absolute fit index was statistically significant: χ2 (74) = 3.54, p < 0.001. More suitable GOF indices for large sample sizes (N > 200) were examined and revealed adequate model fit: comparative fit index (CFI = .96); root mean square error of approximation (RMSEA = .07); 90% confidence interval [.06, .08]; standardized root mean square residual (SRMR = .038); incremental fit index (IFI = .96); and normed fit index (NFI = .94). Collectively, the GOF indices above demonstrated adequate model fit based on the guidelines provided by Byrne. The path model with standardized coefficients is displayed in Figure 1. Tests of internal consistency reliability (Cronbach’s Alpha) revealed strong reliability coefficients for all three FSV subscales: α = .90, α = .91, and α = .87, respectively. An investigation of the path model coefficients (see Figure 1) revealed a moderate to strong association between the FSV barriers. Consequently, researchers computed a follow-up CFA to test if a single-factor model solution for the FSV Scale was a better fit with the data. Results revealed a poor model fit for the single-factor solution, suggesting that retaining the 3-factor model was appropriate for the data.
Figure 1. Confirmatory Factor Analysis Path Model (N = 410)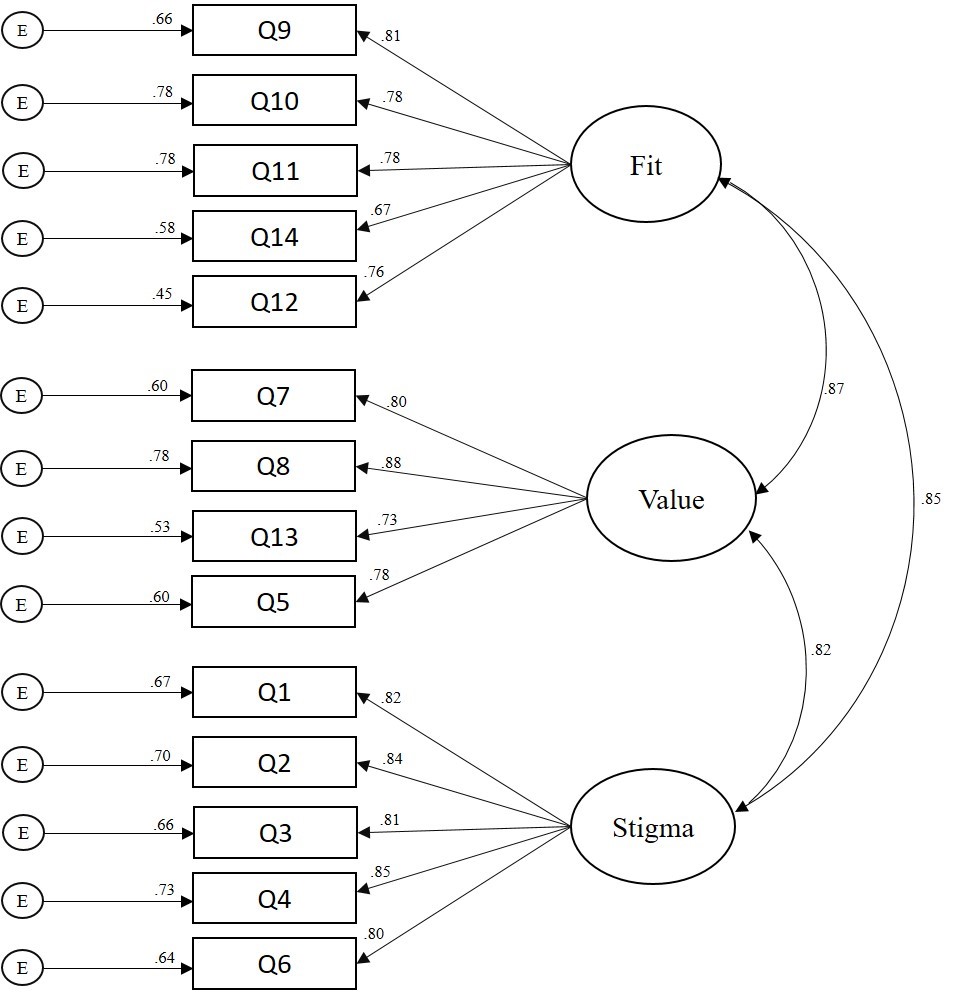
Figure 1. Confirmatory Factor Analysis Path Model (N = 410)
Frequency and Multivariate Analyses
Of the 374 participants who responded to the item regarding whether they had previously attended counseling, 32% (n = 121) indicated they had. A total of 362 participants specified both their gender and past attendance in counseling. Females’ (n = 199) rate of attendance in counseling was 35% (n = 70) and males’ (n = 163) rate of attendance in counseling was 28% (n = 45). Eleven percent
(n = 45) of participants were attending counseling at the time of data collection.
A factorial 2 (gender) X 2 (attendance in counseling) X 2 (ethnicity) MANOVA was computed to examine demographic differences in participants’ sensitivity to barriers to counseling. All three independent variables had two levels: gender (male or female), attendance in counseling (no previous attendance in counseling or previous attendance in counseling), and ethnicity (White or non-White). Based on the recommendations of Kaneshiro, Geling, Gellert, and Millar (2011), the second level of the ethnicity independent variable, non-White, was aggregated by merging all participants who did not identify as White; this ensured comparable groups for statistical analyses. The dependent variables consisted of respondents’ composite scores on each of the three FSV barriers. Because we were interested in investigating all significant main effects and interaction effects across the univariate and multivariate nature of the data, both MANOVA and follow-up univariate ANOVAs were computed (Field, 2013). Bonferroni corrections were applied to control for the familywise error rate.
A significant main effect emerged for gender: F = (7, 354) = 4.73, p = 0.003, Wilks’ Λ = 0.96, η2p = 0.04. The univariate ANOVAs (see Table 3) revealed significant main effects for all three FSV barriers:
Fit: [F = (7, 354) = 6.26, p = 0.013, η2p = 0.02]; Stigma: [F = (7, 354) = 13.71, p < 0.001, η2p = .04]; and
Value: [F = (7, 354) = 5.52, p = 0.02, η2p = .02]. Males (M = 2.56, M = 2.73, M = 2.60) scored higher than females (M = 2.25, M = 2.24, M = 2.23) on Fit, Stigma, and Value, respectively. A significant multivariate main effect also emerged for attendance in counseling: F = (7, 354) = 3.80, p = 0.01, Wilks’ Λ = 0.97, η2p = 0.031. The univariate ANOVA revealed that participants who had not attended counseling (M = 2.60) scored higher than participants who had attended counseling (M = 2.30) on the Value barrier: F = (7, 354) = 4.65, p = 0.03, η2p = 0.01. There were no other statistically significant main effects or any interaction effects (see Table 3). That is, there were no other significant group differences in respondents’ sensitivity to the FSV barriers by gender, attendance in counseling, or ethnicity.
Discussion
The primary aim of the present study was to validate the revised version of the FSV Scale with adults in the United States. Researchers also investigated the percentage of adults that have attended counseling and examined demographic differences in participants’ sensitivity to barriers to counseling. Frequency analyses revealed that 32% of our sample had attended at least one session of personal counseling, and among those who did, females reported a higher rate of attendance (35%) than males (28%). At the time of data collection, 11% of participants were seeing a counselor. Our findings are largely consistent with previous investigations that suggested 15–38% of adults in the United States had sought counseling at some point in their lives (Hann et al., 2014; University of Phoenix, 2013).
Table 3
Demographic Differences in Sensitivity to Barriers to Counseling
2 (gender) X 2 (attendance in counseling) X 2 (ethnicity) Analysis of Variance
| Independent Variable Barrier |
F |
Sig. |
Partial Eta Squared |
| Gender |
*Fit |
6.26 |
0.01 |
0.02 |
|
|
| **Stigma |
13.71 |
0.00 |
0.04 |
|
|
| *Value |
5.52 |
0.02 |
0.02 |
|
|
| Ethnicity |
Fit |
0.34 |
0.56 |
0.00 |
|
|
| Stigma |
0.00 |
0.96 |
0.00 |
|
|
| Value |
0.11 |
0.74 |
0.00 |
|
|
| Attendance in Counseling |
Fit |
0.69 |
0.41 |
0.00 |
|
|
| Stigma |
0.01 |
0.93 |
0.00 |
|
|
| *Value |
4.65 |
0.03 |
0.01 |
|
|
| Gender X Ethnicity |
Fit |
0.00 |
0.96 |
0.00 |
|
|
| Stigma |
0.12 |
0.73 |
0.00 |
|
|
| Value |
0.14 |
0.71 |
0.01 |
|
|
| Gender X Counseling |
Fit |
1.38 |
0.24 |
0.01 |
|
|
| Stigma |
3.00 |
0.08 |
0.01 |
|
|
| Value |
1.32 |
0.25 |
0.00 |
|
|
| Ethnicity X Counseling |
Fit |
0.07 |
0.79 |
0.00 |
|
|
| Stigma |
0.00 |
0.98 |
0.00 |
|
|
| Value |
0.21 |
0.65 |
0.00 |
|
|
| Gender X Ethnicity X Counseling |
Fit |
0.81 |
0.37 |
0.00 |
|
|
| Stigma |
1.19 |
0.28 |
0.00 |
|
|
| Value |
0.24 |
0.62 |
0.00 |
|
|
df = (1, 354) Note: 0.00 denotes values < 0.01. *Indicates statistical significance at the p < 0.05 level (2-tailed). ** Indicates statistical significance at the p < 0.01 level (2-tailed).
Similar to previous literature on attendance in counseling and congruent with gender theory (Levant, Wimer, & Williams, 2011; Seidler et al., 2017; Vogel, Heimerdinger-Edwards, Hammer, & Hubbard, 2011), we found that males were less likely to seek counseling and were particularly susceptible to the Stigma, Fit, and Value barriers when compared to females. Susceptibility to the Stigma barrier suggests that men might be less likely to attend counseling because of feelings of shame or embarrassment (Cheng, Kwan, & Sevig, 2013; Cheng, Wang, McDermott, Kridel, & Rislin, 2018; J. E. Kim, Saw, & Zane, 2015). Males also reported a higher sensitivity to the Fit and Value barriers as compared to women, suggesting they might place less worth on the anticipated benefits of counseling, and if they were to enter counseling, they may be particularly concerned about finding a counselor with whom they are compatible. It is possible that men’s sensitivity to all FSV barriers may simply be related to their underutilization of counseling services when compared to women, although other explanations also might be plausible.
Consistent with Kalkbrenner et al. (in press), we found that independent of gender, participants who had not attended at least one session of personal counseling placed less value on its potential benefits as compared to those who had attended counseling. This finding suggests that to some extent, attendance in personal counseling might moderate the aforementioned gender differences in participants’ sensitivity to the Value barrier. It is possible that attendance in counseling accounts for a more meaningful amount of the variance in sensitivity to the Value barrier to counseling than gender. Also, consistent with the findings of Kalkbrenner et al. (in press) and Kalkbrenner and Neukrug (2018), we found psychometric support for the factorial validity of the revised version of the FSV scale. Similar to these previous investigations (Kalkbrenner & Neukrug, 2018; Kalkbrenner et al., in press), tests of internal consistency revealed strong reliability coefficients for all three FSV scales. The findings of the present investigators add to the growing body of literature on Fit, Stigma, and Value as three primary barriers to seeking counseling among a variety of populations, including human services professionals (Neukrug et al., 2017), professional counselors (Kalkbrenner et al., in press), counselor trainees (Kalkbrenner & Neukrug, 2018), and now with members of the general U.S. population.
An investigation of the path model coefficients (see Figure 1) revealed moderate to strong associations between the FSV barriers, higher compared to past investigations (Kalkbrenner & Neukrug, 2018; Kalkbrenner et al., in press). A follow-up CFA was computed to test if a single-factor model (aggregated FSV barriers into a single scale) was a better factor solution for the data. However, the follow-up CFA revealed poor model fit for the single factor solution, suggesting that Fit, Stigma, and Value comprise three separate dimensions of a related construct. The differences in the strength of association between the FSV scales in the present study and in the studies by Kalkbrenner et al. (in press) and Kalkbrenner and Neukrug (2018) might be explained by differences between the samples. These investigators validated the FSV barriers with populations of professional counselors and counseling students. It is possible that professional counselors and counseling students were better able to discriminate between different types of barriers to counseling compared to members of the general U.S. population because of the clinical nature of their training. In addition, minor discrepancies are expected in any psychometric study in which authors are attempting to confirm the dimensionality of an attitudinal measure with a new sample (Hendrick, Fischer, Tobi, & Frewer, 2013).
To summarize, the results of internal consistency reliability and CFA indicated that the Revised FSV Scale and its dimensions were estimated adequately with a stratified random sample of adults in the United States. We found close to one-third of our sample had attended counseling, 11% were in counseling at the time of data collection, and there were demographic differences in participants’ sensitivity to barriers to counseling by gender and past attendance in counseling. A number of implications for enhancing counseling practice have emerged from these findings.
Implications for Counseling Practice
With 20% of individuals in the general U.S. population living with a mental disorder, 11% in counseling, 32% having attended counseling, and others wanting counseling but wary of attending, counselors, counseling programs, and counseling organizations can all play a part in reducing the barriers that the public faces when deciding whether or not they should attend counseling. Professional counselors can become leaders in reducing barriers to attending counseling among the general U.S. population through outreach and advocacy. The implications of the following strategies for outreach and advocacy are discussed in the subsequent sub-sections: connecting prospective clients with counselors, interprofessional communication, mobile health, and reducing stigma toward seeking counseling.
Connecting Prospective Clients With Counselors
Nationally, counseling organizations can operate campaigns aimed at reducing the stigma associated with counseling and speaking to its value. The National Board for Certified Counselors (NBCC) advocates for the development and implementation of grassroots community mental health approaches for supporting the accessibility of mental health services on both national and international levels (Hinkle, 2014). Like NBCC, other professional organizations (e.g., ACA and the American Mental Health Counselors Association) might include a directory of professional counselors on their website, along with their specialty areas, who work in a variety of geographic locations to help connect prospective clients with services. On a local level, it is recommended that professional counselors engage in outreach with members of their community to identify the potential unique mental health needs of people in their community and learn about potential barriers to counseling in their local area. Specifically, professional counselors can attend town board meetings and other public events to briefly introduce themselves and use their active listening skills to better understand the needs of the local community. The Revised FSV Scale is one potential tool that professional counselors might use when engaging in outreach with members of their community to gain a better understanding about local barriers to counseling.
We found that participants who had previously attended at least one session of personal counseling reported a higher perceived value of the benefits of counseling compared to those who did not attend counseling. It is possible that individuals’ attendance in counseling is related to their attributing a higher value to the anticipated benefits of counseling. Thus, we suggest community mental health counselors consider offering one free counseling session to promote prospective clients’ attendance in counseling. Just one free session might have the benefit of adding value to a client’s perceived worth of the counseling relationship and increase the likelihood of continued attendance in counseling. Offering one free session may be particularly important for men and minorities, who have traditionally attended counseling at lower rates (Hatzenbuehler et al., 2008; Seidler et al., 2017).
Interprofessional Communication
The flourishing of integrated behavioral health and interprofessional practice across the health care system might provide professional counselors with an opportunity to identify and reduce barriers to seeking counseling among the general U.S. population. In particular, integrated behavioral health involves infusing the delivery of physical and mental health care through interprofessional collaborations or teamwork among a variety of different professionals, thus providing a more holistic model for the patient (Johnson, Sparkman-Key, & Kalkbrenner, 2017). Professional counselors can collaborate with primary care physicians and consider the utility of administering the FSV Scale to patients while they are in the waiting room, as the FSV Scale can be accessed electronically via a tablet or smart phone. We recommend that counseling practitioners reach out to local primary care physicians to discuss the utility of integrated behavioral health and make themselves available to physicians for consultation on how to recognize and refer patients to counseling.
Mobile Health (mHealth)
mHealth refers to the delivery of interventions geared toward promoting physical or mental health by means of a cellular phone (Johnson & Kalkbrenner, 2017). Professional counselors can use mHealth to provide prospective clients with a brief overview of counseling, address prominent barriers to counseling faced by students, and provide mental health resources that are available to students. mHealth might be particularly useful for college and school counselors as academic institutions typically have access to students’ cell phone numbers, and students “appear to be open and responsive to the utilization of mHealth” (Johnson & Kalkbrenner, 2017, p. 323). The campus counseling center is underutilized on some college campuses because of stigma (Rosenthal & Wilson, 2016) and students’ unawareness of the services that are available at the counseling center (Dobmeier, Kalkbrenner, Hill, & Hernández, 2013). College counselors might consider using mHealth as a platform for both reducing stigma toward counselor-seeking behavior and for spreading students’ awareness of the services that are available to them for reduced or no fees at the counseling center.
Reducing Stigma Toward Seeking Counseling
Our results are consistent with the body of evidence indicating that when compared to women, men are less likely to attend counseling, more susceptible to barriers to attending counseling, and more likely to terminate counseling early (Levant et al., 2011; Seidler et al., 2017). Consistent with Vogel et al. (2011), we found that stigma was a predominant barrier to counseling among male participants. It is recommended that counseling practitioners focus on normalizing common presenting concerns that men are facing and find venues (e.g., barber shops, sports arenas) where they can reach out to men and lessen their concerns about attending counseling (Neukrug, Britton, & Crews, 2013).
Professional counselors can become leaders in reducing stigma toward help-seeking among men by normalizing common presenting concerns. As one example, the stress, anxiety, and depression men face when given a diagnosis of prostate cancer can potentially be reduced by counselors and their professional associations. By developing ways for the public to understand prostate cancer and its related mental health concerns, counselors and their professional associations can lessen the stigma of the disease. Promoting public awareness also can increase men’s likelihood of talking about a diagnosis of prostate cancer with friends, loved ones, and counselors, in a similar way that a diagnosis of breast cancer has been destigmatized over the past few decades. Professional counselors should consider other strategies that can be utilized to enhance the likelihood for men to attend counseling, such as group counseling or an informal setting.
Limitations and Future Research
Because causal attributions cannot be inferred from a cross-sectional survey research design, future researchers can extend the line of research on the FSV barriers using an experimental design by administering the scale to clients prior to and following attendance in counseling. Results might provide evidence of how counseling lessens one’s sensitivity to some barriers. Consistent with the U.S. Census Bureau (2017), the ethnic identity of the majority of participants in our sample was White. Thus, future research should replicate the present study using a more ethnically diverse sample, especially because individuals who identify with ethnicities other than White tend to seek counseling at lower rates (Hatzenbuehler et al., 2008; Vogel et al., 2011). In addition, despite having used a rigorous stratified random sampling procedure, it is possible that because of the sample size, this sample is not representative of adults in the United States. In addition, self-report bias is a limitation of the present study.
Our findings, coupled with existing findings in the literature (Kalkbrenner & Neukrug, 2018; Kalkbrenner et al., in press), suggest that the psychometric properties of the revised version of the FSV Scale are adequate for appraising barriers to seeking counseling among mental health professionals and adults in the United States. The next step in this line of research is to confirm the 3-factor structure of the FSV Scale with populations that are susceptible to mental health disorders and who might be reticent to seek counseling (e.g., veterans, high school students, non-White populations, and the older adult population; Akanwa, 2015; American Public Health Association, 2014; Bartels et al., 2003). Because we did not place any restrictions on sampling based on prospective participants’ history of mental illness, it is possible that the mean differences between participants’ sensitivity to the FSV barriers were influenced by the extent to which they were living with clinical problems at the time of data collection. Thus, future researchers should validate the FSV barriers with participants who are living with psychiatric conditions. Future researchers might also investigate the extent to which there might be differences in participants’ sensitivity to the FSV barriers based on the amount of time they have been in counseling (e.g., the number of sessions).
Because of the global increase in mental distress (WHO, 2018), future researchers should consider confirming the psychometric properties of the FSV Scale with international populations. In addition, we found that when gender, ethnicity, and previous attendance in counseling were entered into the MANOVA as independent variables, significant differences in the Value barrier only emerged for attendance in counseling. Therefore, previous attendance in counseling might account for a more substantial portion of the variance in barriers to counseling than gender and ethnicity. Future researchers can test this hypothesis using a path analysis.
Summary and Conclusion
Attendance in counseling among members of the general U.S. population has become increasingly important because of the frequency and complexity of mental disorders within the U.S. and global populations (WHO, 2017). The primary aim of the present study was to test the psychometric properties of the Revised FSV Scale, a questionnaire for measuring barriers to counseling using a stratified random sample of U.S. adults. The results of a CFA indicated that the Revised FSV Scale and its dimensions were estimated adequately with a stratified random sample of adults in the United States. The appraisal of barriers to seeking counseling is an essential first step in understanding why prospective clients do or do not seek counseling. At this stage of development, the Revised FSV Scale appears to have utility for screening sensitivity to three primary barriers (Fit, Stigma, and Value) to seeking counseling among mental health professionals and adults in the United States. Further, the Revised FSV Scale can be used tentatively by counseling practitioners who work in a variety of settings as one way to measure and potentially reduce barriers associated with counseling among prospective clients.
Conflict of Interest and Funding Disclosure
The authors reported no conflict of interest or funding contributions for the development of this manuscript.
References
Abrams, A. (2014). Women more likely than men to seek mental health help, study finds. TIME Health. Retrieved from
http://time.com/2928046/mental-health-services-women/
Akanwa, E. E. (2015). International students in Western developed countries: History, challenges, and
prospects. Journal of International Students, 5, 271–284.
American Counseling Association. (2010). 20/20: Consensus definition of counseling. Retrieved from https://www.counseling.org/knowledge-center/20-20-a-vision-for-the-future-of-counseling/consensus-definition-of-counseling
American Psychiatric Association. (2013). Diagnostic and statistical manual of mental disorders (5th ed.). Washington, DC: Author.
American Public Health Association. (2014). Removing barriers to mental health services for veterans. Retrieved from https://www.apha.org/policies-and-advocacy/public-health-policy-statements/policy-database/2015/01/28/14/51/removing-barriers-to-mental-health-services-for-veterans
Bartels, S. J., Dums, A. R., Oxman, T. E., Schneider, L. S., Areán, P. A., Alexopoulos, G. S., & Jeste, D. V. (2003). Evidence-based practices in geriatric mental health care: An overview of systematic reviews and meta-analyses. Psychiatric Clinics of North America, 26, 971–990, x–xi. doi:10.1016/S0193-953X(03)00072-8
Byrne, B. M. (2016). Structural equation modeling with AMOS: Basic concepts, applications, and programming (3rd ed.). New York, NY: Routledge.
Centers for Disease Control and Prevention. (2018). Learn about mental health. Retrieved from https://www.cdc.gov/mentalhealth/learn/index.htm
Cheng, H.-L., Kwan, K.-L. K., & Sevig, T. (2013). Racial and ethnic minority college students’ stigma associated with seeking psychological help: Examining psychocultural correlates. Journal of Counseling Psychology, 60, 98–111. doi:10.1037/a0031169
Cheng, H.-L., Wang, C., McDermott, R. C., Kridel, M., & Rislin, J. L. (2018). Self-stigma, mental health literacy, and attitudes toward seeking psychological help. Journal of Counseling & Development, 96, 64–74. doi:10.1002/jcad.12178
Cohen, J. E. (1988). Statistical power analysis for the behavioral sciences. Hillsdale, NJ: Lawrence Erlbaum Associates, Inc.
Dobmeier, R. A., Kalkbrenner, M. T., Hill, T. L., & Hernández, T. J. (2013). Residential community college student awareness of mental health problems and resources. New York Journal of Student Affairs, 13(2), 15–28.
Faul, F., Erdfelder, E., Lang, A.-G., & Buchner, A. (2007). G*Power 3: A flexible statistical power analysis program for the social, behavioral, and biomedical sciences. Behavior Research Methods, 39, 175–191.
Field, A. (2013). Discovering statistics using IBM SPSS Statistics (4th ed.). Thousand Oaks, CA: Sage.
Han, B., Hedden, S. L., Lipari, R., Copello, E. A. P., & Kroutil, L. A. (2014). Receipt of services for behavioral health problems: Results from the 2014 National Survey on Drug Use and Health. Retrieved from https://www.samh sa.gov/data/sites/default/files/NSDUH-DR-FRR3-2014/NSDUH-DR-FRR3-2014/NSDUH-DR-FRR3-2014.htm
Hatzenbuehler, M. L., Keyes, K. M., Narrow, W. E., Grant, B. F., &, Hasin, D. S. (2008). Racial/ethnic disparities in service utilization for individuals with co-occurring mental health and substance use disorders in the general population: Results from the National Epidemiologic Survey on Alcohol and Related Conditions. The Journal of Clinical Psychiatry, 69, 1112–1121.
Hendrick, T. A. M., Fischer, A. R. H., Tobi, H., & Frewer, L. J. (2013). Self-reported attitude scales: Current practice in adequate assessment of reliability, validity, and dimensionality. Journal of Applied Social Psychology, 43, 1538–1552. doi:10.1111/jasp.12147
Hinkle, J. S. (2014). Population-based mental health facilitation (MHF): A grassroots strategy that works. The Professional Counselor, 4, 1–18. doi:10.15241/jsh.4.1.1
Johnson, K. F., & Kalkbrenner, M. T. (2017). The utilization of technological innovations to support college student mental health: Mobile health communication. Journal of Technology in Human Services, 35(4), 1–26. doi:10.1080/15228835.2017.1368428
Johnson, K. F., Sparkman-Key, N., & Kalkbrenner, M. T. (2017). Human service students’ and professionals’ knowledge and experiences of interprofessionalism: Implications for education. Journal of Human Services, 37, 5–13.
Kalkbrenner, M. T., & Neukrug, E. S. (2018). A confirmatory factor analysis of the Revised FSV Scale with counselor trainees. Manuscript submitted for publication.
Kalkbrenner, M. T., Neukrug, E. S., & Griffith, S. A. (in press). Barriers to counselors seeking counseling: Cross validation and predictive validity of the Fit, Stigma, & Value (FSV) Scale. Journal of Mental Health Counseling.
Kaneshiro, B., Geling, O., Gellert, K., & Millar, L. (2011). The challenges of collecting data on race and ethnicity in a diverse, multiethnic state. Hawai’i Medical Journal, 70(8), 168–171.
Kim, J. (2017, January 30). Why I think all men need therapy: A good read for women too. Psychology Today. Retrieved from https://www.psychologytoday.com/us/blog/the-angry-therapist/201701/why-i-think-all-men-need-therapy
Kim, J. E., Saw, A., & Zane, N. (2015). The influence of psychological symptoms on mental health literacy of college students. American Journal of Orthopsychiatry, 85, 620–630. doi:10.1037/ort0000074
Levant, R. F., Wimer, D. J., & Williams, C. M. (2011). An evaluation of the Health Behavior Inventory-20 (HBI-20) and its relationship to masculinity and attitudes towards seeking psychological help among college men. Psychology of Men & Masculinity, 12, 26–41. doi:10.1037/a0021014
Lindinger-Sternart, S. (2015). Help-seeking behaviors of men for mental health and the impact of diverse cultural backgrounds. International Journal of Social Science Studies, 3, 1–6. doi:10.11114/ijsss.v3i1.519
Lumina Foundation. (2017). A stronger nation: Learning beyond high schools builds American talent. Retrieved from http://strongernation.luminafoundation.org/report/2018/#nation
Mvududu, N. H., & Sink, C. A. (2013). Factor analysis in counseling research and practice. Counseling Outcome Research and Evaluation, 4(2), 75–98. doi:10.1177/2150137813494766
National Institute of Mental Health. (2017). Mental Illnesses. Retrieved from https://www.nimh.nih.gov/health/statistics/mental-illness.shtml#part_154787
Neukrug, E., Britton, B. S., & Crews, R. C. (2013). Common health-related concerns of men: Implications for counselors. Journal of Counseling & Development, 91, 390–397. doi:10.1002/j.1556-6676.2013.00109
Neukrug, E., Kalkbrenner, M. T., & Griffith, S. A. (2017). Barriers to counseling among human service professionals: The development and validation of the Fit, Stigma, & Value Scale. Journal of Human Services, 37, 27–40.
Norcross, A. E. (2010). A case for personal therapy in counselor education. Counseling Today, 53(2), 40–42.
Parent, M. C., Hammer, J. H., Bradstreet, T. C., Schwartz, E. N., & Jobe, T. (2018). Men’s mental health help-seeking behaviors: An intersectional analysis. American Journal of Men’s Health, 12, 64–73. doi:10.1177/1557988315625776
Qualtrics [Online survey platform software]. (2018). Provo, UT. Retrieved from https://www.qualtrics.com/
Qualtrics Sample Services [Online sampling service service]. (2018). Provo, UT. Retrieved from https://www.qualtrics.com/online-sample/
Rosenthal, B. S., & Wilson, W. C. (2016). Psychosocial dynamics of college students’ use of mental health services. Journal of College Counseling, 19(3), 194–204. doi:10.1002/jocc.12043
Seidler, Z. E., Rice, S. M., River, J., Oliffe, J. L., & Dhillon, H. M. (2017). Men’s mental health services: The case for a masculinities model. Journal of Men’s Studies, 25, 92–104. doi:10.1177/1060826517729406
Twenge, J. M., Joiner, T. E., Rogers, M. L., & Martin, G. N. (2017). Increases in depressive symptoms, suicide-related outcomes, and suicide rates among U.S. adolescents after 2010 and links to increased new media screen time. Clinical Psychological Science, Advanced online publication. doi:10.1177/2167702617723376
University of Phoenix. (2013). University of Phoenix survey reveals 38 percent of individuals who seek mental health counseling experience barriers. Retrieved from http://www.phoenix.edu/news/releases/2013/05/university-of-phoenix-survey-reveals-38-percent-of-individuals-who-seek-mental-health-counseling-experience-barriers.html
U.S. Census Bureau. (2017). Population estimates, July 1, 2017. Retrieved from https://www.census.gov/quick facts/fact/table/US/PST045216
Vogel, D. L., Heimerdinger-Edwards, S. R., Hammer, J. H., & Hubbard, A. (2011). “Boys don’t cry”: Examination of the links between endorsement of masculine norms, self-stigma, and help-seeking attitudes for men from diverse backgrounds. Journal of Counseling Psychology, 58, 368–382.
doi:10.1037/a0023688
Whitfield, N., & Kanter, D. (2014). Helpers in distress: Preventing secondary trauma. Reclaiming Children and Youth, 22(4), 59–61.
World Health Organization. (2015). Global health workforce, finances remain low for mental health. Retrieved from http://www.who.int/mediacentre/news/notes/2015/finances-mental-health/en/
World Health Organization. (2017). World mental health day, 2017: Mental health in the workplace. Retrieved from http://www.who.int/mental_health/world-mental-health-day/2017/en/
World Health Organization. (2018). World health report: Mental disorders affect one in four people. Retrieved from http://www.who.int/whr/2001/media_centre/press_release/en/