Aug 20, 2021 | Volume 11 - Issue 3
Michael T. Kalkbrenner
Assessment literacy is an essential competency area for professional counselors who administer tests and interpret the results of participants’ scores. Using factor analysis to demonstrate internal structure validity of test scores is a key element of assessment literacy. The underuse of psychometrically sound instrumentation in professional counseling is alarming, as a careful review and critique of the internal structure of test scores is vital for ensuring the integrity of clients’ results. A professional counselor’s utilization of instrumentation without evidence of the internal structure validity of scores can have a number of negative consequences for their clients, including misdiagnoses and inappropriate treatment planning. The extant literature includes a series of articles on the major types and extensions of factor analysis, including exploratory factor analysis, confirmatory factor analysis (CFA), higher-order CFA, and multiple-group CFA. However, reading multiple psychometric articles can be overwhelming for professional counselors who are looking for comparative guidelines to evaluate the validity evidence of scores on instruments before administering them to clients. This article provides an overview for the layperson of the major types and extensions of factor analysis and can serve as reference for professional counselors who work in clinical, research, and educational settings.
Keywords: Factor analysis, overview, professional counseling, internal structure, validity
Professional counselors have a duty to ensure the veracity of tests before interpreting the results of clients’ scores because clients rely on their counselors to administer and interpret the results of tests that accurately represent their lived experience (American Educational Research Association [AERA] et al., 2014; National Board for Certified Counselors [NBCC], 2016). Internal structure validity of test scores is a key assessment literacy area and involves the extent to which the test items cluster together and represent the intended construct of measurement.
Factor analysis is a method for testing the internal structure of scores on instruments in professional counseling (Kalkbrenner, 2021b; Mvududu & Sink, 2013). The rigor of quantitative research, including psychometrics, has been identified as a weakness of the discipline, and instrumentation with sound psychometric evidence is underutilized by professional counselors (Castillo, 2020; C.-C. Chen et al., 2020; Mvududu & Sink, 2013; Tate et al., 2014). As a result, there is an imperative need for assessment literacy resources in the professional counseling literature, as assessment literacy is a critical competency for professional counselors who work in clinical, research, and educational settings alike.
Assessment Literacy in Professional Counseling
Assessment literacy is a crucial proficiency area for professional counselors, as counselors in a variety of the specialty areas of the Council for Accreditation of Counseling and Related Educational Programs (2015), such as clinical rehabilitation (5.D.1.g. & 5.D.3.a.), clinical mental health (5.C.1.e. & 5.C.3.a.), and addiction (5.A.1.f. & 5.A.3.a.), select and administer tests to clients and use the results to inform diagnosis and treatment planning, and to evaluate the utility of clinical interventions (Mvududu & Sink, 2013; NBCC, 2016; Neukrug & Fawcett, 2015). The extant literature includes a series of articles on factor analysis, including exploratory factor analysis (EFA; Watson, 2017), confirmatory factor analysis (CFA; Lewis, 2017), higher-order CFA (Credé & Harms, 2015), and multiple-group CFA (Dimitrov, 2010). However, reading several articles on factor analysis is likely to overwhelm professional counselors who are looking for a desk reference and/or comparative guidelines to evaluate the validity evidence of scores on instruments before administering them to clients. To these ends, professional counselors need a single resource (“one-stop shop”) that provides a brief and practical overview of factor analysis. The primary purpose of this manuscript is to provide an overview for the layperson of the major types and extensions of factor analysis that counselors can use as a desk reference.
Construct Validity and Internal Structure
Construct validity, the degree to which a test measures its intended theoretical trait, is a foundation of assessment literacy for demonstrating validity evidence of test scores (Bandalos & Finney, 2019). Internal structure validity, more specifically, is an essential aspect of construct validity and assessment literacy. Internal structure validity is vital for determining the extent to which items on a test combine to represent the construct of measurement (Bandalos & Finney, 2019). Factor analysis is a key method for testing the internal structure of scores on instruments in professional counseling as well as in social sciences research in general (Bandalos & Finney, 2019; Kalkbrenner, 2021b; Mvududu & Sink, 2013). In the following sections, I will provide a practical overview of the two primary methodologies of factor analysis (EFA and CFA) as well as the two main extensions of CFA (higher-order CFA and multiple-group CFA). These factor analytic techniques are particularly important elements of assessment literacy for professional counselors, as they are among the most common psychometric analyses used to validate scores on psychological screening tools (Kalkbrenner, 2021b). Readers might find it helpful to refer to Figure 1 before reading further to become familiar with some common psychometric terms that are discussed in this article and terms that also tend to appear in the measurement literature.
Figure 1
Technical and Layperson’s Definitions of Common Psychometric Terms
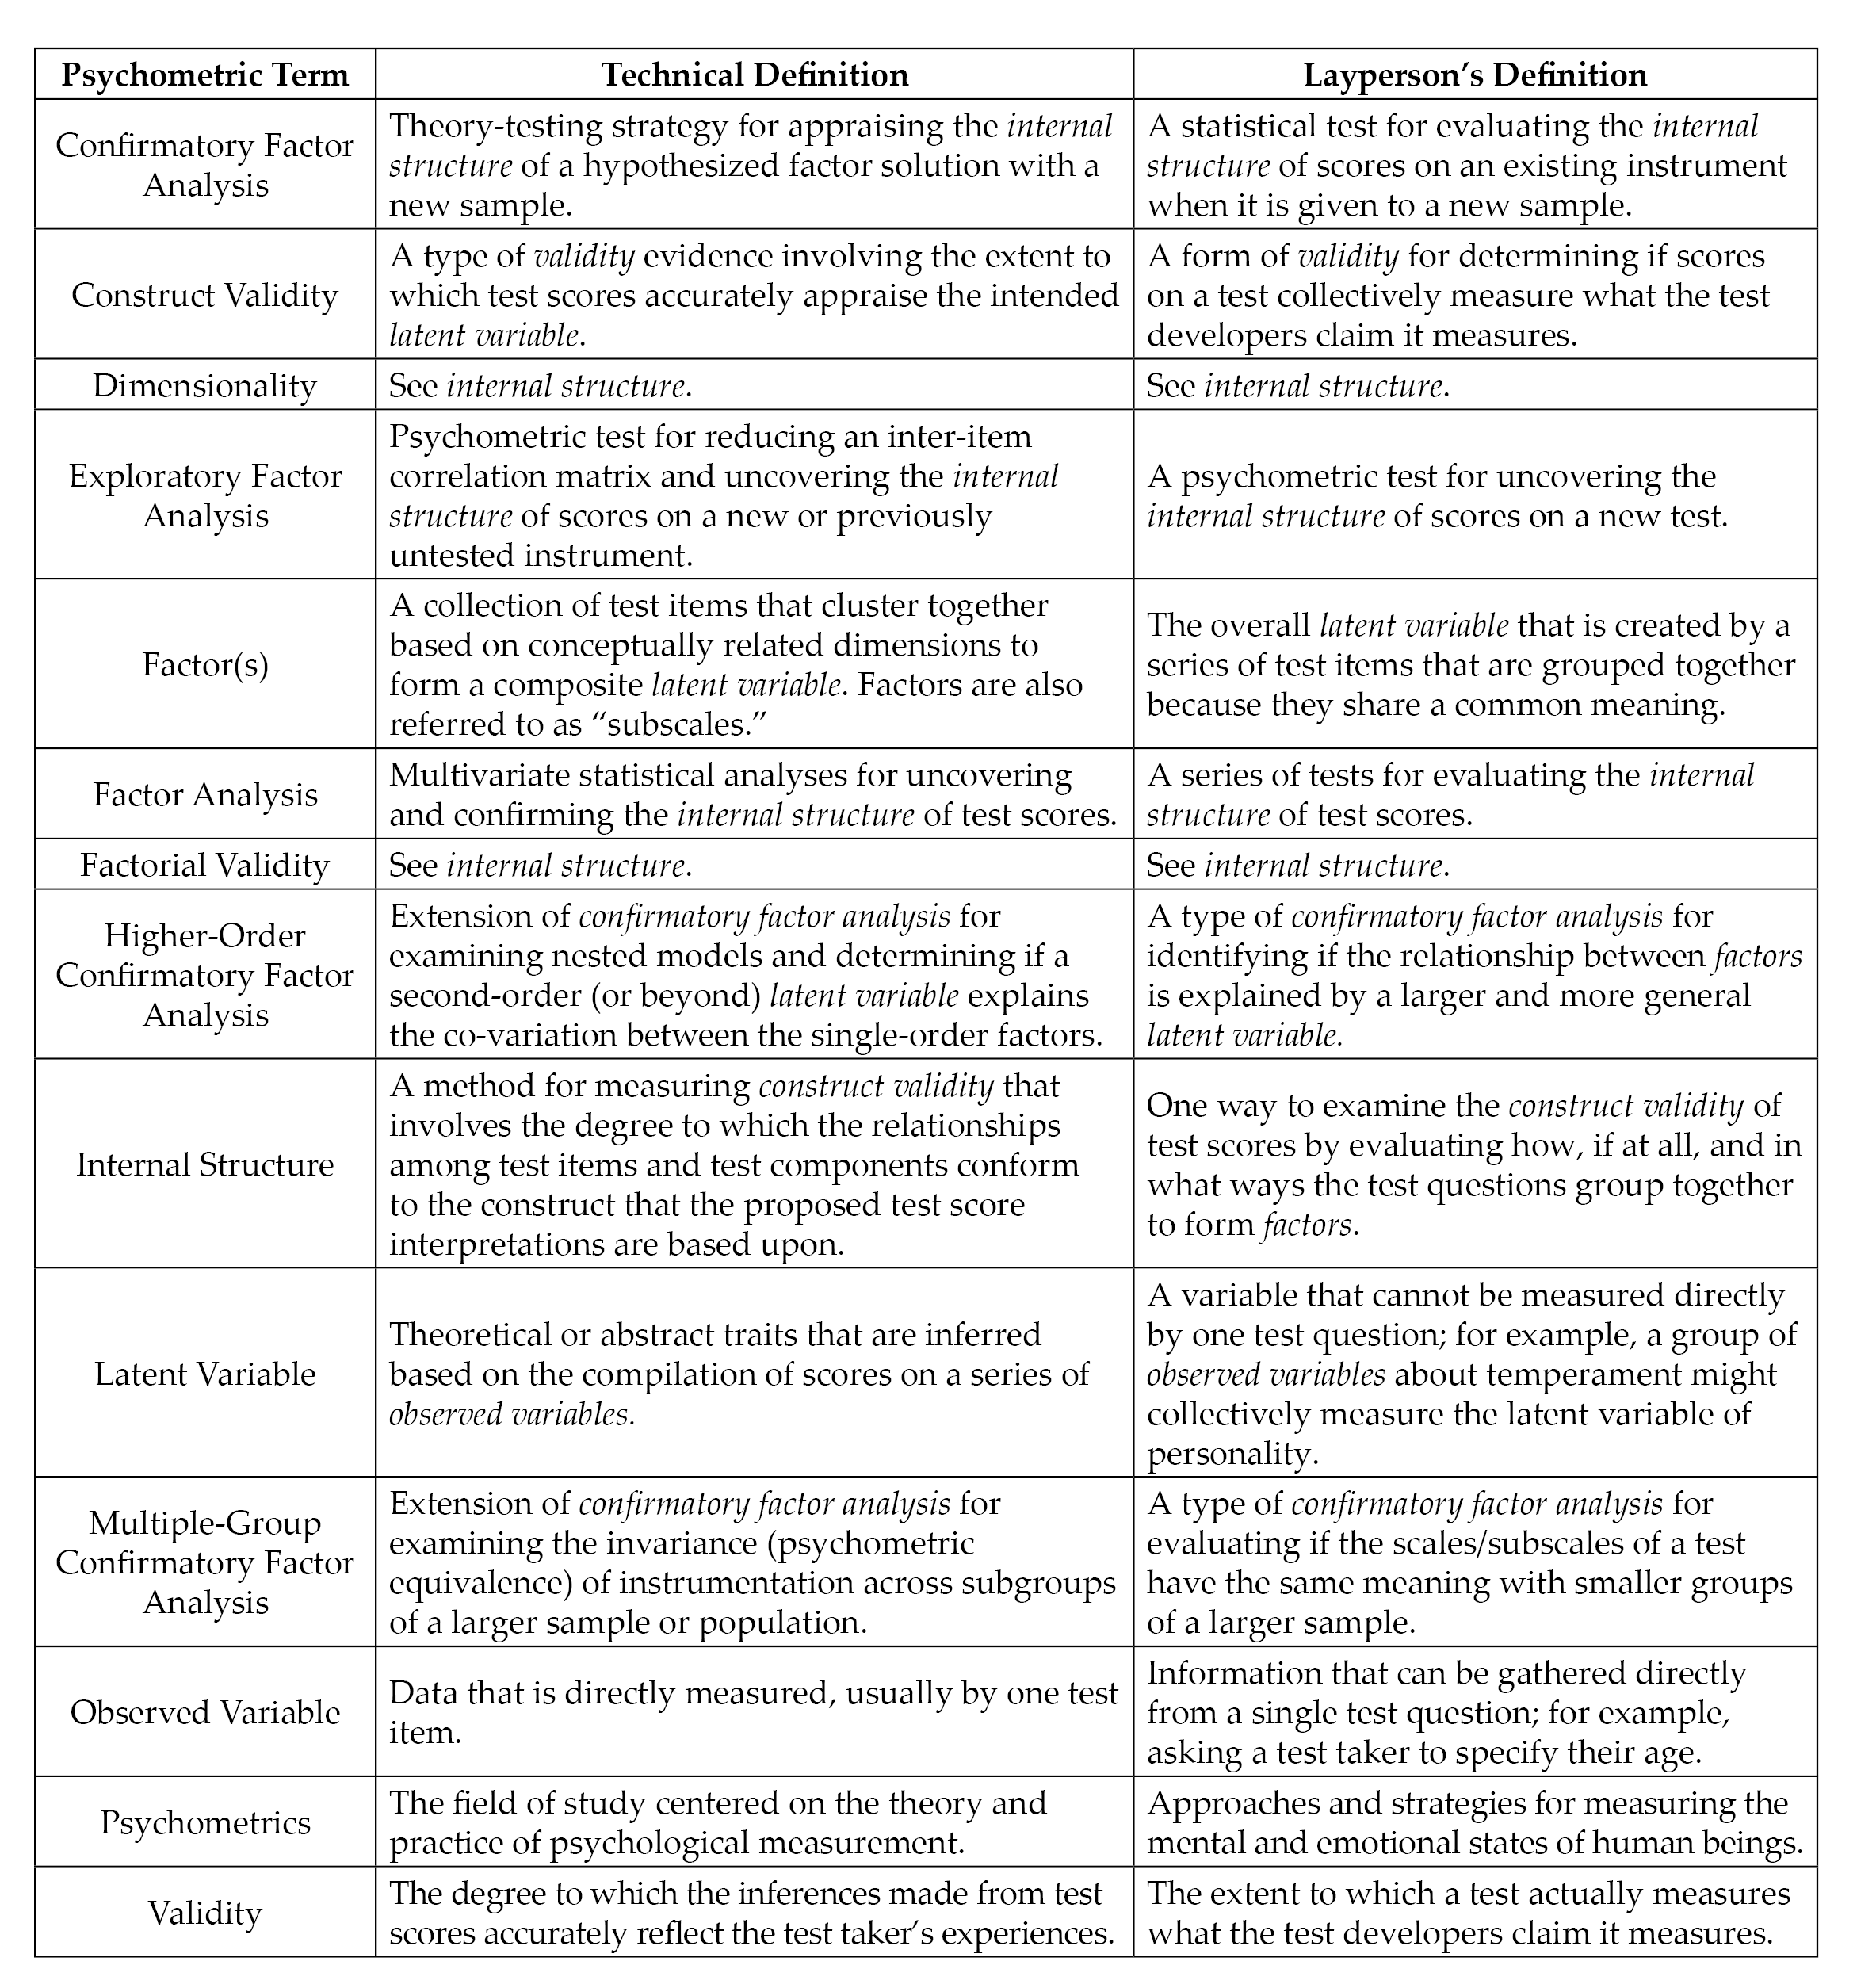 Note. Italicized terms are defined in this figure.
Exploratory Factor Analysis
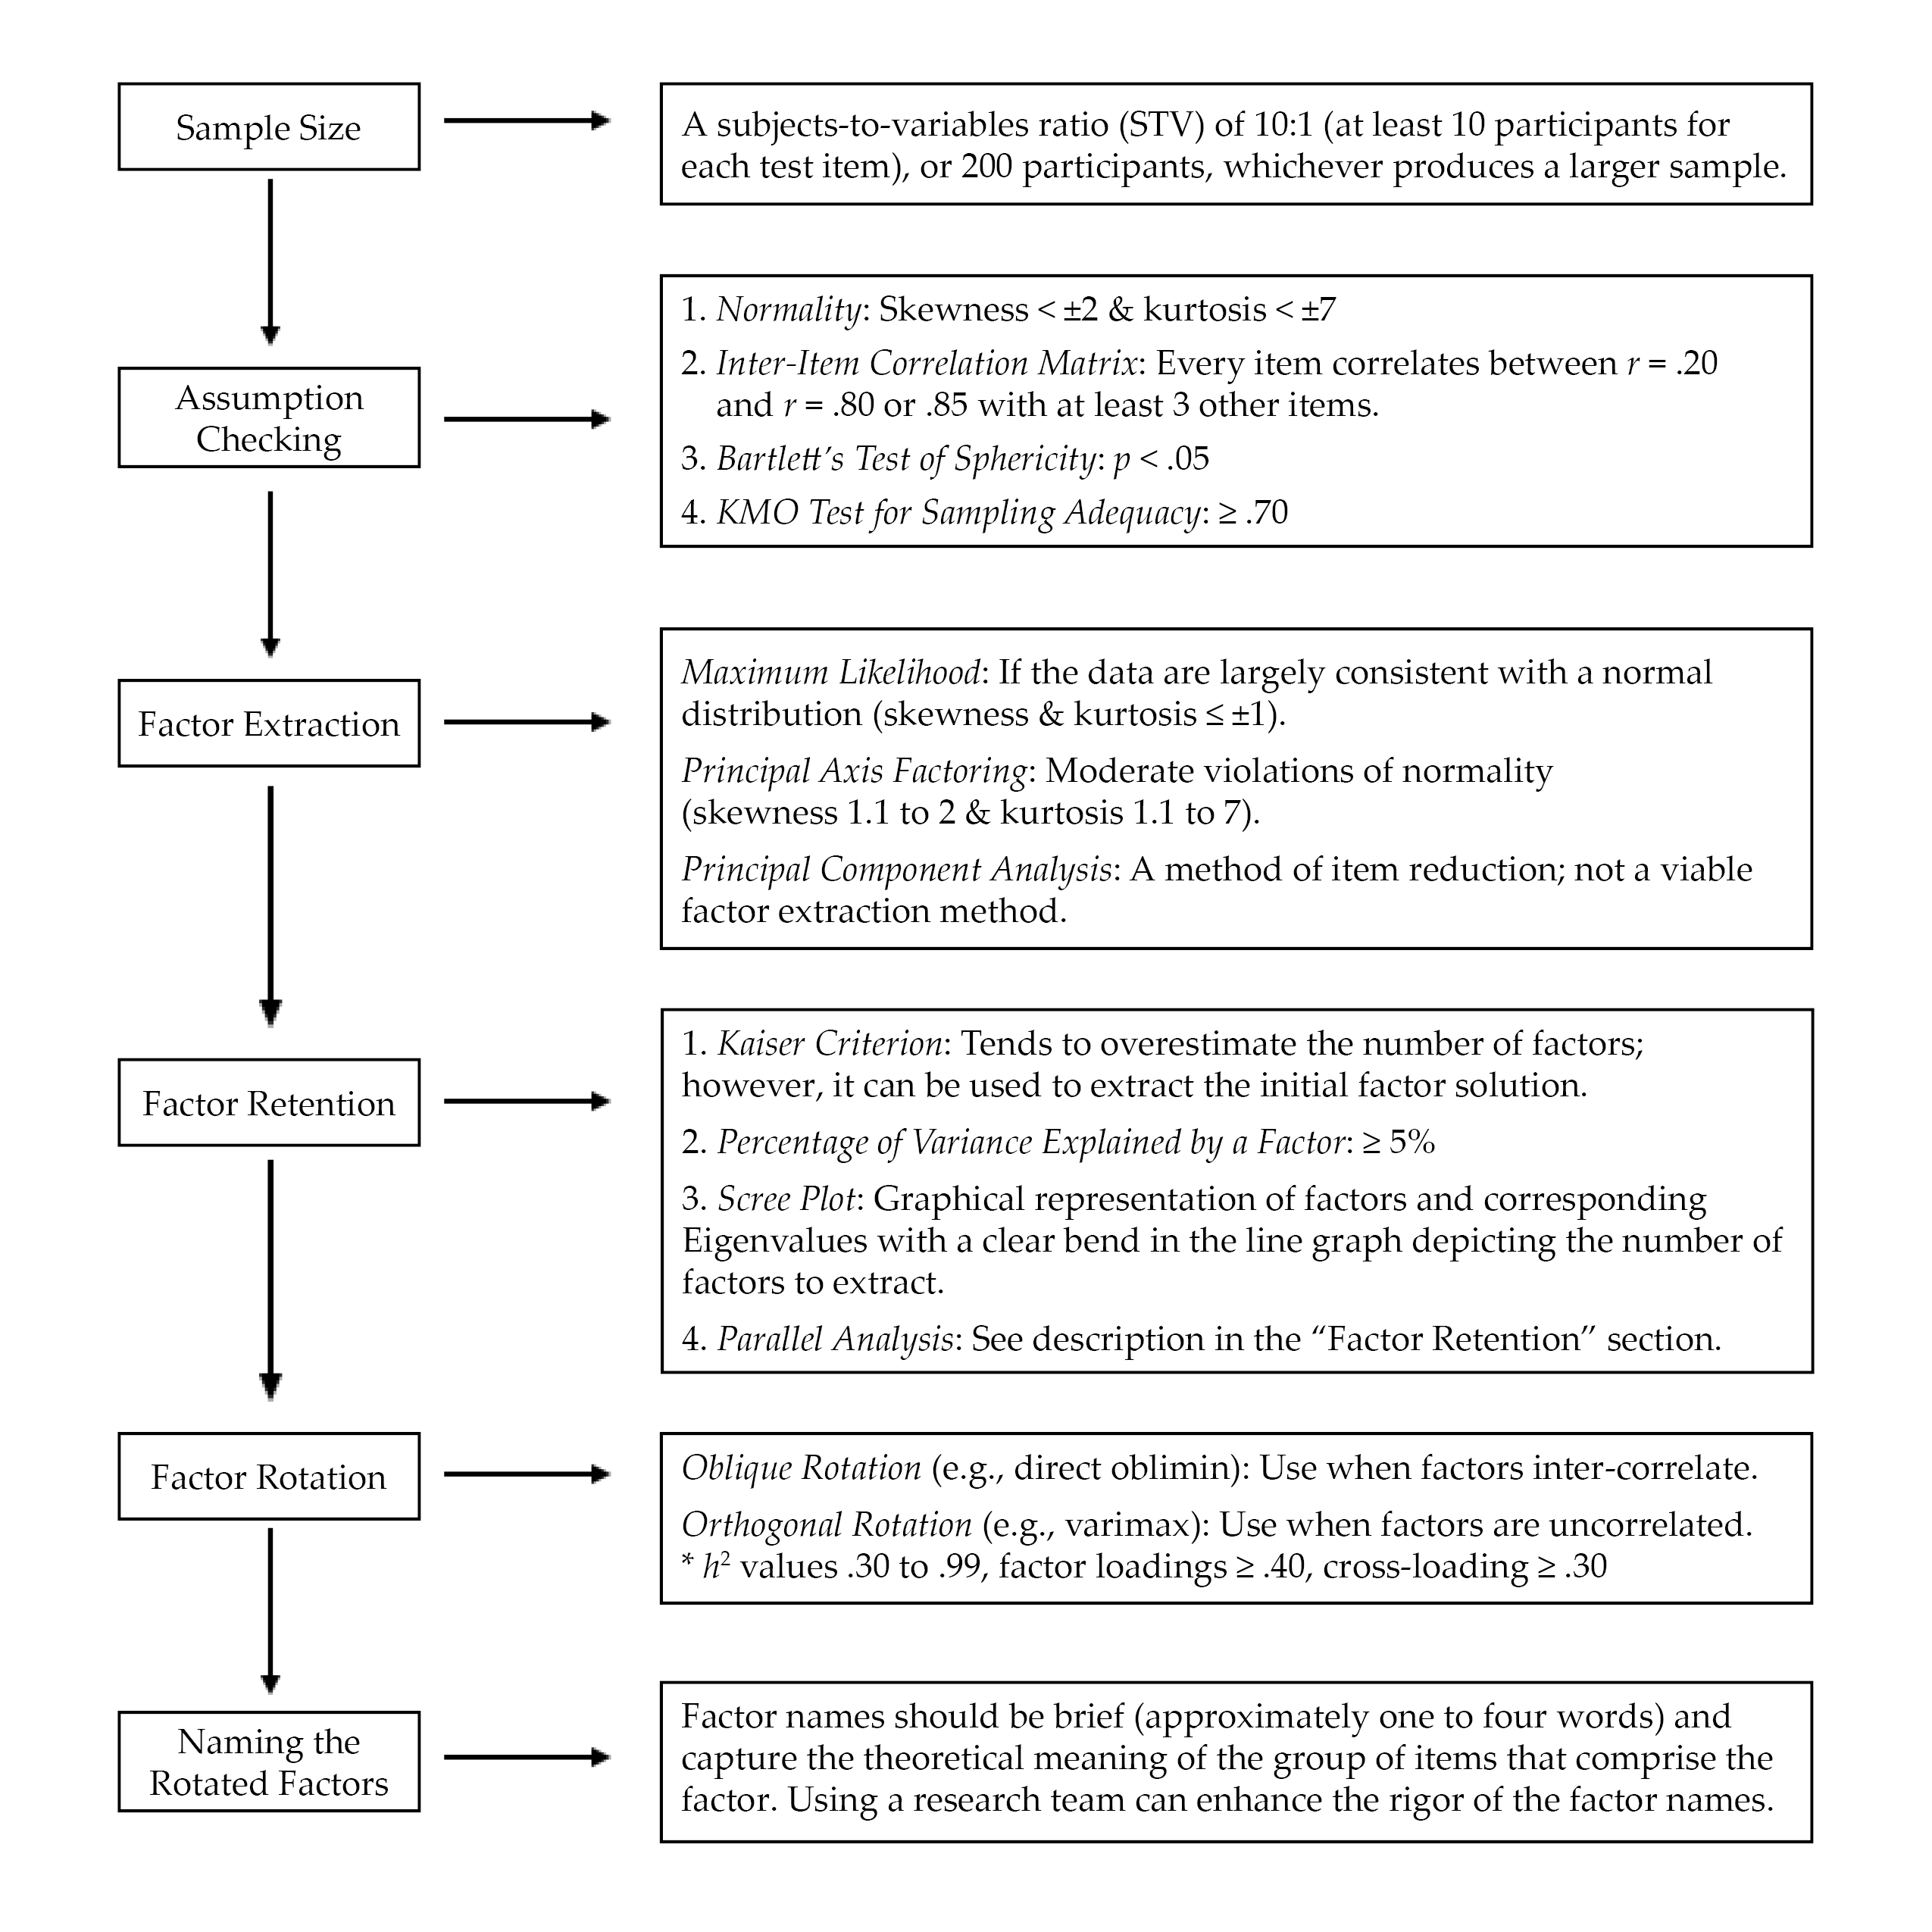
EFA is “exploratory” in that the analysis reveals how, if at all, test items band together to form factors or subscales (Mvududu & Sink, 2013; Watson, 2017). EFA has utility for testing the factor structure (i.e., how the test items group together to form one or more scales) for newly developed or untested instruments. When evaluating the rigor of EFA in an existing psychometric study or conducting an EFA firsthand, counselors should consider sample size, assumption checking, preliminary testing, factor extraction, factor retention, factor rotation, and naming rotated factors (see Figure 2).
EFA: Sample Size, Assumption Checking, and Preliminary Testing
Researchers should carefully select the minimum sample size for EFA before initiating data collection (Mvududu & Sink, 2013). My 2021 study (Kalkbrenner, 2021b) recommended that the minimal a priori sample size for EFA include either a subjects-to-variables ratio (STV) of 10:1 (at least 10 participants for each test item) or 200 participants, whichever produces a larger sample. EFA tends to be robust to moderate violations of normality; however, results are enriched if data are normally distributed (Mvududu & Sink, 2013). A review of skewness and kurtosis values is one way to test for univariate normality; according to Dimitrov (2012), extreme deviations from normality include skewness values > ±2 and kurtosis > ±7; however, ideally these values are ≤ ±1 (Mvududu & Sink, 2013). The Shapiro-Wilk and Kolmogorov-Smirnov tests can also be computed to test for normality, with non-significant p-values indicating that the parametric properties of the data are not statistically different from a normal distribution (Field, 2018); however, the Shapiro-Wilk and Kolmogorov-Smirnov tests are sensitive to large sample sizes and should be interpreted cautiously. In addition, the data should be tested for linearity (Mvududu & Sink, 2013). Furthermore, extreme univariate and multivariate outliers must be identified and dealt with (i.e., removed, transformed, or winsorized; see Field, 2018) before a researcher can proceed with factor analysis. Univariate outliers can be identified via z-scores (> 3.29), box plots, or scatter plots, and multivariate outliers can be discovered by computing Mahalanobis distance (see Field, 2018).
Figure 2
Flow Chart for Reviewing Exploratory Factor Analysis
Three preliminary tests are necessary to determine if data are factorable, including (a) an inter-item correlation matrix, (b) the Kaiser–Meyer–Olkin (KMO) test for sampling adequacy, and (c) Bartlett’s test of sphericity (Beavers et al., 2013; Mvududu & Sink, 2013; Watson, 2017). The purpose of computing an inter-item correlation matrix is to identify redundant items (highly correlated) and individual items that do not fit with any of the other items (weakly correlated). An inter-item correlation matrix is factorable if a number of correlation coefficients for each item are between approximately r = .20 and r = .80 or .85 (Mvududu & Sink, 2013; Watson, 2017). Generally, a factor or subscale should be composed of at least three items (Mvududu & Sink, 2013); thus, an item should display intercorrelations between r = .20 and r = .80/.85 with at least three other items. However, inter-item correlations in this range with five to 10+ items are desirable (depending on the total number of items in the inter-item correlation matrix).
Bartlett’s test of sphericity is computed to test if the inter-item correlation matrix is an identity matrix, in which the correlations between the items is zero (Mvududu & Sink, 2013). An identity matrix is completely unfactorable (Mvududu & Sink, 2013); thus, desirable findings are a significant p-value, indicating that the correlation matrix is significantly different from an identity matrix. Finally, before proceeding with EFA, researchers should compute the KMO test for sampling adequacy, which is a measure of the shared variance among the items in the correlation matrix (Watson, 2017). Kaiser (1974) suggested the following guidelines for interpreting KMO values: “in the .90s – marvelous, in the .80s – meritorious, in the .70s – middling, in the .60s – mediocre, in the .50s – miserable, below .50 – unacceptable” (p. 35).
Factor Extraction Methods
Factor extraction produces a factor solution by dividing up shared variance (also known as common variance) between each test item from its unique variance, or variance that is not shared with any other variables, and error variance, or variation in an item that cannot be accounted for by the factor solution (Mvududu & Sink, 2013). Historically, principal component analysis (PCA) was the dominant factor extraction method used in social sciences research. PCA, however, is now considered a method of data reduction rather than an approach to factor analysis because PCA extracts all of the variance (shared, unique, and error) in the model. Thus, although PCA can reduce the number of items in an inter-item correlation matrix, one cannot be sure if the factor solution is held together by shared variance (a potential theoretical model) or just by random error variance.
More contemporary factor extraction methods that only extract shared variance—for example, principal axis factoring (PAF) and maximum likelihood (ML) estimation methods—are generally recommended for EFA (Mvududu & Sink, 2013). PAF has utility if the data violate the assumption of normality, as PAF is robust to modest violations of normality (Mvududu & Sink, 2013). If, however, data are largely consistent with a normal distribution (skewness and kurtosis values ≤ ±1), researchers should consider using the ML extraction method. ML is advantageous, as it computes the likelihood that the inter-item correlation matrix was acquired from a population in which the extracted factor solution is a derivative of the scores on the items (Watson, 2017).
Factor Retention. Once a factor extraction method is deployed, psychometric researchers are tasked with retaining the most parsimonious (simple) factor solution (Watson, 2017), as the purpose of factor analysis is to account for the maximum proportion of variance (ideally, 50%–75%+) in an inter-item correlation matrix while retaining the fewest possible number of items and factors (Mvududu & Sink, 2013). Four of the most commonly used criteria for determining the appropriate number of factors to retain in social sciences research include the (a) Kaiser criterion, (b) percentage of variance among items explained by each factor, (c) scree plot, and (d) parallel analysis (Mvududu & Sink, 2013; Watson, 2017). Kaiser’s criterion is a standard for retaining factors with Eigenvalues (EV) ≥ 1. An EV represents the proportion of variance that is explained by each factor in relation to the total amount of variance in the factor matrix.
The Kaiser criterion tends to overestimate the number of retainable factors; however, this criterion can be used to extract an initial factor solution (i.e., when computing the EFA for the first time). Interpreting the percentage of variance among items explained by each factor is another factor retention criterion based on the notion that a factor must account for a large enough percentage of variance to be considered meaningful (Mvududu & Sink, 2013). Typically, a factor should account for at least 5% of the variance in the total model. A scree plot is a graphical representation or a line graph that depicts the number of factors on the X-axis and the corresponding EVs on the Y-axis (see Figure 6 in Mvududu & Sink, 2013, p. 87, for a sample scree plot). The cutoff for the number of factors to retain is portrayed by a clear bend in the line graph, indicating the point at which additional factors fail to contribute a substantive amount of variance to the total model. Finally, in a parallel analysis, EVs are generated from a random data set based on the number of items and the sample size of the real (sample) data. The factors from the sample data with EVs larger than the EVs from the randomly generated data are retained based on the notion that these factors explain more variance than would be expected by random chance. In some instances, these four criteria will reveal different factor solutions. In such cases, researchers should retain the simplest factor solution that makes both statistical and substantive sense.
Factor Rotation. After determining the number of factors to retain, researchers seek to uncover the association between the items and the factors or subscales (i.e., determining which items load on which factors) and strive to find simple structure or items with high factor loadings (close to ±1) on one factor and low factor loadings (near zero) on the other factors (Watson, 2017). The factors are rotated on vectors to enhance the readability or detection of simple structure (Mvududu & Sink, 2013). Orthogonal rotation methods (e.g., varimax, equamax, and quartimax) are appropriate when a researcher is measuring distinct or uncorrelated constructs of measurement. However, orthogonal rotation methods are rarely appropriate for use in counseling research, as counselors almost exclusively appraise variables that display some degree of inter-correlation (Mvududu & Sink, 2013). Oblique rotation methods (e.g., direct oblimin and promax) are generally more appropriate in counseling research, as they allow factors to inter-correlate by rotating the data on vectors at angles less than 90○. The nature of oblique rotations allows the total variance accounted for by each factor to overlap; thus, the total variance explained in a post–oblique rotated factor solution can be misleading (Bandalos & Finney, 2019). For example, the total variance accounted for in a post–oblique rotated factor solution might add up to more than 100%. To this end, counselors should report the total variance explained by the factor solution before rotation as well as the sum of each factor’s squared structure coefficient following an oblique factor rotation.
Following factor rotation, researchers examine a number of factor retention criteria to determine the items that load on each factor (Watson, 2017). Commonality values (h2) represent the proportion of variance that the extracted factor solution explains for each item. Items with h2 values that range between .30 and .99 should be retained, as they share an adequate amount of shared variance with the other items and factors (Watson, 2017). Items with small h2 values (< .30) should be considered for removal. However, commonality values should not be too high (≥ 1), as this suggests one’s sample size was insufficient or too many factors were extracted (Watson, 2017). Items with problematic h2 values should be removed one at a time, and the EFA should be re-computed after each removal because these values will fluctuate following each deletion. Oblique factor rotation methods produce two matrices, including the pattern matrix, which displays the relationship between the items and a factor while controlling for the items’ association with the other factors, and the structure matrix, which depicts the correlation between the items and all of the factors (Mvududu & Sink, 2013). Researchers should examine both the pattern and the structure matrices and interpret the one that displays the clearest evidence of simple structure with the least evidence of cross-loadings.
Items should display a factor loading of at least ≥ .40 (≥ .50 is desirable) to mark a factor. Items that fail to meet a minimum factor loading of ≥ .40 should be deleted. Cross-loading is evident when an item displays factor loadings ≥ .30 to .35 on two or more factors (Beavers et al., 2013; Mvududu & Sink, 2013; Watson, 2017). Researchers may elect to assign a variable to one factor if that item’s loading is .10 higher than the next highest loading. Items that cross-load might also be deleted. Once again, items should be deleted one at a time and the EFA should be re-computed after each removal.
Naming the Rotated Factors
The final step in EFA is naming the rotated factors; factor names should be brief (approximately one to four words) and capture the theoretical meaning of the group of items that comprise the factor (Mvududu & Sink, 2013). This is a subjective process, and the literature is lacking consistent guidelines for the process of naming factors. A research team can be incorporated into the process of naming their factors. Test developers can separately name each factor and then meet with their research team to discuss and eventually come to an agreement about the most appropriate name for each factor.
Confirmatory Factor Analysis
CFA is an application of structural equation modeling for testing the extent to which a hypothesized factor solution (e.g., the factor solution that emerged in the EFA or another existing factor solution) demonstrates an adequate fit with a different sample (Kahn, 2006; Lewis, 2017). When validating scores on a new test, investigators should compute both EFA and CFA with two different samples from the same population, as the emergent internal structure in EFA can vary substantially. Researchers can collect two sequential samples or they may elect to collect one large sample and divide it into two smaller samples, one for EFA and the second for CFA.
Evaluating model fit in CFA is a complex task that is typically determined by examining the collective implications of multiple goodness-of-fit (GOF) indices, which include absolute, incremental, and parsimonious (Lewis, 2017). Absolute fit indices evaluate the extent to which the hypothesized model or the dimensionality of the existing measure fits with the data collected from a new sample. Incremental fit indices compare the improvement in fit between the hypothesized model and a null model (also referred to as an independence model) in which there is no correlation between observed variables. Parsimonious fit indices take the model’s complexity into account by testing the extent to which model fit is improved by estimating fewer pathways (i.e., creating a more parsimonious or simple model). Psychometric researchers generally report a combination of absolute, incremental, and parsimonious fit indices to demonstrate acceptable model fit (Mvududu & Sink, 2013). Table 1 includes tentative guidelines for interpreting model fit based on the synthesized recommendations of leading psychometric researchers from a comprehensive search of the measurement literature (Byrne, 2016; Dimitrov, 2012; Fabrigar et al., 1999; Hooper et al., 2008; Hu & Bentler, 1999; Kahn, 2006; Lewis, 2017; Mvududu & Sink, 2013; Schreiber et al., 2006; Worthington & Whittaker, 2006).
Table 1
Fit Indices and Tentative Thresholds for Evaluating Model Fit
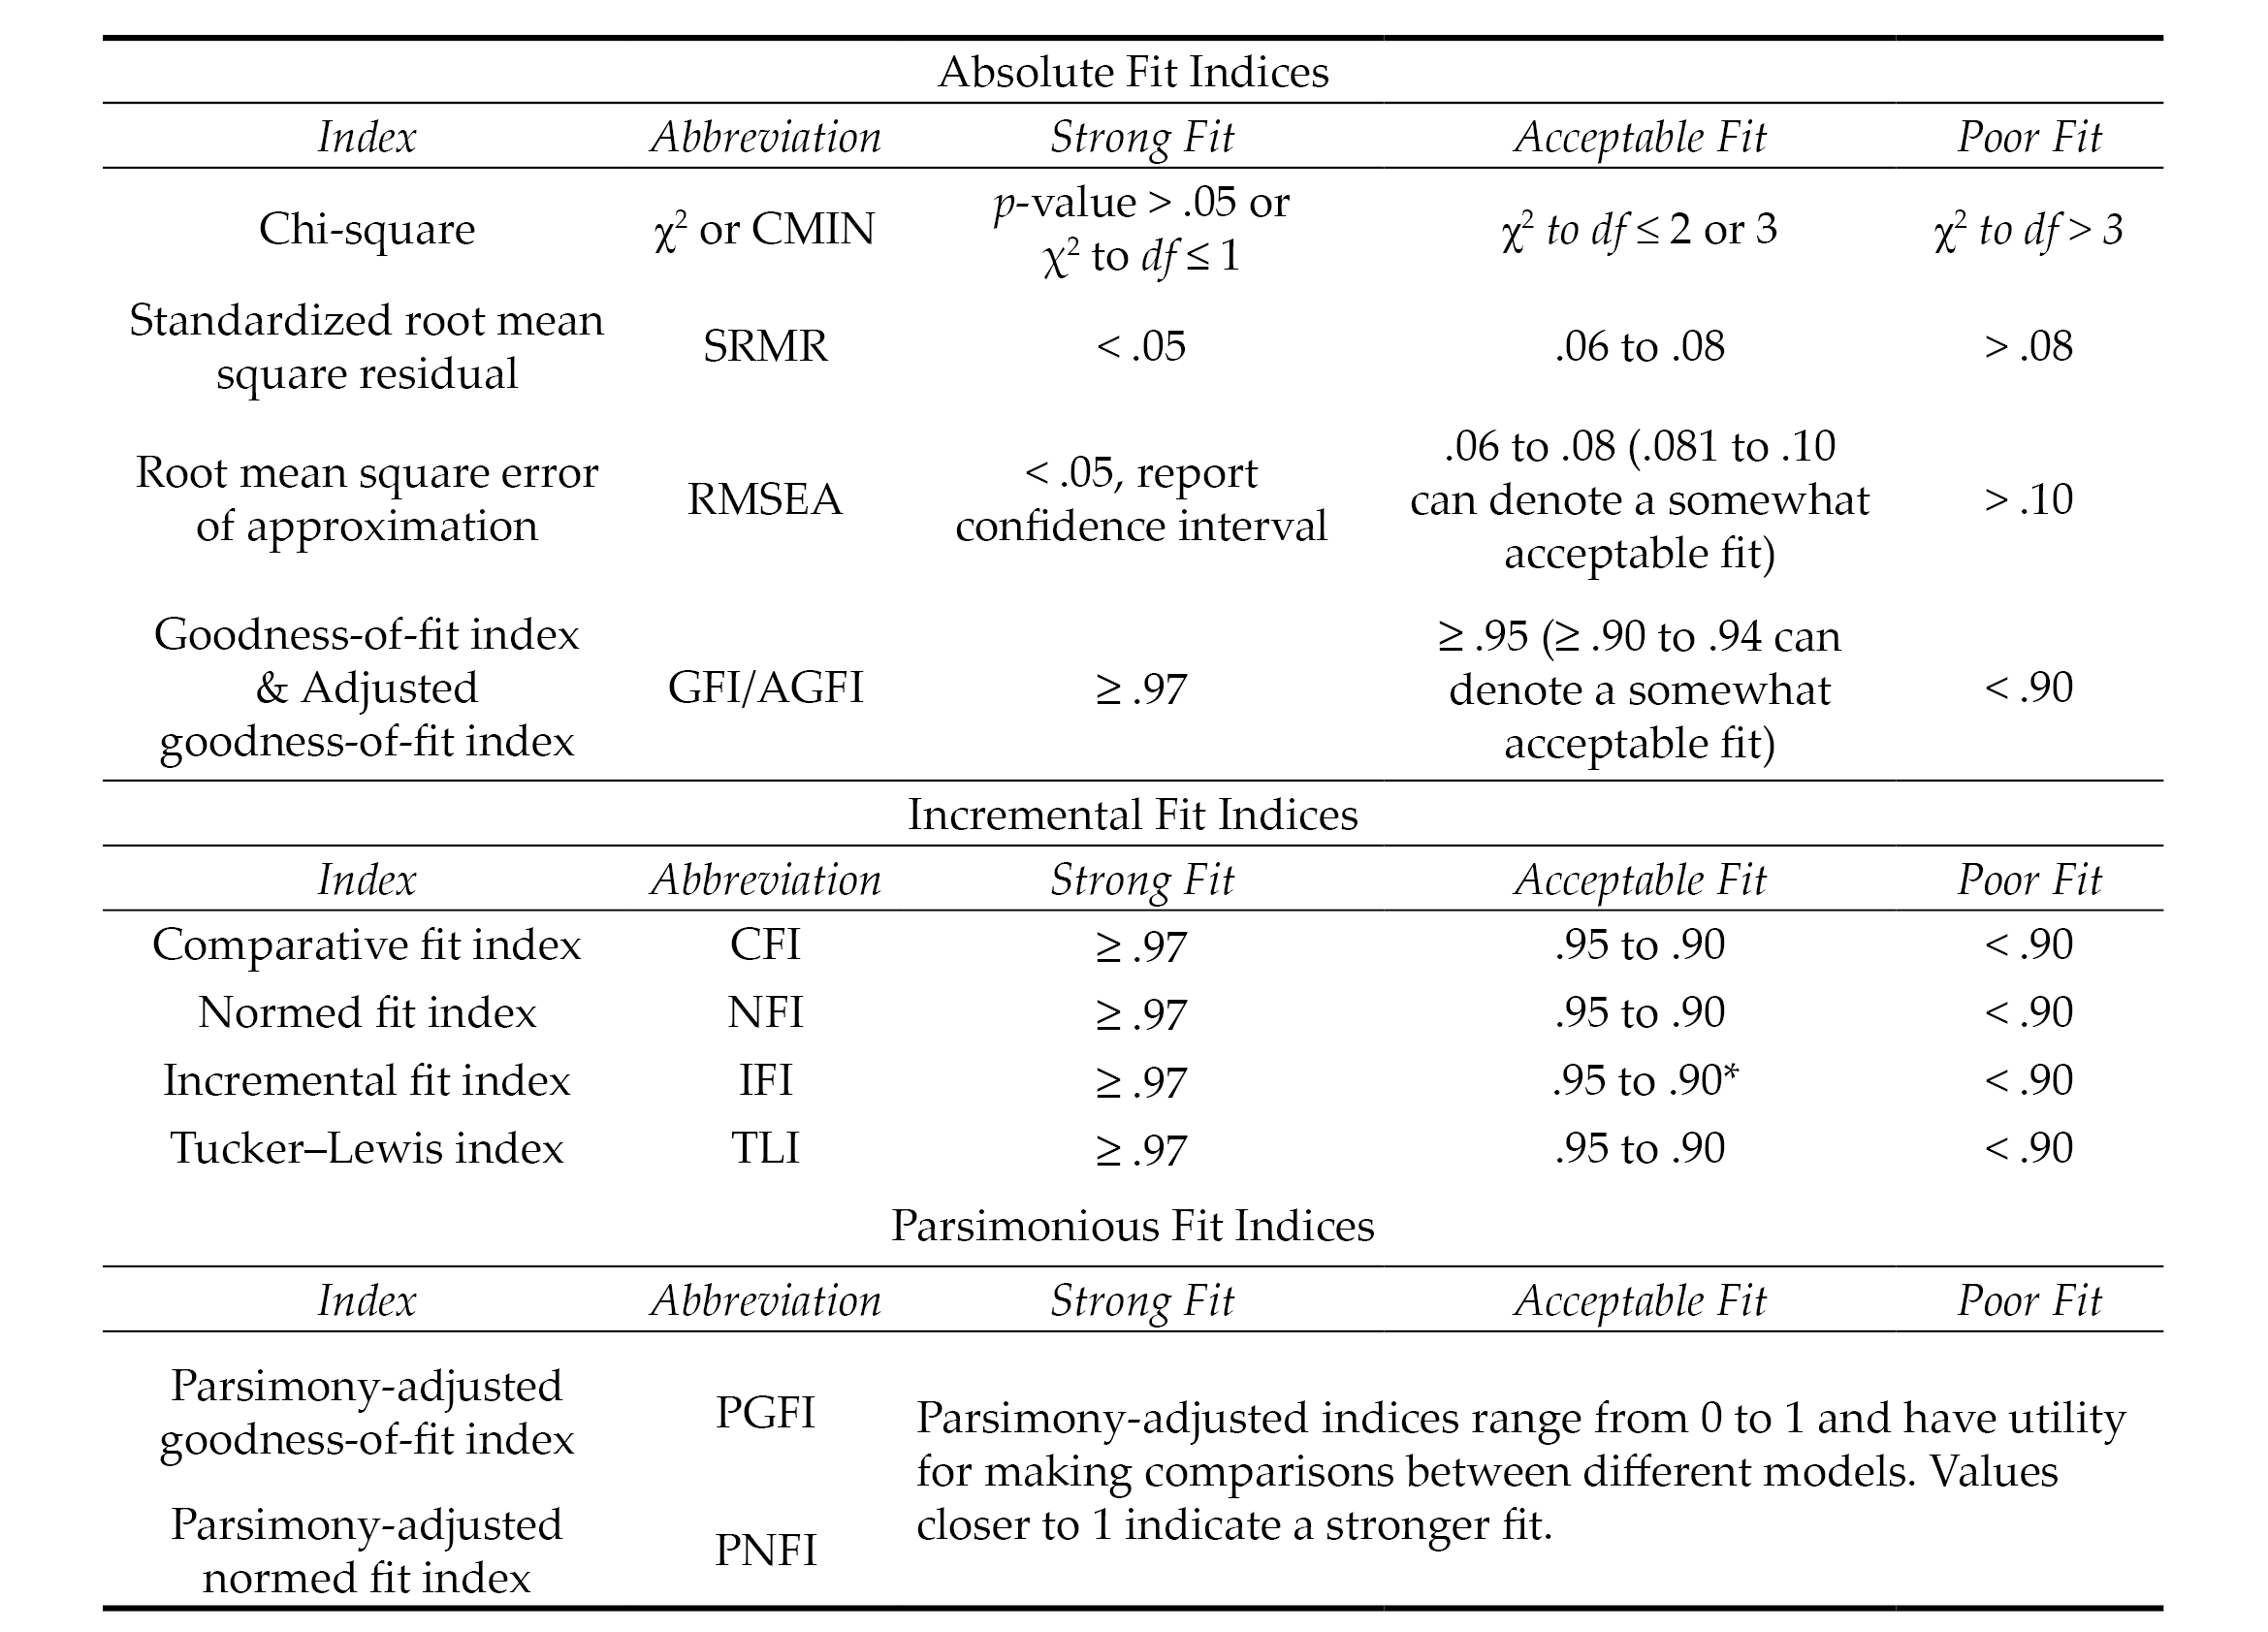
Note. The fit indices and benchmarks to estimate the degree of model fit in this table are offered as tentative guidelines for scores on attitudinal measures based on the synthesized recommendations of numerous psychometric researchers (see citations in the “Confirmatory Factor Analysis” section of this article). The list of fit indices in this table are not all-inclusive (i.e., not all of them are typically reported). There is no universal approach for determining which fit indices to investigate nor are there any absolute thresholds for determining the degree of model fit. No single fix index is sufficient for determining model fit. Researchers are tasked with selecting and interpreting fit indices holistically (i.e., collectively), in ways that make both statistical and substantive sense based on their construct of measurement and goals of the study.
*.90 to .94 can denote an acceptable model fit for incremental fix indices; however, the majority of values should be ≥ .95.
Model Respecification
The results of a CFA might reveal a poor or unacceptable model fit (see Table 1), indicating that the dimensionality of the hypothesized model that emerged from the EFA was not replicated or confirmed with a second sample (Mvududu & Sink, 2013). CFA is a rigorous model-fitting procedure and poor model fit in a CFA might indicate that the EFA-derived factor solution is insufficient for appraising the construct of measurement. CFA, however, is a more stringent test of structural validity than EFA, and psychometric researchers sometimes refer to the modification indices (also referred to as Lagrange multiplier statistics), which denote the expected decrease in the X2 value (i.e., degree of improvement in model fit) if the parameter is freely estimated (Dimitrov, 2012). In these instances, correlating the error terms between items or removing problematic items will improve model fit; however, when considering model respecification, psychometric researchers should proceed cautiously, if at all, as a strong theoretical justification is necessary to defend model respecification (Byrne, 2016; Lewis, 2017; Schreiber et al., 2006). Researchers should also be clear that model respecification causes the CFA to become an EFA because they are investigating the dimensionality of a different or modified model rather than confirming the structure of an existing, hypothesized model.
Higher-Order CFA
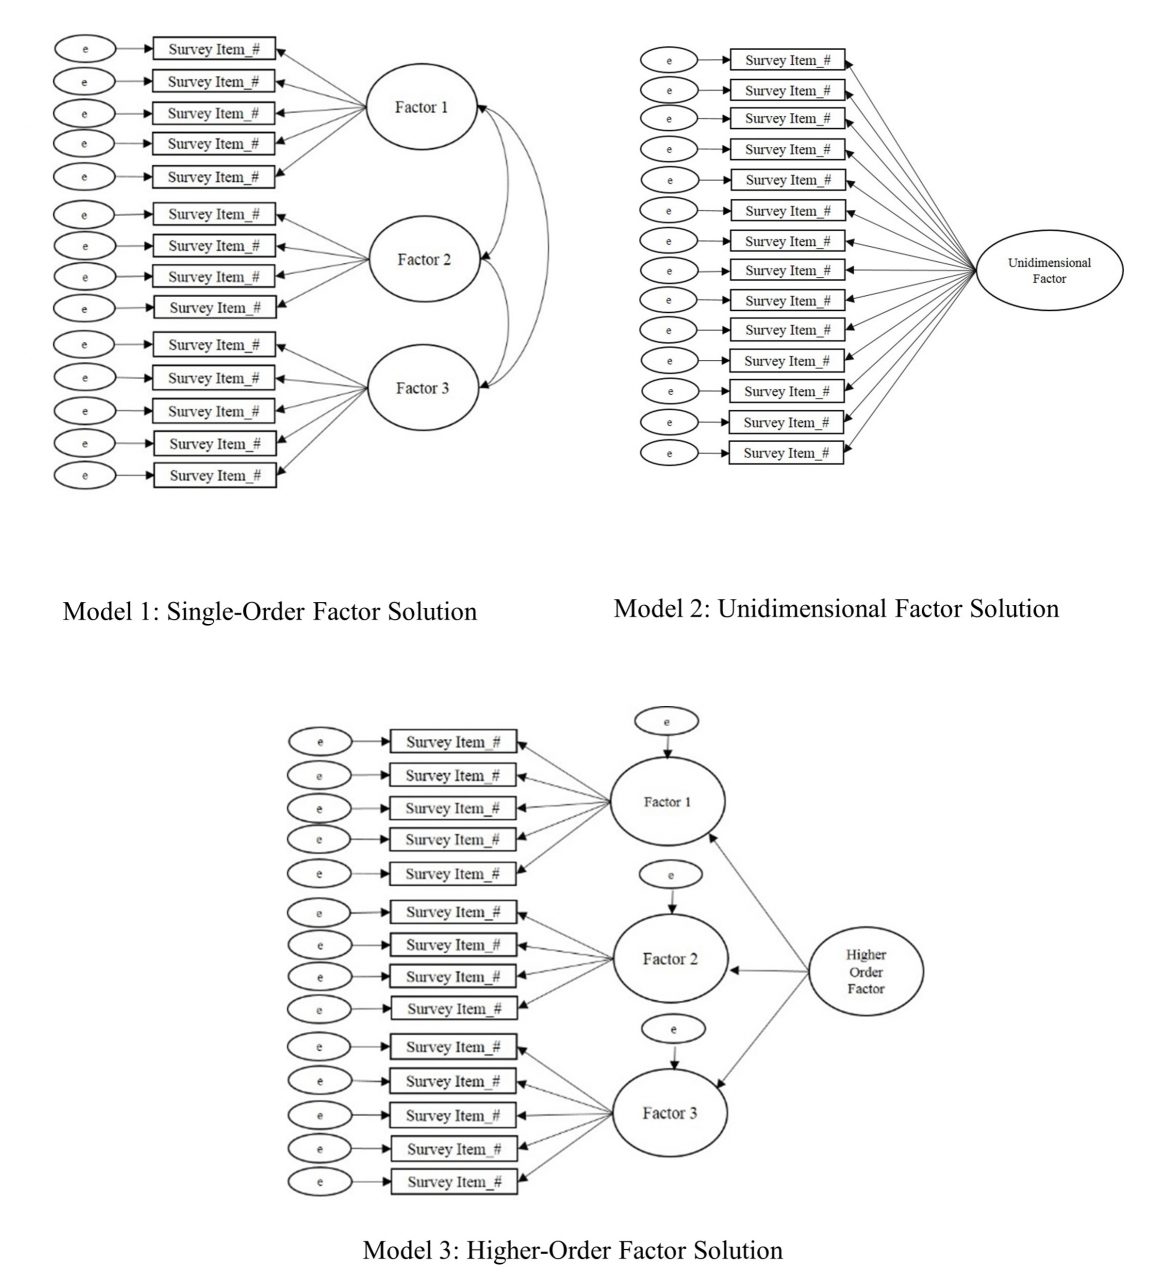
Higher-order CFA is an extension of CFA that allows researchers to test nested models and determine if a second-order latent variable (factor) explains the associations between the factors in a single-order CFA (Credé & Harms, 2015). Similar to single-order CFA (see Figure 3, Model 1) in which the test items cluster together to form the factors or subscales, higher-order CFA reveals if the factors are related to one another strongly enough to suggest the presence of a global factor (see Figure 3, Model 3). Suppose, for example, the test developer of a scale for measuring dimensions of the therapeutic alliance confirmed the three following subscales via single-order CFA (see Figure 3, Model 1): Empathy, Unconditional Positive Regard, and Congruence. Computing a higher-order CFA would reveal if a higher-order construct, which the research team might name Therapeutic Climate, is present in the data. In other words, higher-order CFA reveals if Empathy, Unconditional Positive Regard, and Congruence, collectively, comprise the second-order factor of Therapeutic Climate.
Determining if a higher-order factor explains the co-variation (association) between single-order factors is a complex undertaking. Thus, researchers should consider a number of criteria when deciding if their data are appropriate for higher-order CFA (Credé & Harms, 2015). First, moderate-to-strong associations (co-variance) should exist between first-order factors. Second, the unidimensional factor solution (see Figure 3, Model 2) should display a poor model fit (see Table 1) with the data. Third, theoretical support should exist for the presence of a higher-order factor. Referring to the example in the previous paragraph, person-centered therapy provides a theory-based explanation for the presence of a second-order or global factor (Therapeutic Climate) based on the integration of the single-order factors (Empathy, Unconditional Positive Regard, and Congruence). In other words, the presence of a second-order factor suggests that Therapeutic Climate explains the strong association between Empathy, Unconditional Positive Regard, and Congruence.
Finally, the single-order factors should display strong factor loadings (approximately ≥ .70) on the higher-order factor. However, there is not an absolute consensus among psychometric researchers regarding the criteria for higher-order CFA and the criteria summarized in this section are not a dualistic decision rule for retaining or rejecting a higher-order model. Thus, researchers are tasked with presenting that their data meet a number of criteria to justify the presence of a higher-order factor. If the results of a higher-order CFA reveal an acceptable model fit (see Table 1), researchers should directly compare (e.g., chi-squared test of difference) the single-order and higher-order models to determine if one model demonstrates a superior fit with the data at a statistically significant level.
Figure 3
Single-Order, Unidimensional, and Higher-Order Factor Solutions
Multiple-Group Confirmatory Factor Analysis
Multiple-group confirmatory factor analysis (MCFA) is an extension of CFA for testing the factorial invariance (psychometric equivalence) of a scale across subgroups of a sample or population (C.-C. Chen et al., 2020; Dimitrov, 2010). In other words, MCFA has utility for testing the extent to which a particular construct has the same meaning across different groups of a larger sample or population. Suppose, for example, the developer of the Therapeutic Climate scale (see example in the previous section) validated scores on their scale with undergraduate college students. Invariance testing has potential to provide further support for the internal structure validity of the scale by testing whether Empathy, Unconditional Positive Regard, and Congruence have the same meaning across different subgroups of undergraduate college students (e.g., between different gender identities, ethnic identities, age groups, and other subgroups of the larger sample).
Levels of Invariance. Factorial invariance can be tested in a number of different ways and includes the following primary levels or aspects: (a) configural invariance, (b) measurement (metric, scalar, and strict) invariance, and (c) structural invariance (Dimitrov, 2010, 2012). Configural invariance (also referred to as pattern invariance) serves as the baseline mode (typically the best fitting model with the data), which is used as the point of comparison when testing for metric, scalar, and structural invariance. In layperson’s terms, configural invariance is a test of whether the scales are approximately similar across groups.
Measurement invariance includes testing for metric and scalar invariance. Metric invariance is a test of whether each test item makes an approximately equal contribution (i.e., approximately equal factor loadings) to the latent variable (composite scale score). In layperson’s terms, metric invariance evaluates if the scale reasonably captures the same construct. Scalar invariance adds a layer of rigor to metric invariance by testing if the differences between the average scores on the items are attributed to differences in the latent variable means. In layperson’s terms, scalar invariance indicates that if the scores change over time, they change in the same way.
Strict invariance is the most stringent level of measurement invariance testing and tests if the sum total of the items’ unique variance (item variation that is not in common with the factor) is comparable to the error variance across groups. In layperson’s terms, the presence of strict invariance demonstrates that score differences between groups are exclusively due to differences in the common latent variables. Strict invariance, however, is typically not examined in social sciences research because the latent factors are not composed of residuals. Thus, residuals are negligible when evaluating mean differences in latent scores (Putnick & Bornstein, 2016).
Finally, structural invariance is a test of whether the latent factor variances are equivalent to the factor covariances (Dimitrov, 2010, 2012). Structural invariance tests the null hypothesis that there are no statistically significant differences between the unconstrained and constrained models (i.e., determines if the unconstrained model is equivalent to the constrained model). Establishing structural invariance indicates that when the structural pathways are allowed to vary across the two groups, they naturally produce equal results, which supports the notion that the structure of the model is invariant across both groups. In layperson’s terms, the presence of structural invariance indicates that the pathways (directionality) between variables behave in the same way across both groups. It is necessary to establish configural and metric invariance prior to testing for structural invariance.
Sample Size and Criteria for Evaluating Invariance. Researchers should check their sample size before computing invariance testing, as small samples (approximately < 200) can overestimate model fit (Dimitrov, 2010). Similar to single-order CFA, no absolute sample size guidelines exist in the literature for invariance testing. Generally, a minimum sample of at least 200 participants per group is recommended for invariance testing (although < 200 to 300+ is advantageous). Referring back to the Therapeutic Climate scale example (see the previous section), investigators would need a minimum sample of 400 if they were seeking to test the invariance of the scale by generational status (200 first generation + 200 non-first generation = 400). The minimum sample size would increase as more levels are added. For example, a minimum sample of 600 would be recommended if investigators quantified generational status on three levels (200 first generation + 200 second generation + 200 third generation and beyond = 600).
Factorial invariance is investigated through a computation of the change in model fit at each level of invariance testing (F. F. Chen, 2007). Historically, the Satorra and Bentler chi-square difference test was the sole criteria for testing factorial invariance, with a non-significant p-value indicating factorial invariance (Putnick & Bornstein, 2016). The chi-square difference test is still commonly reported by contemporary psychometric researchers; however, it is rarely used as the sole criteria for determining invariance, as the test is sensitive to large samples. The combined recommendations of F. F. Chen (2007) and Putnick and Bornstein (2016) include the following thresholds for investigating invariance: ≤ ∆ 0.010 in CFI, ≤ ∆ 0.015 in RMSEA, and ≤ ∆ 0.030 in SRMR for metric invariance or ≤ ∆ 0.015 in SRMR for scalar invariance. In a simulation study, Kang et al. (2016) found that McDonald’s NCI (MNCI) outperformed the CFI in terms of stability. Kang et al. (2016) recommend < ∆ 0.007 in MNCI for the 5th percentile and ≤ ∆ 0.007 in MNCI for the 1st percentile as cutoff values for measurement quality. Strong measurement invariance is achieved when both metric and scalar invariance are met, and weak invariance is accomplished when only metric invariance is present (Dimitrov, 2010).
Exemplar Review of a Psychometric Study
The following section will include a review of an exemplar psychometric study based on the recommendations for EFA (see Figure 2) and CFA (see Table 1) that are provided in this manuscript. In 2020, I collaborated with Ryan Flinn on the development and validation of scores on the Mental Distress Response Scale (MDRS) for appraising how college students are likely to respond when encountering a peer in mental distress (Kalkbrenner & Flinn, 2020). A total of 13 items were entered into an EFA. Following the steps for EFA (see Figure 1), the sample size (N = 569) exceeded the guidelines for sample size that I published in my 2021 article (Kalkbrenner, 2021b), including an STV of 10:1 or 200 participants, whichever produces a larger sample. Flinn and I (2020) ensured that our 2020 study’s data were consistent with a normal distribution (skewness & kurtosis values ≤ ±1) and computed preliminary assumption checking, including inter-item correlation matrix, KMO (.73), and Bartlett’s test of sphericity (p < .001).
An ML factor extraction method was employed, as the data were largely consistent (skewness & kurtosis values ≤ ±1) with a normal distribution. We used the three most rigorous factor retention criteria—percentage of variance accounted for, scree test, and parallel analysis—to extract a two-factor solution. An oblique factor rotation method (direct oblimin) was employed, as the two factors were correlated. We referred to the recommended factor retention criteria, including h2 values .30 to .99, factor loadings ≥ .40, and cross-loading ≥ .30, to eliminate one item with low commonalities and two cross-loading items. Using a research team, we named the first factor Diminish/Avoid, as each item that marked this factor reflected a dismissive or evasive response to encountering a peer in mental distress. The second factor was named Approach/Encourage because each item that marked this factor included a response to a peer in mental distress that was active and likely to help connect their peer to mental health support services.
Our next step was to compute a CFA by administering the MDRS to a second sample of undergraduate college students to confirm the two-dimensional factor solution that emerged in the EFA. The sample size (N = 247) was sufficient for CFA (STV > 10:1 and > 200 participants). The MDRS items were entered into a CFA and the following GOF indices emerged: CMIN = χ2 (34) = 61.34, p = .003, CMIN/DF = 1.80, CFI = .96, IFI = .96, RMSEA = .06, 90% CI [0.03, 0.08], and SRMR = .04. A comparison between our GOF indices from the 2020 study with the thresholds for evaluating model fit in Table 1 reveal an acceptable-to-strong fit between the MDRS model and the data. Collectively, our 2020 procedures for EFA and CFA were consistent with the recommendations in this manuscript.
Implications for the Profession
Implications for Counseling Practitioners
Assessment literacy is a vital component of professional counseling practice, as counselors who practice in a variety of specialty areas select and administer tests to clients and use the results to inform diagnosis and treatment planning (C.-C. Chen et al., 2020; Mvududu & Sink, 2013; NBCC, 2016; Neukrug & Fawcett, 2015). It is important to note that test results alone should not be used to make diagnoses, as tests are not inherently valid (Kalkbrenner, 2021b). In fact, the authors of the Diagnostic and Statistical Manual of Mental Disorders stated that “scores from standardized measures and interview sources must be interpreted using clinical judgment” (American Psychiatric Association, 2013, p. 37). Professional counselors can use test results to inform their diagnoses; however, diagnostic decision making should ultimately come down to a counselor’s clinical judgment.
Counseling practitioners can refer to this manuscript as a reference for evaluating the internal structure validity of scores on a test to help determine the extent to which, if any at all, the test in question is appropriate for use with clients. When evaluating the rigor of an EFA for example, professional counselors can refer to this manuscript to evaluate the extent to which test developers followed the appropriate procedures (e.g., preliminary assumption checking, factor extraction, retention, and rotation [see Figure 2]). Professional counselors are encouraged to pay particular attention to the factor extraction method that the test developers employed, as PCA is sometimes used in lieu of more appropriate methods (e.g., PAF/ML). Relatedly, professional counselors should be vigilant when evaluating the factor rotation method employed by test developers because oblique rotation methods are typically more appropriate than orthogonal (e.g., varimax) for counseling tests.
CFA is one of the most commonly used tests of the internal structure validity of scores on psychological assessments (Kalkbrenner, 2021b). Professional counselors can compare the CFA fit indices in a test manual or journal article to the benchmarks in Table 1 and come to their own conclusion about the internal structure validity of scores on a test before using it with clients. Relatedly, the layperson’s definitions of common psychometric terms in Figure 1 might have utility for increasing professional counselors’ assessment literacy by helping them decipher some of the psychometric jargon that commonly appears in psychometric studies and test manuals.
Implications for Counselor Education
Assessment literacy begins in one’s counselor education program and it is imperative that counselor educators teach their students to be proficient in recognizing and evaluating internal structure validity evidence of test scores. Teaching internal structure validity evidence can be an especially challenging pursuit because counseling students tend to fear learning about psychometrics and statistics (Castillo, 2020; Steele & Rawls, 2015), which can contribute to their reticence and uncertainty when encountering psychometric research. This reticence can lead one to read the methodology section of a psychometric study briefly, if at all. Counselor educators might suggest the present article as a resource for students taking classes in research methods and assessment as well as for students who are completing their practicum, internship, or dissertation who are evaluating the rigor of existing measures for use with clients or research participants.
Counselor educators should urge their students not to skip over the methodology section of a psychometric study. When selecting instrumentation for use with clients or research participants, counseling students and professionals should begin by reviewing the methodology sections of journal articles and test manuals to ensure that test developers employed rigorous and empirically supported procedures for test development and score validation. Professional counselors and their students can compare the empirical steps and guidelines for structural validation of scores that are presented in this manuscript with the information in test manuals and journal articles of existing instrumentation to evaluate its internal structure. Counselor educators who teach classes in assessment or psychometrics might integrate an instrument evaluation assignment into the course in which students select a psychological instrument and critique its psychometric properties. Another way that counselor educators who teach classes in current issues, research methods, assessment, or ethics can facilitate their students’ assessment literacy development is by creating an assignment that requires students to interview a psychometric researcher. Students can find psychometric researchers by reviewing the editorial board members and authors of articles published in the two peer-reviewed journals of the Association for Assessment and Research in Counseling, Measurement and Evaluation in Counseling and Development and Counseling Outcome Research and Evaluation. Students might increase their interest and understanding about the necessity of assessment literacy by talking to researchers who are passionate about psychometrics.
Assessment Literacy: Additional Considerations
Internal structure validity of scores is a crucial component of assessment literacy for evaluating the construct validity of test scores (Bandalos & Finney, 2019). Assessment literacy, however, is a vast construct and professional counselors should consider a number of additional aspects of test worthiness when evaluating the potential utility of instrumentation for use with clients. Reviewing these additional considerations is beyond the scope of this manuscript; however, readers can refer to the following features of assessment literacy and corresponding resources: reliability (Kalkbrenner, 2021a), practicality (Neukrug & Fawcett, 2015), steps in the instrument development process (Kalkbrenner, 2021b), and convergent and divergent validity evidence of scores (Swank & Mullen, 2017). Moreover, the discussion of internal structure validity evidence of scores in this manuscript is based on Classical Test Theory (CTT), which tends to be an appropriate platform for attitudinal measures. However, Item Response Theory (see Amarnani, 2009) is an alternative to CTT with particular utility for achievement and aptitude testing.
Cross-Cultural Considerations in Assessment Literacy
Professional counselors have an ethical obligation to consider the cross-cultural fairness of a test before use with clients, as the validity of test scores are culturally dependent (American Counseling Association [ACA], 2014; Kane, 2010; Neukrug & Fawcett, 2015; Swanepoel & Kruger, 2011). Cross-cultural fairness (also known as test fairness) in testing and assessment “refers to the comparability of score meanings across individuals, groups or settings” (Swanepoel & Kruger, 2011, p. 10). There exists some overlap between internal structure validity and cross-cultural fairness; however, some distinct differences exist as well.
Using CFA to confirm the factor structure of an established test with participants from a different culture is one way to investigate the cross-cultural fairness of scores. Suppose, for example, an investigator found acceptable internal structure validity evidence (see Table 1) for scores on an anxiety inventory that was normed in America with participants in Eastern Europe who identify with a collectivist cultural background. Such findings would suggest that the dimensionality of the anxiety inventory extends to the sample of Eastern European participants. However, internal structure validity testing alone might not be sufficient for testing the cross-cultural fairness of scores, as factor analysis does not test for content validity. In other words, although the CFA confirmed the dimensionality of an American model with a sample of Eastern European participants, the analysis did not take potential qualitative differences about the construct of measurement (anxiety severity) into account. It is possible (and perhaps likely) that the lived experience of anxiety differs between those living in two different cultures. Accordingly, a systems-level approach to test development and score validation can have utility for enhancing the cross-cultural fairness of scores (Swanepoel & Kruger, 2011).
A Systems-Level Approach to Test Development and Score Validation
Swanepoel and Kruger (2011) outlined a systemic approach to test development that involves circularity, which includes incorporating qualitative inquiry into the test development process, as qualitative inquiry has utility for uncovering the nuances of participants’ lived experiences that quantitative data fail to capture. For example, an exploratory-sequential mixed-methods design in which qualitative findings are used to guide the quantitative analyses is a particularly good fit with systemic approaches to test development and score validation. Referring to the example in the previous section, test developers might conduct qualitative interviews to develop a grounded theory of anxiety severity in the context of the collectivist culture. The grounded theory findings could then be used as the theoretical framework (see Kalkbrenner, 2021b) for a psychometric study aimed at testing the generalizability of the qualitative findings. Thus, in addition to evaluating the rigor of factor analytic results, professional counselors should also review the cultural context in which test items were developed before administering a test to clients.
Language adaptions of instrumentation are another relevant cross-cultural fairness consideration in counseling research and practice. Word-for-word translations alone are insufficient for capturing cross-cultural fairness of instrumentation, as culture extends beyond just language (Lenz et al., 2017; Swanepoel & Kruger, 2011). Pure word-for-word translations can also cause semantic errors. For example, feeling “fed up” might translate to feeling angry in one language and to feeling full after a meal in another language. Accordingly, professional counselors should ensure that a translated instrument was subjected to rigorous procedures for maintaining cross-cultural fairness. Reviewing such procedures is beyond the scope of this manuscript; however, Lenz et al. (2017) outlined a 6-step process for language translation and cross-cultural adaptation of instruments.
Conclusion
Gaining a deeper understanding of the major approaches to factor analysis for demonstrating internal structure validity in counseling research has potential to increase assessment literacy among professional counselors who work in a variety of specialty areas. It should be noted that the thresholds for interpreting the strength of internal structure validity coefficients that are provided throughout this manuscript should be used as tentative guidelines, not unconditional standards. Ultimately, internal structure validity is a function of test scores and the construct of measurement. The stakes or consequences of test results should be considered when making final decisions about the strength of validity coefficients. As professional counselors increase their familiarity with factor analysis, they will most likely become more cognizant of the strengths and limitations of counseling-related tests to determine their utility for use with clients. The practical overview of factor analysis presented in this manuscript can serve as a one-stop shop or resource that professional counselors can refer to as a reference for selecting tests with validated scores for use with clients, a primer for teaching courses, and a resource for conducting their own research.
Conflict of Interest and Funding Disclosure
The author reported no conflict of interest
or funding contributions for the development
of this manuscript.
References
Amarnani, R. (2009). Two theories, one theta: A gentle introduction to item response theory as an alternative to classical test theory. The International Journal of Educational and Psychological Assessment, 3, 104–109.
American Counseling Association. (2014). ACA code of ethics. https://www.counseling.org/resources/aca-code-of-ethics.pdf
American Educational Research Association, American Psychological Association, National Council on Measurement in Education. (2014). Standards for educational and psychological testing. https://www.apa.org/science/programs/testing/standards
American Psychiatric Association. (2013). Diagnostic and statistical manual of mental disorders (5th ed.).
https://doi.org/10.1176/appi.books.9780890425596
Bandalos, D. L., & Finney, S. J. (2019). Factor analysis: Exploratory and confirmatory. In G. R. Hancock, L. M. Stapleton, & R. O. Mueller (Eds.), The reviewer’s guide to quantitative methods in the social sciences (2nd ed., pp. 98–122). Routledge.
Beavers, A. S., Lounsbury, J. W., Richards, J. K., Huck, S. W., Skolits, G. J., & Esquivel, S. L. (2013). Practical considerations for using exploratory factor analysis in educational research. Practical Assessment, Research and Evaluation, 18(5/6), 1–13. https://doi.org/10.7275/qv2q-rk76
Byrne, B. M. (2016). Structural equation modeling with AMOS: Basic concepts, applications, and programming (3rd ed.). Routledge.
Castillo, J. H. (2020). Teaching counseling students the science of research. In M. O. Adekson (Ed.), Beginning your counseling career: Graduate preparation and beyond (pp. 122–130). Routledge.
Chen, C.-C., Lau, J. M., Richardson, G. B., & Dai, C.-L. (2020). Measurement invariance testing in counseling. Journal of Professional Counseling: Practice, Theory & Research, 47(2), 89–104.
https://doi.org/10.1080/15566382.2020.1795806
Chen, F. F. (2007). Sensitivity of goodness of fit indexes to lack of measurement invariance. Structural Equation Modeling, 14(3), 464–504. https://doi.org/10.1080/10705510701301834
Council for Accreditation of Counseling and Related Educational Programs. (2015). 2016 CACREP standards. http://www.cacrep.org/wp-content/uploads/2017/08/2016-Standards-with-citations.pdf
Credé, M., & Harms, P. D. (2015). 25 years of higher-order confirmatory factor analysis in the organizational sciences: A critical review and development of reporting recommendations. Journal of Organizational
Behavior, 36(6), 845–872. https://doi.org/10.1002/job.2008
Dimitrov, D. M. (2010). Testing for factorial invariance in the context of construct validation. Measurement and Evaluation in Counseling and Development, 43(2), 121–149. https://doi.org/10.1177/0748175610373459
Dimitrov, D. M. (2012). Statistical methods for validation of assessment scale data in counseling and related fields. American Counseling Association.
Fabrigar, L. R., Wegener, D. T., MacCallum, R. C., & Strahan, E. J. (1999). Evaluating the use of exploratory factor analysis in psychological research. Psychological Methods, 4(3), 272–299.
https://doi.org/10.1037/1082-989X.4.3.272
Field, A. (2018). Discovering statistics using IBM SPSS statistics (5th ed.). SAGE.
Hooper, D., Coughlan, J., & Mullen, M. R. (2008). Structural equation modelling: Guidelines for determining model fit. The Electronic Journal of Business Research Methods, 6(1), 53–60.
Hu, L., & Bentler, P. M. (1999). Cutoff criteria for fit indexes in covariance structure analysis: Conventional criteria versus new alternatives. Structural Equation Modeling: A Multidisciplinary Journal, 6(1), 1–55. https://doi.org/10.1080/10705519909540118
Kahn, J. H. (2006). Factor analysis in counseling psychology research, training, and practice: Principles, advances, and applications. The Counseling Psychologist, 34(5), 684–718. https://doi.org/10.1177/0011000006286347
Kaiser, H. F. (1974). An index of factorial simplicity. Psychometrika, 39(1), 31–36. https://doi.org/10.1007/BF02291575
Kalkbrenner, M. T. (2021a). Alpha, omega, and H internal consistency reliability estimates: Reviewing these options and when to use them. Counseling Outcome Research and Evaluation. Advance online publication. https://doi.org/10.1080/21501378.2021.1940118
Kalkbrenner, M. T. (2021b). A practical guide to instrument development and score validation in the social sciences: The MEASURE Approach. Practical Assessment, Research, and Evaluation, 26, Article 1. https://scholarworks.umass.edu/pare/vol26/iss1/1
Kalkbrenner, M. T., & Flinn, R. E. (2020). The Mental Distress Response Scale and promoting peer-to-peer mental health support: Implications for college counselors and student affairs officials. Journal of College Student Development, 61(2), 246–251. https://doi.org/10.1353/csd.2020.0021
Kane, M. (2010). Validity and fairness. Language Testing, 27(2), 177–182. https://doi.org/10.1177/0265532209349467
Kang, Y., McNeish, D. M., & Hancock, G. R. (2016). The role of measurement quality on practical guidelines for assessing measurement and structural invariance. Educational and Psychological Measurement, 76(4), 533–561. https://doi.org/10.1177/0013164415603764
Lenz, A. S., Gómez Soler, I., Dell’Aquilla, J., & Uribe, P. M. (2017). Translation and cross-cultural adaptation of assessments for use in counseling research. Measurement and Evaluation in Counseling and Development, 50(4), 224–231. https://doi.org/10.1080/07481756.2017.1320947
Lewis, T. F. (2017). Evidence regarding the internal structure: Confirmatory factor analysis. Measurement and Evaluation in Counseling and Development, 50(4), 239–247. https://doi.org/10.1080/07481756.2017.1336929
Mvududu, N. H., & Sink, C. A. (2013). Factor analysis in counseling research and practice. Counseling Outcome Research and Evaluation, 4(2), 75–98. https://doi.org/10.1177/2150137813494766
National Board for Certified Counselors. (2016). NBCC code of ethics. https://www.nbcc.org/Assets/Ethics/NBCCCodeofEthics.pdf
Neukrug, E. S., & Fawcett, R. C. (2015). Essentials of testing and assessment: A practical guide for counselors, social workers, and psychologists (3rd ed.). Cengage.
Putnick, D. L., & Bornstein, M. H. (2016). Measurement invariance conventions and reporting: The state of the art and future directions for psychological research. Developmental Review, 41, 71–90. https://doi.org/10.1016/j.dr.2016.06.004
Schreiber, J. B., Nora, A., Stage, F. K., Barlow, E. A., & King, J. (2006). Reporting structural equation modeling and confirmatory factor analysis results: A review. Journal of Educational Research, 99(6), 323–338.
https://doi:10.3200/JOER.99.6.323-338
Steele, J. M., & Rawls, G. J. (2015). Quantitative research attitudes and research training perceptions among master’s-level students. Counselor Education and Supervision, 54(2), 134–146. https://doi.org/10.1002/ceas.12010
Swanepoel, I., & Kruger, C. (2011). Revisiting validity in cross-cultural psychometric-test development: A systems-informed shift towards qualitative research designs. South African Journal of Psychiatry, 17(1), 10–15. https://doi.org/10.4102/sajpsychiatry.v17i1.250
Swank, J. M., & Mullen, P. R. (2017). Evaluating evidence for conceptually related constructs using bivariate correlations. Measurement and Evaluation in Counseling and Development, 50(4), 270–274.
https://doi.org/10.1080/07481756.2017.1339562
Tate, K. A., Bloom, M. L., Tassara, M. H., & Caperton, W. (2014). Counselor competence, performance assessment, and program evaluation: Using psychometric instruments. Measurement and Evaluation in Counseling and Development, 47(4), 291–306. https://doi.org/10.1177/0748175614538063
Watson, J. C. (2017). Establishing evidence for internal structure using exploratory factor analysis. Measurement and Evaluation in Counseling and Development, 50(4), 232–238. https://doi.org/10.1080/07481756.2017.1336931
Worthington, R. L., & Whittaker, T. A. (2006). Scale development research: A content analysis and recommendations for best practices. The Counseling Psychologist, 34(6), 806–838. https://doi.org/10.1177/0011000006288127
Michael T. Kalkbrenner, PhD, NCC, is an associate professor at New Mexico State University. Correspondence may be addressed to Michael T. Kalkbrenner, Department of Counseling and Educational Psychology, New Mexico State University, Las Cruces, NM 88003, mkalk001@nmsu.edu.
Aug 20, 2021 | Volume 11 - Issue 3
Alison M. Boughn, Daniel A. DeCino
This article introduces the development and implementation of the Psychological Maltreatment Inventory (PMI) assessment with child respondents receiving services because of an open child abuse and/or neglect case in the Midwest (N = 166). Sixteen items were selected based on the literature, subject matter expert refinement, and readability assessments. Results indicate the PMI has high reliability (α = .91). There was no evidence the PMI total score was influenced by demographic characteristics. A positive relationship was discovered between PMI scores and general trauma symptom scores on the Trauma Symptom Checklist for Children Screening Form (TSCC-SF; r = .78, p = .01). Evidence from this study demonstrates the need to refine the PMI for continued use with children. Implications for future research include identification of psychological maltreatment in isolation, further testing and refinement of the PMI, and exploring the potential relationship between psychological maltreatment and suicidal ideation.
Keywords: psychological maltreatment, child abuse, neglect, assessment, trauma
In 2012, the Centers for Disease Control (CDC; 2012) reported that the total cost of child maltreatment (CM) in 2008, including psychological maltreatment (PM), was $124 billion. Fang et al. (2012) estimated the lifetime burden of CM in 2008 was as high as $585 billion. The CDC (2012) characterized CM as rivaling “other high profile public health problems” (para. 1). By 2015, the National Institutes of Health reported the total cost of CM, based on substantiated incidents, was reported to be $428 billion, a 345% increase in just 7 years; the true cost was predictably much higher (Peterson et al., 2018). Using the sensitivity analysis done by Fang et al. (2012), the lifetime burden of CM in 2015 may have been as high as $2 trillion. If these trends continue unabated, the United States could expect a total cost for CM, including PM, of $5.1 trillion by 2030, with a total lifetime cost of $24 trillion. More concerning, this increase would not account for any impact from the COVID-19 pandemic.
Mental health first responders and child protection professionals may encounter PM regularly in their careers (Klika & Conte, 2017; U.S. Department of Health and Human Services [DHHS], 2018). PM experiences are defined as inappropriate emotional and psychological acts (e.g., excessive yelling, threatening language or behavior) and/or lack of appropriate acts (e.g., saying I love you) used by perpetrators of abuse and neglect to gain organizational control of their victims (American Professional Society on the Abuse of Children [APSAC], 2019; Klika & Conte, 2017; Slep et al., 2015). Victims may experience negative societal perceptions (i.e., stigma), fear of retribution from caregivers or guardians, or misdiagnosis by professional helpers (Iwaniec, 2006; López et al., 2015). They often face adverse consequences that last their entire lifetime (Spinazzola et al., 2014; Tyrka et al., 2013; Vachon et al., 2015; van der Kolk, 2014; van Harmelen et al., 2010; Zimmerman & Mercy, 2010). PM can be difficult to identify because it leaves no readily visible trace of injury (e.g., bruises, cuts, or broken bones), making it complicated to substantiate that a crime has occurred (Ahern et al., 2014; López et al., 2015). Retrospective data outlines evaluation processes for PM identification in adulthood; however, childhood PM lacks a single definition and remains difficult to assess (Tonmyr et al., 2011). These complexities in identifying PM in children may prevent mental health professionals from intervening early, providing crucial care, and referring victims for psychological health services (Marshall, 2012; Spinazzola et al., 2014). The Psychological Maltreatment Inventory (PMI) is the first instrument of its kind to address these deficits.
Child Psychological Maltreatment
Although broadly conceptualized, child PM experiences are described as literal acts, events, or experiences that create current or future symptoms that can affect a victim without immediate physical evidence (López et al., 2015). Others have extended child PM to include continued patterns of severe events that impede a child from securing basic psychological needs and convey to the child that they are worthless, flawed, or unwanted (APSAC, 2019). Unfortunately, these broad concepts lack the specificity to guide legal and mental health interventions (Ahern et al., 2014). Furthermore, legal definitions of child PM vary from jurisdiction to jurisdiction and state to state (Spinazzola et al., 2014). The lack of consistent definitions and quantifiable measures of child PM may create barriers for prosecutors and other helping professionals within the legal system as well as a limited understanding of PM in evidence-based research (American Psychiatric Association [APA], 2013; APSAC, 2019; Klika & Conte, 2017). These challenges are exacerbated by comorbidity with other forms of maltreatment.
Co-Occurring Forms of Maltreatment
According to DHHS (2018), child PM is rarely documented as occurring in isolation compared to other forms of maltreatment (i.e., physical abuse, sexual abuse, or neglect). Rather, researchers have found PM typically coexists with other forms of maltreatment (DHHS, 2018; Iwaniec, 2006; Marshall, 2012). Klika and Conte (2017) reported that perpetrators who use physical abuse, inappropriate language, and isolation facilitate conditions for PM to coexist with other forms of abuse. Van Harmelen et al. (2011) argued that neglectful acts constitute evidence of PM (e.g., seclusion; withholding medical attention; denying or limiting food, water, shelter, and other basic needs).
Consequences of PM Experienced in Childhood
Mills et al. (2013) and Greenfield and Marks (2010) noted PM experiences in early childhood might manifest in physical growth delays and require access to long-term care throughout a victim’s lifetime. Children who have experienced PM may suffer from behaviors that delay or prevent meeting developmental milestones, achieving academic success in school, engaging in healthy peer relationships, maintaining physical health and well-being, forming appropriate sexual relationships as adults, and enjoying satisfying daily living experiences (Glaser, 2002; Maguire et al., 2015). Neurological and cognitive effects of PM in childhood impact children as they transition into adulthood, including abnormalities in the amygdala and hippocampus (Tyrka at al., 2013). Brown et al. (2019) found that adults who reported experiences of CM had higher rates of negative responses to everyday stress, a larger constellation of unproductive coping skills, and earlier mortality rates (Brown et al., 2019; Felitti et al., 1998). Furthermore, adults with childhood PM experiences reported higher rates of substance abuse than those compared to control groups (Felitti et al., 1998).
Trauma-Related Symptomology. Researchers speculate that children exposed to maltreatment and crises, especially those that come without warning, are at greater risk for developing a host of trauma-related symptoms (Spinazzola et al., 2014). Developmentally, children lack the ability to process and contextualize their lived experiences. Van Harmelen et al. (2010) discovered that adults who experienced child PM had decreased prefrontal cortex mass compared to those without evidence of PM. Similarly, Field et al. (2017) found those unable to process traumatic events produced higher levels of stress hormones (i.e., cortisol, epinephrine, norepinephrine); these hormones are produced from the hypothalamic-pituitary-adrenal (HPA) and sympathetic-adrenal-medullary (SAM) regions in the brain. Some researchers speculate that elevated levels of certain hormones and hyperactive regions within the brain signal the body’s biological attempt to reduce the negative impact of PM through the fight-flight-freeze response (Porges, 2011; van der Kolk, 2014).
Purpose of Present Study
At the time of this research, there were few formal measures using child self-report to assess how children experience PM. We developed the PMI as an initial quantifiable measure of child PM for children and adolescents between the ages of 8 and 17, as modeled by Tonmyr and colleagues (2011). The PMI was developed in multiple stages, including 1) a review of the literature, 2) a content validity survey with subject matter experts (SMEs), 3) a pilot study (N = 21), and 4) a large sample study (N = 166). An additional instrument, the Trauma Symptom Checklist for Children Screening Form (TSCC-SF; Briere & Wherry, 2016), was utilized in conjunction with the PMI to explore occurrences of general trauma symptoms among respondents. The following four research questions were investigated:
- How do respondent demographics relate to PM?
- What is the rate of PM experience with respondents who are presently involved in an open CM case?
- What is the co-occurrence of PM among various forms of CM allegations?
- What is the relationship between the frequency of reported PM experiences and the frequency of general trauma symptoms?
Method
Study 1: PMI Item Development and Pilot
Following the steps of scale construction (Heppner et al., 2016), the initial version of the PMI used current literature and definitions from facilities nationwide that provide care for children who have experienced maltreatment and who are engaged with court systems, mental health agencies, or social services. Our lead researcher, Alison M. Boughn, developed a list of 20 items using category identifications from Glaser (2002) and APSAC (2019). Items were also created using Slep et al.’s (2015) proposed inclusion language for the Diagnostic and Statistical Manual of Mental Disorders (DSM-5) diagnostic codes and codes from the International Classification of Diseases, 11th edition (ICD-11) definition criteria (APA, 2013). Both Boughn and Daniel A. DeCino, our other researcher, reviewed items for consistency with the research literature and removed four redundant items. The final 16 items were reevaluated for readability for future child respondents using a web-based, age range–appropriate readability checker (Readable, n.d.) and were then presented to local SMEs in a content validity survey to determine which would be considered essential for children to report as part of a child PM assessment.
Expert Validation
A multidisciplinary team (MDT) serving as SMEs completed an online content validity survey created by Boughn. The survey was distributed by a Child Advocacy Center (CAC) manager to the MDT. Boughn used the survey results to validate the PMI’s item content relevance. Twenty respondents from the following professions completed the survey: mental health (n = 6), social services (n = 6), law enforcement (n = 3), and legal services (n = 5). The content validity ratio (CVR) was then calculated for the 16 proposed items.
Results. The content validity survey scale used a 3-point Likert-type scale: 0 = not necessary; 1 = useful, but not essential; and 2 = essential. A minimum of 15 of the 20 SMEs (75% of the sample), or a CVR ≥ .5, was required to deem an item essential (Lawshe, 1975). The significance level for each item’s content validity was set at α = .05 (Ayre & Scally, 2014). After conducting Lawshe’s (1975) CVR and applying the ratio correction developed by Ayre and Scally (2014), it was determined that eight items were essential: Item 2 (CVR = .7), Item 3 (CVR = .9), Item 4 (CVR = .6), Item 6 (CVR = .6), Item 7 (CVR = .8), Item 10 (CVR = .6), Item 15 (CVR = .5), and Item 16 (CVR = .6).
Upon further evaluation, and in an effort to ensure that the PMI items served the needs of interdisciplinary professionals, some items were rated essential for specific professions; these items still met the CVR requirements (CVR = 1) for the smaller within-group sample. These four items were unanimously endorsed by SMEs for a particular profession as essential: Item 5 (CVR Social Services = 1; CVR Law Enforcement = 1), Item 11 (CVR Law Enforcement = 1), Item 13 (CVR Law Enforcement = 1), and Item 14 (CVR Law Enforcement = 1).
Finally, an evaluation of the remaining four items was completed to explore if items were useful, but not essential. Using the minimum CVR ≥ .5, it was determined that these items should remain on the PMI: Item 1 (CVR = .9), Item 8 (CVR = .8), Item 9 (CVR = .9), and Item 12 (CVR = .9). The use of Siegle’s (2017) Reliability Calculator determined the Cronbach’s α level for the PMI to be 0.83, indicating adequate internal consistency. Additionally, a split-half (odd-even) correlation was completed with the Spearman-Brown adjustment of 0.88, indicating high reliability (Siegle, 2017).
Pilot Summary
The focus of the pilot study was to ensure effective implementation of the proposed research protocol following each respondent’s appointment at the CAC research site. The pilot was implemented to ensure research procedures did not interfere with typical appointments and standard procedures at the CAC. Participation in the PMI pilot was voluntary and no compensation was provided for respondents.
Sample. The study used a purposeful sample of children at a local, nationally accredited CAC in the Midwest; both the child and the child’s legal guardian agreed to participate. Because of the expected integration of PM with other forms of abuse, this population was selected to help create an understanding of how PM is experienced specifically with co-occurring cases of maltreatment. Respondents were children who (a) had an open CM case with social services and/or law enforcement, (b) were scheduled for an appointment at the CAC, and (c) were between the ages of 8 and 17.
Measures. The two measures implemented in this study were the developing PMI and the TSCC-SF. At the time of data collection, CAC staff implemented the TSCC-SF as a screening tool for referral services during CAC victim appointments. To ensure the research process did not interfere with chain-of-custody procedures, collected investigative testimony, or physical evidence that was obtained, the PMI was administered only after all normally scheduled CAC procedures were followed during appointments.
PMI. The current version of the PMI is a self-report measure that consists of 16 items on a 4-point Likert-type scale that mirrors the language of the TSCC-SF (0 = never to 3 = almost all the time). Respondents typically needed 5 minutes complete the PMI. Sample items from the PMI included questions like: “How often have you been told or made to feel like you are not important or unlovable?” The full instrument is not provided for use in this publication to ensure the PMI is not misused, as refinement of the PMI is still in progress.
TSCC-SF. In addition to the PMI, Boughn gathered data from the TSCC-SF (Briere & Wherry, 2016) because of its widespread use among clinicians to efficiently assess for sexual concerns, suicidal ideation frequency, and general trauma symptoms such as post-traumatic stress, depression, anger, disassociation, and anxiety (Wherry et al., 2013). The TSCC-SF measures a respondent’s frequency of perceived experiences and has been successfully implemented with children as young as 8 years old (Briere, 1996). The 20-item form uses a 4-point Likert-type scale (0 = never to 3 = almost all the time) composed of general trauma and sexual concerns subscales. The TSCC-SF has demonstrated high internal consistency and alpha values in the good to excellent ranges; it also has high intercorrelations between sexual concerns and other general trauma scales (Wherry & Dunlop, 2018).
Procedures. Respondents were recruited during their scheduled CAC appointment time. Each investigating agency (law enforcement or social services) scheduled a CAC appointment in accordance with an open maltreatment case. At the beginning of each respondent’s appointment, Boughn provided them with an introduction and description of the study. This included the IRB approvals from the hospital and university, an explanation of the informed consent and protected health information (PHI) authorization, and assent forms. Respondents aged 12 and older were asked to read and review the informed consent document with their legal guardian; respondents aged from 8 to 11 were provided an additional assent document to read. Respondents were informed they could stop the study at any time. After each respondent and legal guardian consented, respondents proceeded with their CAC appointment.
Typical CAC appointments consisted of a forensic interview, at times a medical exam, and administration of the TSCC-SF to determine referral needs. After these steps were completed, Boughn administered the PMI to those who agreed to participate in this research study. Following the completion of the TSCC-SF, respondents were verbally reminded of the study and asked if they were still willing to participate by completing the PMI. Willing respondents completed the PMI; afterward, Boughn asked respondents if they were comfortable leaving the assessment room. In the event the respondent voiced additional concerns of maltreatment during the PMI administration, Boughn made a direct report to the respondent’s investigator (i.e., law enforcement officer or social worker assigned to the respondent’s case).
Boughn accessed each respondent’s completed TSCC-SF from their electronic health record in accordance with the PHI authorization and consent after the respondent’s appointment. Data completed on the TSCC-SF allowed Boughn to gather information related to sexual concerns, suicidal ideation, and trauma symptomology. Data gathered from the TSCC-SF were examined with each respondent’s PMI responses.
Results. Respondents were 21 children (15 female, six male) with age ranges from 8 to 17 years with a median age of 12 years. Respondents described themselves as White (47.6%), Biracial (14.2%), Multiracial (14.2%), American Indian/Alaskan Native (10.0%), Black (10.0%), and Hispanic/Latino (5.0%). CM allegations for the respondents consisted of allegations of sexual abuse (86.0%), physical abuse (10.0%), and neglect (5.0%).
Every respondent’s responses were included in the analyses to ensure all maltreatment situations were considered. The reliability of the PMI observed in the pilot sample (N = 21) demonstrated high internal consistency with all 16 initial items (α = .88). The average total score on the PMI in the pilot was 13.29, with respondents’ scores ranging from 1 to 30. A Pearson correlation indicated total scores for the PMI and General Trauma Scale scores (reported on the TSCC-SF) were significantly correlated (r = .517, p < .05).
Study 2: Full Testing of the PMI
The next phase of research proceeded with the collection of a larger data sample (N = 166) to explore the item construct validity and internal reliability (Siyez et al., 2020). Study procedures, data collection, and data storage followed in the pilot study were also implemented with the larger sample. Boughn maintained tracking of respondents who did not want to participate in the study or were unable to because of cognitive functioning level, emergency situations, and emotional dysregulation concerns.
Sample
Based on a power analysis performed using the Raosoft (2004) sample size calculator, the large sample study required a minimum of 166 respondents for statistical significance (Ali, 2012; Heppner et al., 2016). The sample size was expected to account for a 10% margin of error and a 99% confidence level. The calculation of a 99% confidence interval was used to ensure the number of respondents could effectively represent the population accessed within the CAC based on the data from the CM Report (DHHS, 2018). Large sample population data was gathered between September 2018 and May 2019.
Measures
The PMI and TSCC-SF were also employed in Study 2 because of their successful implementation in the pilot. Administration of the TSCC-SF ensured a normed and standardized measure could aid in providing context to the information gathered on the PMI. No changes were made to the PMI or TSCC-SF measures following the review of procedures and analyses in the pilot.
Procedures
Recruitment and data collection/analyses processes mirrored that of the pilot study. Voluntary respondents were recruited at the CAC during their scheduled appointments. Respondents completed an informed consent, child assent, PHI authorization form, TSCC-SF, and PMI. Following the completion of data collection, Boughn completed data entry in the electronic health record to de-identify and analyze the results.
Results
Demographics
All data were analyzed using Statistical Package for the Social Sciences version 24 (SPSS-24). Initial data evaluation consisted of exploration of descriptive statistics, including demographic and criteria-based information related to respondents’ identities and case details. Respondents were between 8 to 17 years of age (M = 12.39) and primarily female (73.5%, n = 122), followed by male (25.3%, n = 42). Additionally, two respondents (n = 2) reported both male and female gender identities. Racial identities were marked by two categories: White (59.6%, n = 99) and Racially Diverse (40.4%, n = 67) respondents. The presenting maltreatment concerns and the child’s relationship to the offender are outlined in Table 1 and Table 2, respectively.
Reliability and Validity of the PMI
The reliability of the PMI observed in its implementation in Study 2 (N = 166) showed even better internal consistency with all 16 initial items (α =.91) than observed in the pilot. Using the Spearman-Brown adjustment (Warner, 2013), split-half reliability was calculated, indicating high internal reliability (.92). Internal consistencies were calculated using gender identity and age demographic variables (see Table 3).
Table 1
Child Maltreatment Allegation by Type (N = 166)
| Allegation |
f |
Rel f |
cf |
% |
| Sexual Abuse |
113 |
0.68 |
166 |
68.07 |
| Physical Abuse |
29 |
0.17 |
53 |
17.47 |
| Neglect |
14 |
0.08 |
24 |
8.43 |
| Multiple Allegations |
6 |
0.04 |
10 |
3.61 |
| Witness to Violence |
3 |
0.02 |
4 |
1.81 |
| Kidnapping |
1 |
0.01 |
1 |
0.60 |
Note. Allegation type reported at initial appointment scheduling
Table 2
Identified Offender by Relationship to Victim (N = 166)
| Offender Relationship |
f |
Rel f |
cf |
% |
| Other Known Adult |
60 |
0.36 |
166 |
36.14 |
| Parent |
48 |
0.29 |
106 |
28.92 |
| Other Known Child (≤ age 15 years) |
15 |
0.09 |
58 |
9.04 |
| Sibling-Child (≤ age 15 years) |
10 |
0.06 |
43 |
6.02 |
| Unknown Adult |
9 |
0.05 |
33 |
5.42 |
| Step-Parent |
8 |
0.05 |
24 |
4.82 |
| Multiple Offenders |
6 |
0.04 |
16 |
3.61 |
| Grandparent |
6 |
0.04 |
10 |
3.61 |
| Sibling-Adult (≥ age 16 years) |
3 |
0.02 |
4 |
1.81 |
| Unknown Child (≤ age 15 years) |
1 |
0.01 |
1 |
0.60 |
Note. Respondent knew the offender (n =156); Respondent did not know offender (n =10)
Table 3
Internal Consistency Coefficients (α) by Gender Identity and Age (N = 166)
| Gender |
n |
α |
M |
SD |
| Female |
122 |
0.90 |
13.2 |
9.1 |
| Male |
42 |
0.94 |
13.5 |
11.0 |
| Male–Female |
2 |
0.26 |
8.5 |
2.5 |
| Age |
|
|
|
|
| 8–12 |
83 |
0.92 |
12.75 |
10.06 |
| 13–17 |
83 |
0.90 |
13.69 |
9.01 |
Note. SD = Standard Deviation; M = Mean
Respondents’ Demographic Characteristics and PM Experiences
For Research Question (RQ) 1 and RQ2, descriptive data were used to generate frequencies and determine the impact of demographic characteristics on average PMI score. To explore this further in RQ1, one-way ANOVAs were completed for the variables of age, gender, racial identity, allegation type, and offender relationships. No significant correlations were found between demographic variables and the PMI items. On average, respondents reported a frequency score of 13.5 (M = 13.5, SD = 9.5) on the PMI. Eight respondents (5%) endorsed no frequency of PM while 95% (N = 158) experienced PM.
Co-Occurrence of PM With Other Forms of Maltreatment
For RQ3, frequency and descriptive data were generated, revealing average age rates of PM reported by maltreatment type. Varying sample representations were discovered in each form of maltreatment (see Table 4). Clear evidence was found that PM co-occurs with each form of maltreatment type; however, how each form of maltreatment interacts with PM is currently unclear given the multiple dimensions of each maltreatment case including, but not limited to, severity, frequency, offender, and victim characteristics.
Table 4
Descriptive and Frequency Data for Co-Occurrence of PM (N = 166)
| Allegation |
n |
M |
SD |
95% CI |
| Sexual Abuse |
113 |
13.04 |
9.01 |
[11.37, 14.72] |
| Physical Abuse |
29 |
12.45 |
10.53 |
[8.44, 16.45] |
| Neglect |
14 |
14.57 |
12.16 |
[7.55, 21.60] |
| Multiple Allegations |
5 |
17.40 |
8.88 |
[6.38, 28.42] |
| Witness to Violence |
3 |
7.67 |
5.03 |
[–4.84, 20.17] |
| Kidnapping |
1 |
n/a |
n/a |
Missing |
Note. CI = Confidence Interval; SD = Standard Deviation; M = Mean; n/a = not applicable
PM Frequency and General Trauma Symptoms
For RQ4, Pearson’s correlation was used to calculate frequency score relationships between the PMI and TSCC-SF. There was a statistically significant relationship between the PMI and total frequency of general trauma symptoms on the TSCC-SF [r(164) = .78, p < .01, r² = .61] (Sullivan & Feinn, 2012). Cohen’s d, calculated from the means for each item as well as the pooled standard deviation, indicated a small effect relationship (d = .15) between general trauma and PMI frequencies (see Figure 1).
Figure 1
Correlation Between PMI and TSCC-SF General Trauma Subscale
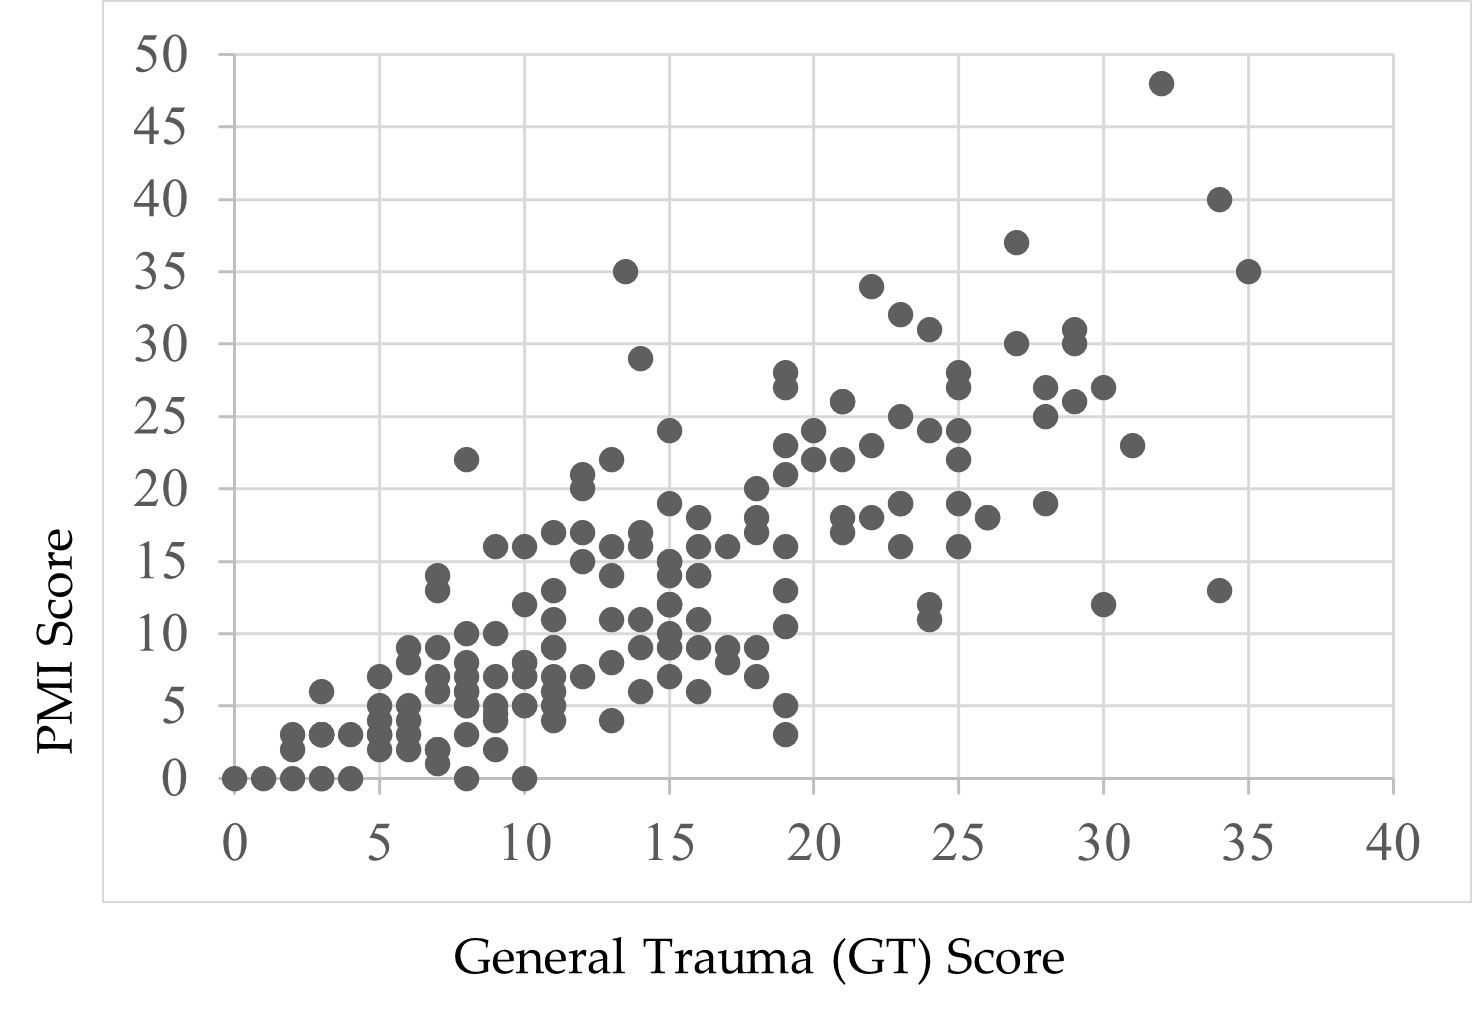
Note. Scores were endorsed by respondents’ self-reports.
Child Suicidal Ideation Reports and the PMI
Following a review of the findings of Thompson et al. (2005) and Wherry et al. (2013) that children who reported experiencing CM also experienced suicidal ideation, Boughn performed an additional two-way ANOVA that examined the effect of suicidal ideation on the PMI total score. A significant relationship—F(1, 164) = 49.52, p < .01, η2 = .23—between respondents’ PMI scores and thoughts of suicide was found. Respondents who did not report thoughts of suicide (59.0%, n = 98) indicated lower rates of PM (M = 9.37, SD = 7.97) compared to children who did report thoughts of suicide (41.0%, n = 68, M = 18.77, SD = 9.12). A preliminary review of this finding demonstrates the severity of PM’s impact on child victims.
Discussion
This study was designed with the aim of developing a tool to support accurate identification of PM among children and adolescents. Findings from its first large-scale implementation provide a foundational view to the occurrence of PM in terms of demographic characteristics, comorbidity of PM with other forms of abuse, and the relationship between PM and trauma. The analyses yielded both expected and unexpected results based on the extant research.
PM and Demographic Characteristics
Race
There was no significant effect when exploring the data related to racial demographics and PM. The respondent sample closely reflected the geographical area’s known racial demographics at the time of the study, reflecting a population approaching 80% White with residents of all other known races below 5% for each racial group (U.S. Census Bureau, 2020). Although researchers (Dakil et al., 2011) anticipated children identifying as racial minorities would be included in the representation of CM reports, evidence from this study potentially reveals a greater than expected gap in reporting for minority-race populations (Bernard & Harris, 2018; Font & Maguire-Jack, 2015). This suggests that there may be additional, unidentified barriers influencing the reporting of maltreatment among minority-race populations.
Gender
A lack of gender identity representation was evident in the data, consistent with prior research (Sivagurunathan et al., 2019). Respondents who self-identified with both male and female gender identities (1.2%) and as male (25.3%) were represented less frequently compared to female respondents (73.5%). This is not inherently a limitation of this study, as research shows that just 10% of males in the United States report their sexual abuse (Sivagurunathan et al., 2019). People who identify as male may face harmful cultural messages that enhance negative stigma for victims of abuse, causing increased feelings of weakness or vulnerability (Alaggia & Mishna, 2014). This finding may support claims that male trauma survivors feel stigmatized and report their experiences less frequently (Easton, 2012).
Additionally, children who identify outside traditional gender binary norms and definitions need more access to inclusive representation on screening assessments. Assessments like the TSCC-SF may be using antiquated gender- or biological sex–normed checkboxes, which leave certain groups underrepresented in research studies (Neukrug & Fawcett, 2015). These practices may present inaccurate findings, inadvertently reinforce discriminatory expectations, and generate inaccurate referrals. Non-binary youth encounter barriers that may compound their ability to effectively access supports in their daily life related to coming out, social violence, lack of peer and/or adult acceptance, discrimination, isolation, higher rates of suicide, and lack of representation in mainstream society (Bialer & McIntosh, 2016; Zimman, 2009). In this study, representation of non-binary respondents, specifically those who reported both male and female gender identities, was reported; this warrants further exploration to assess barriers among non-binary gender youth and their experiences with child PM (Bos et al., 2019).
Offender Relationships
Frequency data for a child’s relationship with the offender were not found to be significant either for known offenders (M = 13.35) or unknown offenders (M = 11.2). In this study, 94% of the respondents already knew their offender (n = 156). This finding is consistent with previous research that has found that although child abduction and stranger danger are real phenomena, children are more likely to experience CM as a result of relationships with familiar individuals (Walsh & Brandon, 2011).
Co-Occurrence of PM With Other Abuse
Only eight respondents (5%) endorsed no frequency of PM; the average total PM frequency rate for respondents in this study was 13.5 out of a possible 48, indicating extreme severity. In this study, we found evidence that PM is a co-occurring experience for children with open maltreatment cases, yet clinicians still lack formal, valid assessments to determine PM alone. Our findings support the National Children’s Alliance’s (NCA; 2016) call for clinicians to follow practice guidelines in accordance with state and national guidelines as they relate to mandatory reporting of CM concerns and determination of whether PM plus other forms of maltreatment may be present for child victims seeking services.
Comorbidity of PM and Trauma
PM-related experiences on the PMI and general trauma symptoms from the TSCC-SF warrant discussion. The PMI illustrated a significant relationship with the TSCC-SF general trauma subscale (Briere & Wherry, 2016). More than half (61%) of the variance on the PMI was connected to general trauma symptoms, suggesting that higher rates of PM experiences may increase trauma-related symptoms. For example, previous researchers have found adverse childhood experiences and signs of trauma-related symptoms lead to serious mental health diagnoses, early mortality, and/or significant biological health risks in children (Tyrka et al., 2013; Vachon et al., 2015; Zimmerman & Mercy, 2010). Further exploration to determine if and how PM influences other trauma-related symptoms in children throughout their life span would expand upon the results of this study.
Suicidal Ideation
Finally, our data revealed a significant effect between respondent endorsement of suicidal ideation and PMI total scores. PM experiences accounted for 23% of the variance for children who reported thoughts of suicide (41%, n = 68) compared to those who did not report thoughts of suicide (59%, n = 98). This finding is consistent with prior research exploring children’s experiences with maltreatment and suicidal thoughts (Thompson et al., 2005; Wherry et al., 2013).
Limitations
This study has several limitations. First, by developing the PMI using national definitions, some regional and localized nuances were not considered. Second, data collected for this study were from a single Midwest CAC; thus, the data are limited in geographic generalizability. Third, the majority of respondents were White, and a more diverse sample would have been more representative of the region in which data were collected. Fourth, 99% of respondents identified as either male or female and may reflect an underrepresentation of non-binary or gender fluid youth in the results of this study. Fifth, this study relied heavily on quantitative data, which limited the ability to analyze each individual’s experiences with PM as they might describe from their unique perspectives.
Implications for Research and Practice
The results of this study provide several areas for future research. While the PMI demonstrated good internal consistency across all items (α =.91), more research with diverse populations across the United States is needed. Research from other geographical locations may demonstrate how reporting patterns for PM interact with ethnicity, culture, and elements of social expectations (Spinazzola et al., 2014).
The initial results of this study indicate the PMI may be a useful tool for children to report PM experiences in CAC settings; however, future research at other CACs and similar treatment facilities is needed to determine the PMI’s true utility and scalability. Future analysis (i.e., exploratory factor analysis and confirmatory factor analysis) of the PMI may also identify factors and help refine the instrument.
More research with the PMI can expand researchers’ knowledge of PM and services needed to help children. Working with other CACs, child protection professionals, and the NCA may help bridge current gaps in interdisciplinary assessment and care and establish a stable and comprehensive understanding of PM (López et al., 2015). Furthermore, understanding how CACs are equipped to identify and handle PM cases may provide useful insights to help improve services for children in need. Although some CACs may have a variety of professionals working in specific roles, some CACs may be understaffed, causing staff to take on multiple and overlapping roles. It is important to understand if and how different combinations of trained professionals influence children reporting PM (Hart & Glaser, 2011; NCA, 2016).
More research with the PMI is needed for refinement and to ensure the instrument is not misused. Releasing the PMI at this stage to clinicians and researchers without a fully developed assessment manual may lead to inappropriate or ineffective administration of the PMI and potentially unethical practice that could place children at risk. Future research and refinement of the PMI may provide clinicians and researchers a reliable and valid tool that is grounded in consistent theory and practice.
Conclusion
The PMI was developed to assess child PM and offers researchers and clinicians useful findings. In supporting research (Arslan, 2017; Bernstein et al., 2013; Raparia et al., 2016), child PM is a serious and often harmful combination of experiences that requires professional intervention (APSAC, 2019). For children reporting PM experiences, the PMI may help mental health and other care providers determine which services are needed. Findings from this study suggest differences in demographic variables are minimal for PM. Overall PMI scores were correlated to the general trauma subscale on the TSCC-SF, and the PMI revealed higher rates of PM for children experiencing suicidal ideation. The findings are the beginning of a measure designed to illustrate the depth and frequency of PM for children. With the PMI, early PM intervention becomes possible for a once invisible form of maltreatment.
Conflict of Interest and Funding Disclosure
Data collected and content shared in this study
were part of a dissertation study, which was
awarded the 2020 Dissertation Excellence Award
by the National Board for Certified Counselors.
The Psychological Maltreatment Inventory (PMI)
items were not released in this publication to protect
victims of child maltreatment and to ensure future
publications can address comprehensive revisions
made to the PMI.
References
Ahern, E. C., Hershkowitz, I., Lamb, M. E., Blasbalg, U., & Winstanley, A. (2014). Support and reluctance in the pre-substantive phase of alleged child abuse victim investigative interviews: Revised versus standard NICHD protocols. Behavioral Sciences & the Law, 32(6), 762–774. https://doi.org/10.1002/bsl.2149
Alaggia, R., & Mishna, F. (2014). Self psychology and male child sexual abuse: Healing relational betrayal. Clinical Social Work Journal, 42(1), 41–48. https://doi.org/10.1007/s10615-013-0453-2
Ali, S. A. (2012). Sample size calculation and sampling techniques. Journal of the Pakistan Medical Association, 62(6), 624–626. https://jpma.org.pk/PdfDownload/3482
American Professional Society on the Abuse of Children. (2019). APSAC practice guidelines: The investigation and determination of suspected psychological maltreatment of children and adolescents. https://bit.ly/3jI7AhJ
American Psychiatric Association. (2013). Diagnostic and statistical manual of mental disorders (5th ed.).
Arslan, G. (2017). Psychological maltreatment, coping strategies, and mental health problems: A brief and effective measure of psychological maltreatment in adolescents. Child Abuse & Neglect, 68, 96–106. https://doi.org/10.1016/j.chiabu.2017.03.023
Ayre, C., & Scally, A. J. (2014). Critical values for Lawshe’s content validity ratio: Revisiting the original methods of calculation. Measurement and Evaluation in Counseling and Development, 47(1), 79–86. https://doi.org/10.1177%2F0748175613513808
Bernard, C., & Harris, P. (2018). Serious case reviews: The lived experience of Black children. Child & Family Social Work, 24(2), 256–263. https://doi.org/10.1111/cfs.12610
Bernstein, R. E., Measelle, J. R., Laurent, H. K., Musser, E. D., & Ablow, J. C. (2013). Sticks and stones may break my bones but words relate to adult physiology? Child abuse experience and women’s sympathetic nervous system response while self-reporting trauma. Journal of Aggression, Maltreatment & Trauma, 22(10), 1117–1136. https://doi.org/10.1080/10926771.2013.850138
Bialer, P. A., & McIntosh, C. A. (2016). Discrimination, stigma, and hate: The impact on the mental health and well-being of LGBT people. Journal of Gay & Lesbian Mental Health, 20(4), 297–298. https://doi.org/10.1080/19359705.2016.1211887
Bos, H., de Haas, S., & Kuyper, L. (2019). Lesbian, gay, and bisexual adults: Childhood gender nonconformity, childhood trauma, and sexual victimization. Journal of Interpersonal Violence, 34(3), 496–515. https://doi.org/10.1177%2F0886260516641285
Briere, J. (1996). Trauma Symptom Checklist for Children (TSCC), professional manual. Psychological Assessment Resources.
Briere, J., & Wherry, J. (2016). Development and validation of the TSCC Screening Form (TSCC-SF) and TSCYC Screening Form (TSCYC-SF). Psychological Assessment Resources.
Brown, S. M., Bender, K., Orsi, R., McCrae, J. S., Phillips, J. D., & Rienks, S. (2019). Adverse childhood experiences and their relationship to complex health profiles among child welfare–involved children: A classification and regression tree analysis. Health Services Research, 54(4), 902–911. https://doi.org/10.1111/1475-6773.13166
Centers for Disease Control. (2012). Child abuse and neglect cost the United States $124 billion [Press release]. https://bit.ly/3jYbpAF
Dakil, S. R., Cox, M., Lin, H., & Flores, G. (2011). Racial and ethnic disparities in physical abuse reporting and Child Protective Services interventions in the United States. Journal of the National Medical Association, 103(9–10), 926–931. https://doi.org/10.1016/S0027-9684(15)30449-1
Easton, S. D. (2012). Disclosure of child sexual abuse among adult male survivors. Clinical Social Work Journal, 41, 344–355. https://doi.org/10.1007/s10615-012-0420-3
Fang, X., Brown, D. S., Florence, C. S., & Mercy, J. A. (2012). The economic burden of child maltreatment in the United States and implications for prevention. Child Abuse & Neglect, 36(2), 156–165. https://doi.org/10.1016/j.chiabu.2011.10.006
Felitti, V. J., Anda, R. F., Nordenberg, D., Williamson, D. F., Spitz, A. M., Edwards, V., Koss, M. P., & Marks, J. S. (1998). Relationship of childhood abuse and household dysfunction to many of the leading causes of death in adults: The Adverse Childhood Experiences (ACE) study. American Journal of Preventive Medicine, 14(4), 245–258. https://doi.org/10.1016/S0749-3797(98)00017-8
Field, T. A., Jones, L. K., & Russell-Chapin, L. A. (Eds.). (2017). Neurocounseling: Brain-based clinical approaches. American Counseling Association.
Font, S. A., & Maguire-Jack, K. (2015). Decision-making in Child Protective Services: Influences at multiple levels of the social ecology. Child Abuse & Neglect, 47, 70–82. https://doi.org/10.1016/j.chiabu.2015.02.005
Glaser, D. (2002). Emotional abuse and neglect (psychological maltreatment): A conceptual framework. Child Abuse & Neglect, 26(6–7), 697–714. https://doi.org/10.1016/S0145-2134(02)00342-3
Greenfield, E. A., & Marks, N. F. (2010). Identifying experiences of physical and psychological violence in childhood that jeopardize mental health in adulthood. Child Abuse & Neglect, 34(3), 161–171. https://doi.org/10.1016/j.chiabu.2009.08.012
Hart, S. N., & Glaser, D. (2011). Psychological maltreatment – Maltreatment of the mind: A catalyst for advancing child protection toward proactive primary prevention and promotion of personal well-being. Child Abuse & Neglect, 35(10), 758–766. https://doi.org/10.1016/j.chiabu.2011.06.002
Heppner, P. P., Wampold, B. E., Owen, J., Thompson, M. N., & Wang, K. T. (2016). Research design in counseling (4th ed.). Cengage.
Iwaniec, D. (2006). The emotionally abused and neglected child: Identification, assessment and intervention: A practice handbook (2nd ed.). Wiley.
Klika, J. B., & Conte, J. R. (Eds.). (2017). The APSAC handbook on child maltreatment (4th ed.). SAGE.
Lawshe, C. H. (1975). A quantitative approach to content validity. Personnel Psychology, 28(4), 563–575. https://doi.org/10.1111/j.1744-6570.1975.tb01393.x
López, M., Fluke, J. D., Benbenishty, R., & Knorth, E. J. (2015). Commentary on decision-making and judgments in child maltreatment prevention and response: An overview. Child Abuse & Neglect, 49, 1–11. https://doi.org/10.1016/j.chiabu.2015.08.013
Maguire, S. A., Williams, B., Naughton, A. M., Cowley, L. E., Tempest, V., Mann, M. K., Teague, M., & Kemp, A. M. (2015). A systematic review of the emotional, behavioural and cognitive features exhibited by school-aged children experiencing neglect or emotional abuse. Child: Care, Health and Development, 41(5), 641–653. https://doi.org/10.1111/cch.12227
Marshall, N. A. (2012). A clinician’s guide to recognizing and reporting parental psychological maltreatment of children. Professional Psychology: Research and Practice, 43(2), 73–79. https://doi.org/10.1037/a0026677
Mills, R., Scott, J., Alati, R., O’Callaghan, M., Najman, J. M., & Strathearn, L. (2013). Child maltreatment and adolescent mental health problems in a large birth cohort. Child Abuse & Neglect, 37(5), 292–302. https://doi.org/10.1016/j.chiabu.2012.11.008
National Children’s Alliance. (2016). Putting standards into practice: A guide to implementing the 2017 standards for accredited members (revised 2016). http://www.nationalchildrensalliance.org/wp-content/uploads/2015/06/NCA2017-StandardsIntoPractice-web.pdf
Neukrug, E. S., & Fawcett, R. C. (2015). The essentials of testing and assessment: A practical guide for counselors, social workers, and psychologies, enhanced (3rd ed.). Cengage.
Peterson, C., Florence, C., & Klevens, J. (2018). The economic burden of child maltreatment in the United States, 2015. Child Abuse & Neglect, 86, 178–183.
https://doi.org/10.1016/j.chiabu.2018.09.018
Porges, S. W. (2011). The polyvagal theory: Neurophysiological foundations of emotions, attachment, communication, and self-regulation. W. W. Norton.
Raosoft. (2004). Sample size calculator. http://www.raosoft.com/samplesize.html
Raparia, E., Coplan, J. D., Abdallah, C. G., Hof, P. R., Mao, X., Mathew, S. J., & Shungu, D. C. (2016). Impact of childhood emotional abuse on neocortical neurometabolites and complex emotional processing in patients with generalized anxiety disorder. Journal of Affective Disorders, 190, 414–423. https://doi.org/10.1016/j.jad.2015.09.019
Readable. (n.d.). https://readable.com
Siegle, R. (2017). Educational research basics: Excel spreadsheet to calculate instrument reliability estimates. https://researchbasics.education.uconn.edu/excel-spreadsheet-to-calculate-instrument-reliability-estimates
Sivagurunathan, M., Orchard, T., & Evans, M. (2019). Barriers to utilization of mental health services amongst male child sexual abuse survivors: Service providers’ perspective. Journal of Child Sexual Abuse, 28(7), 819–839. https://doi.org/10.1080/10538712.2019.1610823
Siyez, D. M., Esen, E., Seymenler, S., & Öztürk, B. (2020). Development of wellness scale for emerging adults: Validity and reliability study. Current Psychology.
https://doi.org/10.1007/s12144-020-00672-w
Slep, A. M. S., Heyman, R. E., & Foran, H. M. (2015). Child maltreatment in DSM-5 and ICD-11. Family Process, 54(1), 17–32. https://doi.org/10.1111/famp.12131
Spinazzola, J., Hodgdon, H., Liang, L.-J., Ford, J. D., Layne, C. M., Pynoos, R., Briggs, E. C., Stolbach, B., & Kisiel, C. (2014). Unseen wounds: The contribution of psychological maltreatment to child and adolescent mental health and risk outcomes. Psychological Trauma: Theory, Research, Practice, and Policy, 6(Suppl 1), S18–S28. https://doi.org/10.1037/a0037766
Sullivan, G. M., & Feinn, R. (2012). Using effect size—or why the p value is not enough. Journal of Graduate Medical Education, 4(3), 279–282. https://doi.org/10.4300/JGME-D-12-00156.1
Thompson, R., Briggs, E., English, D. J., Dubowitz, H., Lee, L.-C., Brody, K., Everson, M. D., & Hunter, W. M. (2005). Suicidal ideation among 8-year-olds who are maltreated and at risk: Findings from the LONGSCAN studies. Child Maltreatment, 10(1), 26–36. https://doi.org/10.1177%2F1077559504271271
Tonmyr, L., Draca, J., Crain, J., & MacMillian, H. L. (2011). Measurement of emotional/psychological child maltreatment: A review. Child Abuse & Neglect, 35(10), 767–782.
https://doi.org/10.1016/j.chiabu.2011.04.011
Tyrka, A. R., Burgers, D. E., Philip, N. S., Price, L. H., & Carpenter, L. L. (2013). The neurobiological correlates of childhood adversity and implications for treatment. Acta Psychiatrica Scandinavica, 128(6), 434–447. https://doi.org/10.1111/acps.12143
U.S. Census Bureau. (2020). Quick facts. https://www.census.gov
U.S. Department of Health & Human Services. (2018). Child maltreatment 2016 (27th ed.). https://www.acf.hhs.gov/sites/default/files/documents/cb/cm2016.pdf
Vachon, D. D., Krueger, R. F., Rogosch, F. A., & Cicchetti, D. (2015). Assessment of the harmful psychiatric and behavioral effects of different forms of child maltreatment. JAMA Psychiatry, 72(11), 1135–1142. https://doi.org/10.1001/jamapsychiatry.2015.1792
van der Kolk, B. (2014). The body keeps the score: Brain, mind, and body in the healing of trauma. Penguin Books.
van Harmelen, A.-L., Elzinga, B. M., Kievit, R. A., & Spinhoven, P. (2011). Intrusions of autobiographical memories in individuals reporting childhood emotional maltreatment. European Journal of Psychotraumatology, 2(1), 7336. https://doi.org/10.3402/ejpt.v2i0.7336
van Harmelen, A.-L., van Tol, M.-J., van der Wee, N. J. A., Veltman, D. J., Aleman, A., Spinhoven, P., van Buchem, M. A., Zitman, F. G., Penninx, B. W. J. H., & Elzinga, B. M. (2010). Reduced medial prefrontal cortex volume in adults reporting childhood emotional maltreatment. Biological Psychiatry, 68(9), 832–838. https://doi.org/10.1016/j.biopsych.2010.06.011
Walsh, K., & Brandon, L. (2011). Their children’s first educators: Parents’ views about child sexual abuse prevention education. Journal of Child and Family Studies, 21, 734–746.
https://doi.org/10.1007/s10826-011-9526-4
Warner, R. M. (2013). Applied statistics: From bivariate through multivariate techniques (2nd ed.). SAGE.
Wherry, J. N., Baldwin, S., Junco, K., & Floyd, B. (2013). Suicidal thoughts/behaviors in sexually abused children. Journal of Child Sexual Abuse, 22(5), 534–551. https://doi.org/10.1080/10538712.2013.800938
Wherry, J. N., & Dunlop, C. E. (2018). TSCC and TSCYC screening forms in a clinical sample: Reliability, validity, and creating local clinical norms. Child Maltreatment, 23(1), 74–84.
https://doi.org/10.1177%2F1077559517725207
Zimman, L. (2009). ‘The other kind of coming out’: Transgender people and the coming out narrative genre. Gender and Language, 3(1), 53–80. https://doi.org/10.1558/genl.v3i1.53
Zimmerman, F., & Mercy, J. (2010). A better start: Child maltreatment prevention as a public
health priority. Zero to Three, 30(5), 4–10.
Alison M. Boughn, PhD, NCC, LIMHP (NE), LMHC (IA), LPC-MH (SD), ATR-BC, QMHP, TF-CBT, is an assistant professor and counseling department chair at Wayne State College. Daniel A. DeCino, PhD, NCC, LPC, is an assistant professor and Interim Program Coordinator at the University of South Dakota. Correspondence may be addressed to Alison M. Boughn, Wayne State College, 1111 Main Street, Wayne, NE 68787, albough1@wsc.edu.
Aug 20, 2021 | Author Videos, Volume 11 - Issue 3
Warren N. Ponder, Elizabeth A. Prosek, Tempa Sherrill
First responders are continually exposed to trauma-related events. Resilience is evidenced as a protective factor for mental health among first responders. However, there is a lack of assessments that measure the construct of resilience from a strength-based perspective. The present study used archival data from a treatment-seeking sample of 238 first responders to validate the 22-item Response to Stressful Experiences Scale (RSES-22) and its abbreviated version, the RSES-4, with two confirmatory factor analyses. Using a subsample of 190 first responders, correlational analyses were conducted of the RSES-22 and RSES-4 with measures of depressive symptoms, post-traumatic stress, anxiety, and suicidality confirming convergent and criterion validity. The two confirmatory analyses revealed a poor model fit for the RSES-22; however, the RSES-4 demonstrated an acceptable model fit. Overall, the RSES-4 may be a reliable and valid measure of resilience for treatment-seeking first responder populations.
Keywords: first responders, resilience, assessment, mental health, confirmatory factor analysis
First responder populations (i.e., law enforcement, emergency medical technicians, and fire rescue) are often repeatedly exposed to traumatic and life-threatening conditions (Greinacher et al., 2019). Researchers have concluded that such critical incidents could have a deleterious impact on first responders’ mental health, including the development of symptoms associated with post-traumatic stress, anxiety, depression, or other diagnosable mental health disorders (Donnelly & Bennett, 2014; Jetelina et al., 2020; Klimley et al., 2018; Weiss et al., 2010). In a systematic review, Wild et al. (2020) suggested the promise of resilience-based interventions to relieve trauma-related psychological disorders among first responders. However, they noted the operationalization and measure of resilience as limitations to their intervention research. Indeed, researchers have conflicting viewpoints on how to define and assess resilience. For example, White et al. (2010) purported popular measures of resilience rely on a deficit-based approach. Counselors operate from a strength-based lens (American Counseling Association [ACA], 2014) and may prefer measures with a similar perspective. Additionally, counselors are mandated to administer assessments with acceptable psychometric properties that are normed on populations representative of the client (ACA, 2014, E.6.a., E.7.d.). For counselors working with first responder populations, resilience may be a factor of importance; however, appropriately measuring the construct warrants exploration. Therefore, the focus of this study was to validate a measure of resilience with strength-based principles among a sample of first responders.
Risk and Resilience Among First Responders
In a systematic review of the literature, Greinacher et al. (2019) described the incidents that first responders may experience as traumatic, including first-hand life-threatening events; secondary exposure and interaction with survivors of trauma; and frequent exposure to death, dead bodies, and injury. Law enforcement officers (LEOs) reported that the most severe critical incidents they encounter are making a mistake that injures or kills a colleague; having a colleague intentionally killed; and making a mistake that injures or kills a bystander (Weiss et al., 2010). Among emergency medical technicians (EMTs), critical incidents that evoked the most self-reported stress included responding to a scene involving family, friends, or others to the crew and seeing someone dying (Donnelly & Bennett, 2014). Exposure to these critical incidents may have consequences for first responders. For example, researchers concluded first responders may experience mental health symptoms as a result of the stress-related, repeated exposure (Jetelina et al., 2020; Klimley et al., 2018; Weiss et al., 2010). Moreover, considering the cumulative nature of exposure (Donnelly & Bennett, 2014), researchers concluded first responders are at increased risk for post-traumatic stress disorder (PTSD), depression, and generalized anxiety symptoms (Jetelina et al., 2020; Klimley et al., 2018; Weiss et al., 2010). Symptoms commonly experienced among first responders include those associated with post-traumatic stress, anxiety, and depression.
In a collective review of first responders, Kleim and Westphal (2011) determined a prevalence rate for PTSD of 8%–32%, which is higher than the general population lifetime rate of 6.8–7.8 % (American Psychiatric Association [APA], 2013; National Institute of Mental Health [NIMH], 2017). Some researchers have explored rates of PTSD by specific first responder population. For example, Klimley et al. (2018) concluded that 7%–19% of LEOs and 17%–22% of firefighters experience PTSD. Similarly, in a sample of LEOs, Jetelina and colleagues (2020) reported 20% of their participants met criteria for PTSD.
Generalized anxiety and depression are also prevalent mental health symptoms for first responders. Among a sample of firefighters and EMTs, 28% disclosed anxiety at moderate–severe and several levels (Jones et al., 2018). Furthermore, 17% of patrol LEOs reported an overall prevalence of generalized anxiety disorder (Jetelina et al., 2020). Additionally, first responders may be at higher risk for depression (Klimley et al., 2018), with estimated prevalence rates of 16%–26% (Kleim & Westphal, 2011). Comparatively, the past 12-month rate of major depressive disorder among the general population is 7% (APA, 2013). In a recent study, 16% of LEOs met criteria for major depressive disorder (Jetelina et al., 2020). Moreover, in a sample of firefighters and EMTs, 14% reported moderate–severe and severe depressive symptoms (Jones et al., 2018). Given these higher rates of distressful mental health symptoms, including post-traumatic stress, generalized anxiety, and depression, protective factors to reduce negative impacts are warranted.
Resilience
Broadly defined, resilience is “the ability to adopt to and rebound from change (whether it is from stress or adversity) in a healthy, positive and growth-oriented manner” (Burnett, 2017, p. 2). White and colleagues (2010) promoted a positive psychology approach to researching resilience, relying on strength-based characteristics of individuals who adapt after a stressor event. Similarly, other researchers explored how individuals’ cognitive flexibility, meaning-making, and restoration offer protection that may be collectively defined as resilience (Johnson et al., 2011).
A key element among definitions of resilience is one’s exposure to stress. Given their exposure to trauma-related incidents, first responders require the ability to cope or adapt in stressful situations (Greinacher et al., 2019). Some researchers have defined resilience as a strength-based response to stressful events (Burnett, 2017), in which healthy coping behaviors and cognitions allow individuals to overcome adverse experiences (Johnson et al., 2011; White et al., 2010). When surveyed about positive coping strategies, first responders most frequently reported resilience as important to their well-being (Crowe et al., 2017).
Researchers corroborated the potential impact of resilience for the population. For example, in samples of LEOs, researchers confirmed resilience served as a protective factor for PTSD (Klimley et al., 2018) and as a mediator between social support and PTSD symptoms (McCanlies et al., 2017). In a sample of firefighters, individual resilience mediated the indirect path between traumatic events and global perceived stress of PTSD, along with the direct path between traumatic events and PTSD symptoms (Lee et al., 2014). Their model demonstrated that those with higher levels of resilience were more protected from traumatic stress. Similarly, among emergency dispatchers, resilience was positively correlated with positive affect and post-traumatic growth, and negatively correlated with job stress (Steinkopf et al., 2018). The replete associations of resilience as a protective factor led researchers to develop resilience-based interventions. For example, researchers surmised promising results from mindfulness-based resilience interventions for firefighters (Joyce et al., 2019) and LEOs (Christopher et al., 2018). Moreover, Antony and colleagues (2020) concluded that resilience training programs demonstrated potential to reduce occupational stress among first responders.
Assessment of Resilience
Recognizing the significance of resilience as a mediating factor in PTSD among first responders and as a promising basis for interventions when working with LEOs, a reliable means to measure it among first responder clients is warranted. In a methodological review of resilience assessments, Windle and colleagues (2011) identified 19 different measures of resilience. They found 15 assessments were from original development and validation studies with four subsequent validation manuscripts from their original assessment, of which none were developed with military or first responder samples.
Subsequently, Johnson et al. (2011) developed the Response to Stressful Experiences Scale (RSES-22) to assess resilience among military populations. Unlike deficit-based assessments of resilience, they proposed a multidimensional construct representing how individuals respond to stressful experiences in adaptive or healthy ways. Cognitive flexibility, meaning-making, and restoration were identified as key elements when assessing for individuals’ characteristics connected to resilience when overcoming hardships. Initially they validated a five-factor structure for the RSES-22 with military active-duty and reserve components. Later, De La Rosa et al. (2016) re-examined the RSES-22. De La Rosa and colleagues discovered a unidimensional factor structure of the RSES-22 and validated a shorter 4-item subset of the instrument, the RSES-4, again among military populations.
It is currently unknown if the performance of the RSES-4 can be generalized to first responder populations. While there are some overlapping experiences between military populations and first responders in terms of exposure to trauma and high-risk occupations, the Substance Abuse and Mental Health Services Administration (SAMHSA; 2018) suggested differences in training and types of risk. In the counseling profession, these populations are categorized together, as evidenced by the Military and Government Counseling Association ACA division. Additionally, there may also be dual identities within the populations. For example, Lewis and Pathak (2014) found that 22% of LEOs and 15% of firefighters identified as veterans. Although the similarities of the populations may be enough to theorize the use of the same resilience measure, validation of the RSES-22 and RSES-4 among first responders remains unexamined.
Purpose of the Study
First responders are repeatedly exposed to traumatic and stressful events (Greinacher et al., 2019) and this exposure may impact their mental health, including symptoms of post-traumatic stress, anxiety, depression, and suicidality (Jetelina et al., 2020; Klimley et al., 2018). Though most measures of resilience are grounded in a deficit-based approach, researchers using a strength-based approach proposed resilience may be a protective factor for this population (Crowe et al., 2017; Wild et al., 2020). Consequently, counselors need a means to assess resilience in their clinical practice from a strength-based conceptualization of clients.
Johnson et al. (2011) offered a non-deficit approach to measuring resilience in response to stressful events associated with military service. Thus far, researchers have conducted analyses of the RSES-22 and RSES-4 with military populations (De La Rosa et al., 2016; Johnson et al., 2011; Prosek & Ponder, 2021), but not yet with first responders. While there are some overlapping characteristics between the populations, there are also unique differences that warrant research with discrete sampling (SAMHSA, 2018). In light of the importance of resilience as a protective factor for mental health among first responders, the purpose of the current study was to confirm the reliability and validity of the RSES-22 and RSES-4 when utilized with this population. In the current study, we hypothesized the measures would perform similarly among first responders and if so, the RSES-4 would offer counselors a brief assessment option in clinical practice that is both reliable and valid.
Method
Participants
Participants in the current non-probability, purposive sample study were first responders (N = 238) seeking clinical treatment at an outpatient, mental health nonprofit organization in the Southwestern United States. Participants’ mean age was 37.53 years (SD = 10.66). The majority of participants identified as men (75.2%; n = 179), with women representing 24.8% (n = 59) of the sample. In terms of race and ethnicity, participants identified as White (78.6%; n = 187), Latino/a (11.8%; n = 28), African American or Black (5.5%; n = 13), Native American (1.7%; n = 4), Asian American (1.3%; n = 3), and multiple ethnicities (1.3%; n = 3). The participants identified as first responders in three main categories: LEO (34.9%; n = 83), EMT (28.2%; n = 67), and fire rescue (25.2%; n = 60). Among the first responders, 26.9% reported previous military affiliation. As part of the secondary analysis, we utilized a subsample (n = 190) that was reflective of the larger sample (see Table 1).
Procedure
The data for this study were collected between 2015–2020 as part of the routine clinical assessment procedures at a nonprofit organization serving military service members, first responders, frontline health care workers, and their families. The agency representatives conduct clinical assessments with clients at intake, Session 6, Session 12, and Session 18 or when clinical services are concluded. We consulted with the second author’s Institutional Review Board, which determined the research as exempt, given the de-identified, archival nature of the data. For inclusion in this analysis, data needed to represent first responders, ages 18 or older, with a completed RSES-22 at intake. The RSES-4 are four questions within the RSES-22 measure; therefore, the participants did not have to complete an additional measure. For the secondary analysis, data from participants who also completed other mental health measures at intake were also included (see Measures).
Table 1
Demographics of Sample
| Characteristic |
Sample 1
(N = 238) |
Sample 2
(n = 190) |
| Age (Years) |
|
|
| Mean |
37.53 |
37.12 |
| Median |
35.50 |
35.00 |
| SD |
10.66 |
10.30 |
| Range |
46 |
45 |
| Time in Service (Years) |
|
|
| Mean |
11.62 |
11.65 |
| Median |
10.00 |
10.00 |
| SD |
9.33 |
9.37 |
| Range |
41 |
39 |
|
n (%) |
| First Responder Type |
|
|
Emergency Medical
Technicians |
67 (28.2%) |
54 (28.4%) |
| Fire Rescue |
60 (25.2%) |
45 (23.7%) |
| Law Enforcement |
83 (34.9%) |
72 (37.9%) |
| Other |
9 (3.8%) |
5 (2.6%) |
| Two or more |
10 (4.2%) |
6 (3.2%) |
| Not reported |
9 (3.8%) |
8 (4.2%) |
| Gender |
|
|
| Women |
59 (24.8%) |
47 (24.7%) |
| Men |
179 (75.2%) |
143 (75.3%) |
| Ethnicity |
|
|
| African American/Black |
13 (5.5%) |
8 (4.2%) |
| Asian American |
3 (1.3%) |
3 (1.6%) |
| Latino(a)/Hispanic |
28 (11.8%) |
24 (12.6%) |
| Multiple Ethnicities |
3 (1.3%) |
3 (1.6%) |
| Native American |
4 (1.7%) |
3 (1.6%) |
| White |
187 (78.6%) |
149 (78.4%) |
Note. Sample 2 is a subset of Sample 1. Time in service for Sample 1, n = 225;
time in service for Sample 2, n = 190.
Measures
Response to Stressful Experiences Scale
The Response to Stressful Experiences Scale (RSES-22) is a 22-item measure to assess dimensions of resilience, including meaning-making, active coping, cognitive flexibility, spirituality, and self-efficacy (Johnson et al., 2011). Participants respond to the prompt “During and after life’s most stressful events, I tend to” on a 5-point Likert scale from 0 (not at all like me) to 4 (exactly like me). Total scores range from 0 to 88 in which higher scores represent greater resilience. Example items include see it as a challenge that will make me better, pray or meditate, and find strength in the meaning, purpose, or mission of my life. Johnson et al. (2011) reported the RSES-22 demonstrates good internal consistency (α = .92) and test-retest reliability (α = .87) among samples from military populations. Further, the developers confirmed convergent, discriminant, concurrent, and incremental criterion validity (see Johnson et al., 2011). In the current study, Cronbach’s alpha of the total score was .93.
Adapted Response to Stressful Experiences Scale
The adapted Response to Stressful Experiences Scale (RSES-4) is a 4-item measure to assess resilience as a unidimensional construct (De La Rosa et al., 2016). The prompt and Likert scale are consistent with the original RSES-22; however, it only includes four items: find a way to do what’s necessary to carry on, know I will bounce back, learn important and useful life lessons, and practice ways to handle it better next time. Total scores range from 0 to 16, with higher scores indicating greater resilience. De La Rosa et al. (2016) reported acceptable internal consistency (α = .76–.78), test-retest reliability, and demonstrated criterion validity among multiple military samples. In the current study, the Cronbach’s alpha of the total score was .74.
Patient Health Questionnaire-9
The Patient Health Questionnaire-9 (PHQ-9) is a 9-item measure to assess depressive symptoms in the past 2 weeks (Kroenke et al., 2001). Respondents rate the frequency of their symptoms on a 4-point Likert scale ranging from 0 (not at all) to 3 (nearly every day). Total scores range from 0 to 27, in which higher scores indicate increased severity of depressive symptoms. Example items include little interest or pleasure in doing things and feeling tired or having little energy. Kroenke et al. (2001) reported good internal consistency (α = .89) and established criterion and construct validity. In this sample, Cronbach’s alpha of the total score was .88.
PTSD Checklist-5
The PTSD Checklist-5 (PCL-5) is a 20-item measure for the presence of PTSD symptoms in the past month (Blevins et al., 2015). Participants respond on a 5-point Likert scale indicating frequency of PTSD-related symptoms from 0 (not at all) to 4 (extremely). Total scores range from 0 to 80, in which higher scores indicate more severity of PTSD-related symptoms. Example items include repeated, disturbing dreams of the stressful experience and trouble remembering important parts of the stressful experience. Blevins et al. (2015) reported good internal consistency (α = .94) and determined convergent and discriminant validity. In this sample, Cronbach’s alpha of the total score was .93.
Generalized Anxiety Disorder-7
The Generalized Anxiety Disorder-7 (GAD-7) is a 7-item measure to assess for anxiety symptoms over the past 2 weeks (Spitzer et al., 2006). Participants rate the frequency of the symptoms on a 4-point Likert scale ranging from 0 (not at all) to 3 (nearly every day). Total scores range from 0 to 21 with higher scores indicating greater severity of anxiety symptoms. Example items include not being able to stop or control worrying and becoming easily annoyed or irritable. Among patients from primary care settings, Spitzer et al. (2006) determined good internal consistency (α = .92) and established criterion, construct, and factorial validity. In this sample, Cronbach’s alpha of the total score was .91.
Suicidal Behaviors Questionnaire-Revised
The Suicidal Behaviors Questionnaire-Revised (SBQ-R) is a 4-item measure to assess suicidality (Osman et al., 2001). Each item assesses a different dimension of suicidality: lifetime ideation and attempts, frequency of ideation in the past 12 months, threat of suicidal behaviors, and likelihood of suicidal behaviors (Gutierrez et al., 2001). Total scores range from 3 to 18, with higher scores indicating more risk of suicide. Example items include How often have you thought about killing yourself in the past year? and How likely is it that you will attempt suicide someday? In a clinical sample, Osman et al. (2001) reported good internal consistency (α = .87) and established criterion validity. In this sample, Cronbach’s alpha of the total score was .85.
Data Analysis
Statistical analyses were conducted using SPSS version 26.0 and SPSS Analysis of Moment Structures (AMOS) version 26.0. We examined the dataset for missing values, replacing 0.25% (32 of 12,836 values) of data with series means. We reviewed descriptive statistics of the RSES-22 and RSES-4 scales. We determined multivariate normality as evidenced by skewness less than 2.0 and kurtosis less than 7.0 (Dimitrov, 2012). We assessed reliability for the scales by interpreting Cronbach’s alphas and inter-item correlations to confirm internal consistency.
We conducted two separate confirmatory factor analyses to determine the model fit and factorial validity of the 22-item measure and adapted 4-item measure. We used several indices to conclude model fit: minimum discrepancy per degree of freedom (CMIN/DF) and p-values, root mean residual (RMR), goodness-of-fit index (GFI), comparative fit index (CFI), Tucker-Lewis index (TLI), and the root mean square error of approximation (RMSEA). According to Dimitrov (2012), values for the CMIN/DF < 2.0,p > .05, RMR < .08, GFI > .90, CFI > .90, TLI > .90, and RMSEA < .10 provide evidence of a strong model fit. To determine criterion validity, we assessed a subsample of participants (n = 190) who had completed the RSES-22, RSES-4, and four other psychological measures (i.e., PHQ-9, PCL-5, GAD-7, and SBQ-R). We determined convergent validity by conducting bivariate correlations between the RSES-22 and RSES-4.
Results
Descriptive Analyses
We computed means, standard deviations, 95% confidence interval (CI), and score ranges for the RSES-22 and RSES-4 (Table 2). Scores on the RSES-22 ranged from 19–88. Scores on the RSES-4 ranged from 3–16. Previous researchers using the RSES-22 on military samples reported mean scores of 57.64–70.74 with standard deviations between 8.15–15.42 (Johnson et al., 2011; Prosek & Ponder, 2021). In previous research of the RSES-4 with military samples, mean scores were 9.95–11.20 with standard deviations between 3.02–3.53(De La Rosa et al., 2016; Prosek & Ponder, 2021).
Table 2
Descriptive Statistics for RSES-22 and RSES-4
| Variable |
M |
SD |
95% CI |
Score Range |
| RSES-22 scores |
60.12 |
13.76 |
58.52, 61.86 |
19–88 |
| RSES-4 scores |
11.66 |
2.62 |
11.33, 11.99 |
3–16 |
Note. N = 238. RSES-22 = Response to Stressful Experiences Scale 22-item; RSES-4 = Response
to Stressful Experiences Scale 4-item adaptation.
Reliability Analyses
To determine the internal consistency of the resiliency measures, we computed Cronbach’s alphas. For the RSES-22, we found strong evidence of inter-item reliability (α = .93), which was consistent with the developers’ estimates (α = .93; Johnson et al., 2011). For the RSES-4, we assessed acceptable inter-item reliability (α = .74), which was slightly lower than previous estimates (α = .76–.78; De La Rosa et al., 2016). We calculated the correlation between items and computed the average of all the coefficients. The average inter-item correlation for the RSES-22 was .38, which falls within the acceptable range (.15–.50). The average inter-item correlation for the RSES-4 was .51, slightly above the acceptable range. Overall, evidence of internal consistency was confirmed for each scale.
Factorial Validity Analyses
We conducted two confirmatory factor analyses to assess the factor structure of the RSES-22 and RSES-4 for our sample of first responders receiving mental health services at a community clinic (Table 3). For the RSES-22, a proper solution converged in 10 iterations. Item loadings ranged between .31–.79, with 15 of 22 items loading significantly ( > .6) on the latent variable. It did not meet statistical criteria for good model fit: χ2 (209) = 825.17, p = .000, 90% CI [0.104, 0.120]. For the RSES-4, a proper solution converged in eight iterations. Item loadings ranged between .47–.80, with three of four items loading significantly ( > .6) on the latent variable. It met statistical criteria for good model fit: χ2 (2) = 5.89, p = .053, 90% CI [0.000, 0.179]. The CMIN/DF was above the suggested < 2.0 benchmark; however, the other fit indices indicated a model fit.
Table 3
Confirmatory Factor Analysis Fit Indices for RSES-22 and RSES-4
| Variable |
df |
χ2 |
CMIN/DF |
RMR |
GFI |
CFI |
TLI |
RMSEA |
90% CI |
| RSES-22 |
209 |
825.17/.000 |
3.95 |
.093 |
.749 |
.771 |
0.747 |
.112 |
0.104, 0.120 |
| RSES-4 |
2 |
5.89/.053 |
2.94 |
.020 |
.988 |
.981 |
0.944 |
.091 |
0.000, 0.179 |
Note. N = 238. RSES-22 = Response to Stressful Experiences Scale 22-item; RSES-4 = Response to Stressful Experiences Scale 4-item adaptation; CMIN/DF = Minimum Discrepancy per Degree of Freedom; RMR = Root Mean Square Residual;
GFI = Goodness-of-Fit Index; CFI = Comparative Fit Index; TLI = Tucker-Lewis Index; RMSEA = Root Mean Squared Error of Approximation.
Criterion and Convergent Validity Analyses
To assess for criterion validity of the RSES-22 and RSES-4, we conducted correlational analyses with four established psychological measures (Table 4). We utilized a subsample of participants (n = 190) who completed the PHQ-9, PCL-5, GAD-7, and SBQ-R at intake. Normality of the data was not a concern because analyses established appropriate ranges for skewness and kurtosis (± 1.0). The internal consistency of the RSES-22 (α = .93) and RSES-4 (α = .77) of the subsample was comparable to the larger sample and previous studies. The RSES-22 and RSES-4 related to the psychological measures of distress in the expected direction, meaning measures were significantly and negatively related, indicating that higher resiliency scores were associated with lower scores of symptoms associated with diagnosable mental health disorders (i.e., post-traumatic stress, anxiety, depression, and suicidal behavior). We verified convergent validity with a correlational analysis of the RSES-22 and RSES-4, which demonstrated a significant and positive relationship.
Table 4
Criterion and Convergent Validity of RSES-22 and RSES-4
|
M (SD) |
Cronbach’s α |
RSES-22 |
PHQ-9 |
PCL-5 |
GAD-7 |
SBQ-R |
| RSES-22 |
60.16 (14.17) |
.93 |
— |
−.287* |
−.331* |
−.215* |
−.346* |
| RSES-4 |
11.65 (2.68) |
.77 |
.918 |
−.290* |
−.345* |
−.220* |
−.327* |
Note. n = 190. RSES-22 = Response to Stressful Experiences Scale 22-item; RSES-4 = Response to Stressful Experiences Scale 4-item adaptation; PHQ-9 = Patient Health Questionnaire-9;
PCL-5 = PTSD Checklist-5; GAD-7 = Generalized Anxiety Disorder-7; SBQ-R = Suicidal Behaviors Questionnaire-Revised.
*p < .01.
Discussion
The purpose of this study was to validate the factor structure of the RSES-22 and the abbreviated RSES-4 with a first responder sample. Aggregated means were similar to those in the articles that validated and normed the measures in military samples (De La Rosa et al., 2016; Johnson et al., 2011; Prosek & Ponder, 2021). Additionally, the internal consistency was similar to previous studies. In the original article, Johnson et al. (2011) proposed a five-factor structure for the RSES-22, which was later established as a unidimensional assessment after further exploratory factor analysis (De La Rosa et al., 2016). Subsequently, confirmatory factor analyses with a treatment-seeking veteran population revealed that the RSES-22 demonstrated unacceptable model fit, whereas the RSES-4 demonstrated a good model fit (Prosek & Ponder, 2021). In both samples, the RSES-4 GFI, CFI, and TLI were all .944 or higher, whereas the RSES-22 GFI, CFI, and TLI were all .771 or lower. Additionally, criterion and convergent validity as measured by the PHQ-9, PCL-5, and GAD-7 in both samples were extremely close. Similarly, in this sample of treatment-seeking first responders, confirmatory factor analyses indicated an inadequate model fit for the RSES-22 and a good model fit for the RSES-4. Lastly, convergent and criterion validity were established with correlation analyses of the RSES-22 and RSES-4 with four other standardized assessment instruments (i.e., PHQ-9, PCL-5, GAD-7, SBQ-R). We concluded that among the first responder sample, the RSES-4 demonstrated acceptable psychometric properties, as well as criterion and convergent validity with other mental health variables (i.e., post-traumatic stress, anxiety, depression, and suicidal behavior).
Implications for Clinical Practice
First responders are a unique population and are regularly exposed to trauma (Donnelly & Bennett, 2014; Jetelina et al., 2020; Klimley et al., 2018; Weiss et al., 2010). Although first responders could potentially benefit from espousing resilience, they are often hesitant to seek mental health services (Crowe et al., 2017; Jones, 2017). The RSES-22 and RSES-4 were originally normed with military populations. The results of the current study indicated initial validity and reliability among a first responder population, revealing that the RSES-4 could be useful for counselors in assessing resilience.
It is important to recognize that first responders have perceived coping with traumatic stress as an individual process (Crowe et al., 2017) and may believe that seeking mental health services is counter to the emotional and physical training expectations of the profession (Crowe et al., 2015). Therefore, when first responders seek mental health care, counselors need to be prepared to provide culturally responsive services, including population-specific assessment practices and resilience-oriented care.
Jones (2017) encouraged a comprehensive intake interview and battery of appropriate assessments be conducted with first responder clients. Counselors need to balance the number of intake questions while responsibly assessing for mental health comorbidities such as post-traumatic stress, anxiety, depression, and suicidality. The RSES-4 provides counselors a brief, yet targeted assessment of resilience.
Part of what cultural competency entails is assessing constructs (e.g., resilience) that have been shown to be a protective factor against PTSD among first responders (Klimley et al., 2018). Since the items forming the RSES-4 were developed to highlight the positive characteristics of coping (Johnson et al., 2011), rather than a deficit approach, this aligns with the grounding of the counseling profession. It is also congruent with first responders’ perceptions of resilience. Indeed, in a content analysis of focus group interviews with first responders, participants defined resilience as a positive coping strategy that involves emotional regulation, perseverance, personal competence, and physical fitness (Crowe et al., 2017).
The RSES-4 is a brief, reliable, and valid measure of resilience with initial empirical support among a treatment-seeking first responder sample. In accordance with the ACA (2014) Code of Ethics, counselors are to administer assessments normed with the client population (E.8.). Thus, the results of the current study support counselors’ use of the measure in practice. First responder communities are facing unprecedented work tasks in response to COVID-19. Subsequently, their mental health might suffer (Centers for Disease Control and Prevention, 2020) and experts have recommended promoting resilience as a protective factor for combating the negative mental health consequences of COVID-19 (Chen & Bonanno, 2020). Therefore, the relevance of assessing resilience among first responder clients in the current context is evident.
Limitations and Future Research
This study is not without limitations. The sample of first responders was homogeneous in terms of race, ethnicity, and gender. Subsamples of first responders (i.e., LEO, EMT, fire rescue) were too small to conduct within-group analyses to determine if the factor structure of the RSES-22 and RSES-4 would perform similarly. Also, our sample of first responders included two emergency dispatchers. Researchers reported that emergency dispatchers should not be overlooked, given an estimated 13% to 15% of emergency dispatchers experience post-traumatic symptomatology (Steinkopf et al., 2018). Future researchers may develop studies that further explore how, if at all, emergency dispatchers are represented in first responder research.
Furthermore, future researchers could account for first responders who have prior military service. In a study of LEOs, Jetelina et al. (2020) found that participants with military experience were 3.76 times more likely to report mental health concerns compared to LEOs without prior military affiliation. Although we reported the prevalence rate of prior military experience in our sample, the within-group sample size was not sufficient for additional analyses. Finally, our sample represented treatment-seeking first responders. Future researchers may replicate this study with non–treatment-seeking first responder populations.
Conclusion
First responders are at risk for sustaining injuries, experiencing life-threatening events, and witnessing harm to others (Lanza et al., 2018). The nature of their exposure can be repeated and cumulative over time (Donnelly & Bennett, 2014), indicating an increased risk for post-traumatic stress, anxiety, and depressive symptoms, as well as suicidal behavior (Jones et al., 2018). Resilience is a promising protective factor that promotes wellness and healthy coping among first responders (Wild et al., 2020), and counselors may choose to routinely measure for resilience among first responder clients. The current investigation concluded that among a sample of treatment-seeking first responders, the original factor structure of the RSES-22 was unstable, although it demonstrated good reliability and validity. The adapted version, RSES-4, demonstrated good factor structure while also maintaining acceptable reliability and validity, consistent with studies of military populations (De La Rosa et al., 2016; Johnson et al., 2011; Prosek & Ponder, 2021). The RSES-4 provides counselors with a brief and strength-oriented option for measuring resilience with first responder clients.
Conflict of Interest and Funding Disclosure
The authors reported no conflict of interest
or funding contributions for the development
of this manuscript.
References
American Counseling Association. (2014). ACA code of ethics.
American Psychiatric Association. (2013). Diagnostic and statistical manual of mental disorders (5th ed.).
Antony, J., Brar, R., Khan, P. A., Ghassemi, M., Nincic, V., Sharpe, J. P., Straus, S. E., & Tricco, A. C. (2020). Interventions for the prevention and management of occupational stress injury in first responders: A rapid overview of reviews. Systematic Reviews, 9(121), 1–20. https://doi.org/10.1186/s13643-020-01367-w
Blevins, C. A., Weathers, F. W., Davis, M. T., Witte, T. K., & Domino, J. L. (2015). The Posttraumatic Stress Disorder Checklist for DSM-5 (PCL-5): Development and initial psychometric evaluation. Journal of Traumatic Stress, 28(6), 489–498. https://doi.org/10.1002/jts.22059
Burnett, H. J., Jr. (2017). Revisiting the compassion fatigue, burnout, compassion satisfaction, and resilience connection among CISM responders. Journal of Police Emergency Response, 7(3), 1–10. https://doi.org/10.1177/2158244017730857
Centers for Disease Control and Prevention. (2020, June 30). Coping with stress. https://www.cdc.gov/coronavirus/2019-ncov/daily-life-coping/managing-stress-anxiety.html
Chen, S., & Bonanno, G. A. (2020). Psychological adjustment during the global outbreak of COVID-19: A resilience perspective. Psychological Trauma: Theory, Research, Practice, and Policy, 12(S1), S51–S54. https://doi.org/10.1037/tra0000685
Christopher, M. S., Hunsinger, M., Goerling, R. J., Bowen, S., Rogers, B. S., Gross, C. R., Dapolonia, E., & Pruessner, J. C. (2018). Mindfulness-based resilience training to reduce health risk, stress reactivity, and aggression among law enforcement officers: A feasibility and preliminary efficacy trial. Psychiatry Research, 264, 104–115. https://doi.org/10.1016/j.psychres.2018.03.059
Crowe, A., Glass, J. S., Lancaster, M. F., Raines, J. M., & Waggy, M. R. (2015). Mental illness stigma among first responders and the general population. Journal of Military and Government Counseling, 3(3), 132–149. http://mgcaonline.org/wp-content/uploads/2013/02/JMGC-Vol-3-Is-3.pdf
Crowe, A., Glass, J. S., Lancaster, M. F., Raines, J. M., & Waggy, M. R. (2017). A content analysis of psychological resilience among first responders. SAGE Open, 7(1), 1–9. https://doi.org/10.1177/2158244017698530
De La Rosa, G. M., Webb-Murphy, J. A., & Johnston, S. L. (2016). Development and validation of a brief measure of psychological resilience: An adaptation of the Response to Stressful Experiences Scale. Military Medicine, 181(3), 202–208. https://doi.org/10.7205/MILMED-D-15-00037
Dimitrov, D. M. (2012). Statistical methods for validation of assessment scale data in counseling and related fields. American Counseling Association.
Donnelly, E. A., & Bennett, M. (2014). Development of a critical incident stress inventory for the emergency medical services. Traumatology, 20(1), 1–8. https://doi.org/10.1177/1534765613496646
Greinacher, A., Derezza-Greeven, C., Herzog, W., & Nikendei, C. (2019). Secondary traumatization in first responders: A systematic review. European Journal of Psychotraumatology, 10(1), 1562840. https://doi.org/10.1080/20008198.2018.1562840
Gutierrez, P. M., Osman, A., Barrios, F. X., & Kopper, B. A. (2001). Development and initial validation of the Self-Harm Behavior Questionnaire. Journal of Personality Assessment, 77(3), 475–490. https://doi.org/10.1207/S15327752JPA7703_08
Jetelina, K. K., Mosberry, R. J., Gonzalez, J. R., Beauchamp, A. M., & Hall, T. (2020). Prevalence of mental illnesses and mental health care use among police officers. JAMA Network Open, 3(10), 1–12. https://doi.org/10.1001/jamanetworkopen.2020.19658
Johnson, D. C., Polusny, M. A., Erbes, C. R., King, D., King, L., Litz, B. T., Schnurr, P. P., Friedman, M., Pietrzak, R. H., & Southwick, S. M. (2011). Development and initial validation of the Response to Stressful Experiences Scale. Military Medicine, 176(2), 161–169. https://doi.org/10.7205/milmed-d-10-00258
Jones, S. (2017). Describing the mental health profile of first responders: A systematic review. Journal of the American Psychiatric Nurses Association, 23(3), 200–214. https://doi.org/10.1177/1078390317695266
Jones, S., Nagel, C., McSweeney, J., & Curran, G. (2018). Prevalence and correlates of psychiatric symptoms among first responders in a Southern state. Archives of Psychiatric Nursing, 32(6), 828–835. https://doi.org/10.1016/j.apnu.2018.06.007
Joyce, S., Tan, L., Shand, F., Bryant, R. A., & Harvey, S. B. (2019). Can resilience be measured and used to predict mental health symptomology among first responders exposed to repeated trauma? Journal of Occupational and Environmental Medicine, 61(4), 285–292. https://doi.org/10.1097/JOM.0000000000001526
Kleim, B., & Westphal, M. (2011). Mental health in first responders: A review and recommendation for prevention and intervention strategies. Traumatology, 17(4), 17–24. https://doi.org/10.1177/1534765611429079
Klimley, K. E., Van Hasselt, V. B., & Stripling, A. M. (2018). Posttraumatic stress disorder in police, firefighters, and emergency dispatchers. Aggression and Violent Behavior, 43, 33–44.
https://doi.org/10.1016/j.avb.2018.08.005
Kroenke, K., Spitzer, R. L., & Williams, J. B. W. (2001). The PHQ-9: Validity of a brief depression severity measure. Journal of General Internal Medicine, 16, 606–613. https://doi.org/10.1046/j.1525-1497.2001.016009606.x
Lanza, A., Roysircar, G., & Rodgers, S. (2018). First responder mental healthcare: Evidence-based prevention, postvention, and treatment. Professional Psychology: Research and Practice, 49(3), 193–204. https://doi.org/10.1037/pro0000192
Lee, J.-S., Ahn, Y.-S., Jeong, K.-S. Chae, J.-H., & Choi, K.-S. (2014). Resilience buffers the impact of traumatic events on the development of PTSD symptoms in firefighters. Journal of Affective Disorders, 162, 128–133. https://doi.org/10.1016/j.jad.2014.02.031
Lewis, G. B., & Pathak, R. (2014). The employment of veterans in state and local government service. State and Local Government Review, 46(2), 91–105. https://doi.org/10.1177/0160323X14537835
McCanlies, E. C., Gu, J. K., Andrew, M. E., Burchfiel, C. M., & Violanti, J. M. (2017). Resilience mediates the relationship between social support and post-traumatic stress symptoms in police officers. Journal of Emergency Management, 15(2), 107–116. https://doi.org/10.5055/jem.2017.0319
National Institute of Mental Health. (2017). Post-traumatic stress disorder. https://www.nimh.nih.gov/health/statistics/post-traumatic-stress-disorder-ptsd.shtml
Osman, A., Bagge, C. L., Gutierrez, P. M., Konick, L. C., Kopper, B. A., & Barrios, F. X. (2001). The Suicidal Behaviors Questionnaire–revised (SBQ-R): Validation with clinical and nonclinical samples. Assessment, 8(4), 443–454. https://doi.org/10.1177/107319110100800409
Prosek, E. A., & Ponder, W. N. (2021). Validation of the Adapted Response to Stressful Experiences Scale (RSES-4) among veterans [Manuscript submitted for publication].
Spitzer, R. L., Kroenke, K., Williams, J. B. W., & Löwe, B. (2006). A brief measure for assessing generalized anxiety disorder (The GAD-7). Archives of Internal Medicine, 166(10), 1092–1097.
https://doi.org/10.1001/archinte.166.10.1092
Steinkopf, B., Reddin, R. A., Black, R. A., Van Hasselt, V. B., & Couwels, J. (2018). Assessment of stress and resiliency in emergency dispatchers. Journal of Police and Criminal Psychology, 33(4), 398–411.
https://doi.org /10.1007/s11896-018-9255-3
Substance Abuse and Mental Health Services Administration. (2018, May). First responders: Behavioral health concerns, emergency response, and trauma. Disaster Technical Assistance Center Supplemental Research Bulletin. https://www.samhsa.gov/sites/default/files/dtac/supplementalresearchbulletin-firstresponders-may2018.pdf
Weiss, D. S., Brunet, A., Best, S. R., Metzler, T. J., Liberman, A., Pole, N., Fagan, J. A., & Marmar, C. R. (2010). Frequency and severity approaches to indexing exposure to trauma: The Critical Incident History Questionnaire for police officers. Journal of Traumatic Stress, 23(6), 734–743.
https://doi.org/10.1002/jts.20576
White, B., Driver, S., & Warren, A. M. (2010). Resilience and indicators of adjustment during rehabilitation from a spinal cord injury. Rehabilitation Psychology, 55(1), 23–32. https://doi.org/10.1037/a0018451
Wild, J., El-Salahi, S., Degli Esposti, M., & Thew, G. R. (2020). Evaluating the effectiveness of a group-based resilience intervention versus psychoeducation for emergency responders in England: A randomised controlled trial. PLoS ONE, 15(11), e0241704. https://doi.org/10.1371/journal.pone.0241704
Windle, G., Bennett, K. M., & Noyes, J. (2011). A methodological review of resilience measurement scales. Health and Quality of Life Outcomes, 9, Article 8, 1–18. https://doi.org/10.1186/1477-7525-9-8
Warren N. Ponder, PhD, is Director of Outcomes and Evaluation at One Tribe Foundation. Elizabeth A. Prosek, PhD, NCC, LPC, is an associate professor at Penn State University. Tempa Sherrill, MS, LPC-S, is the founder of Stay the Course and a volunteer at One Tribe Foundation. Correspondence may be addressed to Warren N. Ponder, 855 Texas St., Suite 105, Fort Worth, TX 76102, warren@1tribefoundation.org.
Aug 20, 2021 | Volume 11 - Issue 3
Hannah B. Bayne, Danica G. Hays, Luke Harness, Brianna Kane
We conducted a content analysis of counseling scholarship related to Whiteness for articles published in national peer-reviewed counseling journals within the 35-year time frame (1984–2019) following the publication of Janet Helms’s seminal work on White racial identity. We identified articles within eight counseling journals for a final sample of 63 articles—eight qualitative (12.7%), 38 quantitative (60.3%), and 17 theoretical (27.0%). Our findings outline publication characteristics and trends and present themes for key findings in this area of scholarship. They reveal patterns such as type of research methodology, sampling, correlations between White racial identity and other constructs, and limitations of White racial identity assessment. Based on this overview of extant research on Whiteness, our recommendations include future research that focuses on behavioral and clinical manifestations, anti-racism training within counselor education, and developing a better overall understanding of how White attitudes and behaviors function for self-protection.
Keywords: Whiteness, White racial identity, counseling scholarship, counseling journals, content analysis
Counselors are ethically guided to understand and address the roles that race, privilege, and oppression play in impacting both themselves and their clients (American Counseling Association [ACA], 2014). Most practitioners identify as White despite the population diversity in the United States (U.S. Census Bureau, 2020), which holds implications for understanding how Whiteness impacts culturally competent counselor training and practice (Helms, 1984, 1995, 2017). It is important, then, to understand the role of racial identity within counseling, particularly in terms of how Whiteness can be deconstructed and examined as a constant force impacting power dynamics and client progress (Helms, 1990, 2017; Malott et al., 2015). Whiteness models (i.e., Helms, 1984) describe how White people make meaning of their own and others’ racial identity as a result of personal and social experiences with race (Helms, 1984, 2017). The Helms model, along with other constructs, such as color-blindness (Frankenberg, 1993), White racial consciousness (Claney & Parker, 1989), and White fragility (DiAngelo, 2018), implicates the harmful impacts of Whiteness and invites critical reflection of how these constructs impact the counseling process.
Though much has been theorized regarding Whiteness and its impact within the helping professions, the contributions of Whiteness scholarship within professional counseling journals are unclear. An understanding of the specific professional applications and explorations of Whiteness within counseling can help identify best practices in counselor education, research, and practice to counter the harmful impacts of Whiteness and encourage growth toward anti-racist attitudes and behaviors.
White Racial Identity and Related Constructs
The Helms (1984) model of White racial identity (WRI) presents Whiteness as a developmental process centering on racial consciousness (i.e., the awareness of one’s own race), as well as awareness of attitudes and behaviors toward other racial groups (Helms, 1984, 1990, 1995, 2017). According to Helms, White people have the privilege to restrict themselves to environments and relationships that are homogenous and White-normative, thus limiting their progression through the stages (DiAngelo, 2018; Helms, 1984). The initial model (Helms, 1984) contained five stages (i.e., Contact, Disintegration, Reintegration, Pseudo-Independence, and Autonomy), each with a positive or negative response that could facilitate progression toward a more advanced stage, regression to earlier stages of the model, or stagnation at the current stage of development. Helms (1990) later added a sixth status, Immersion/Emersion, to the model as an intermediary between Pseudo-Independence and Autonomy. These final three stages of the model (i.e., Pseudo-Independence, Immersion/Emersion, Autonomy) involve increasing levels of racial acceptance and intellectual and emotional comfort with racial issues, which in turn leads to the development of a positive and anti-racist WRI (Helms, 1990, 1995).WRI requires intentional and sustained attention toward how Whiteness impacts the self and others, with progression through the stages leading to beneficial intra and interpersonal outcomes (Helms, 1990, 1995, 2017).
Since Helms (1984), several additional components of Whiteness have been introduced, primarily within psychology, counseling psychology, and sociology scholarship. White racial consciousness is distinct from the WRI model in its focus on attitudes toward racial out-groups, rather than using the White in-group as a reference point (Choney & Behrens, 1996; Claney & Parker, 1989). Race essentialism refers to the degree to which a person believes that race reflects biological differences that influence personal characteristics (Tawa, 2017). Symbolic/modern racism refers to overt attitudes of White people related to their perceived superiority (Henry & Sears, 2002; McConahay, 1986). A fourth Whiteness component, color-blind racial ideology, enables color-evasion (i.e., “I don’t see color”) and power-evasion roles (i.e., “everyone has an equal chance to succeed”), which allow White people to deny the impact of race and therefore evade a sense of responsibility for oppression (Frankenberg, 1993; Neville et al., 2013). White privilege refers to the systemic and unearned advantages provided to White people over people of color (McIntosh, 1988). There are also psychosocial costs accrued to White people as a result of racism that include (a) affective (e.g., anxiety and fear, anger, sadness, guilt and shame); (b) cognitive (i.e., distorted views of self, others, and reality in general related to race); and (c) behavioral (i.e., avoidance of cross-racial situations or loss of relationships with White people) impacts (Spanierman & Heppner, 2004). White fragility (DiAngelo, 2018) reflects defensive strategies White people use to re-establish cognitive and affective equilibrium regarding their own Whiteness and impact on others.
Whiteness concepts are thus varied, with different vantage points of how White people might engage in the consideration of power, privilege, and racism, and what potential implications these constructs might have on their development. These constructs also seem largely rooted in psychology research, and it is therefore unclear the extent to which counselor educators and researchers have examined and applied these constructs to training and practice. Such an analysis can assist in situating Whiteness within the specific contexts and professional roles of counseling and can identify areas in need of further study.
The Present Study
Because of the varied components of Whiteness, as well as its potential impact on counselor development and counseling process and outcome (Helms, 1995, 2017), there is a need to examine how these constructs have been examined and applied within counseling research. We sought to identify how and to what degree Whiteness constructs have been explored or developed within the counseling profession since the publication of the Helms (1984) model. We hope to summarize empirical and theoretical constructs related to Whiteness in national peer-reviewed counseling journals to more clearly consider implications for training and practice. Such analysis can highlight the saliency of WRI, demonstrating the need for continued focus on the influences and impacts of Whiteness within counseling. The following research questions were addressed: 1) What types of articles, topics, and major findings are published on Whiteness?; 2) What are the methodological features of articles published on Whiteness?; and 3) What are themes from key findings across these publications?
Method
We employed content analysis to identify publication patterns of national peer-reviewed counseling journals regarding counseling research on Whiteness in order to understand the scope and depth of this scholarship as it applies to fostering counselor training and practice. Content analysis is the systematic review of text in order to produce and summarize numerical data and identify patterns across data sources regarding phenomena (Neuendorf, 2017). In addition, content analysis has been used to summarize and identify patterns for specific topics, including multicultural counseling (e.g., Singh & Shelton, 2011).
Data Sources and Procedure
The sampling units for this study were journal articles on Whiteness topics published in national peer-reviewed journals (N = 24) of the ACA and its divisions, the American School Counselor Association, the American Mental Health Counselors Association, the National Board for Certified Counselors, and Chi Sigma Iota International. We used the following search terms: White supremacy, White racial identity, White privilege, White fragility, White guilt, White shame, White savior, White victimhood, color-blindness, race essentialism, anti-racism, White racism, reverse racism, White resistance, and Whiteness. We selected a 35-year review period (i.e., 1984–2019) to correspond with Helms’s (1984) foundational work on WRI.
We reviewed article abstracts to identify an initial sampling unit pool (N = 185 articles; 29 qualitative [15.6%], 56 quantitative [30.3%], and 100 theoretical [54.1%]). In pairs, we reviewed the initial pool to more closely examine each sampling unit for inclusion in analysis. We excluded 122 articles upon closer inspection (e.g., special issue introductions, personal narratives or profiles, broader focus on social justice issues, ethnic identity, multiculturalism, or primary focus on another racial group). This resulted in a final sample of 63 articles—eight qualitative (12.7%), 38 quantitative (60.3%), and 17 theoretical (27.0%; see Table 1).
Research Team
Our team consisted of four researchers: two counselor education faculty members and two counselor education doctoral students. We all identify as White. Hannah B. Bayne and Danica G. Hays hold doctorates in counselor education, and Luke Harness and Brianna Kane hold master’s degrees in school counseling and mental health counseling, respectively. We were all trained in qualitative research methods, and Bayne and Hays have conducted numerous qualitative research projects, including previous content analyses. Bayne and Hays trained Harness and Kane on content analysis through establishing coding protocols and coding together until an acceptable inter-rater threshold was met.
Table 1
Exclusion and Inclusion of Articles by Journal and Article Type
| Journal |
Excludeda |
Included |
Total
Sample |
% of
Final
Sample |
| Quant |
Qual |
Theory |
Quant |
Qual |
Theory |
| Journal of Counseling & Development |
5 |
0 |
11 |
16 |
4 |
5 |
24 |
38.1% |
Journal of Multicultural Counseling and
Development |
3 |
3 |
14 |
14 |
3 |
8 |
24 |
38.1% |
| Counselor Education and Supervision |
1 |
0 |
1 |
4 |
1 |
2 |
7 |
11.1% |
| The Journal of Humanistic Counseling |
1 |
2 |
14 |
1 |
1 |
1 |
3 |
4.8% |
| Journal of Mental Health Counseling |
0 |
0 |
2 |
1 |
0 |
3 |
2 |
3.2% |
| Counseling and Values |
0 |
0 |
0 |
1 |
0 |
0 |
1 |
1.6% |
| The Family Journal |
1 |
1 |
5 |
0 |
0 |
2 |
1 |
1.6% |
| Journal of Creativity in Mental Health |
0 |
2 |
4 |
0 |
0 |
1 |
1 |
1.6% |
| Adultspan Journal |
0 |
0 |
0 |
0 |
0 |
0 |
0 |
0% |
| The Career Development Quarterly |
0 |
0 |
0 |
0 |
0 |
0 |
0 |
0% |
Counseling Outcome Research
and Evaluation |
0 |
2 |
0 |
0 |
0 |
0 |
0 |
0% |
Journal for Social Action in Counseling
and Psychology |
0 |
0 |
3 |
0 |
0 |
0 |
0 |
0% |
| The Journal for Specialists in Group Work |
0 |
1 |
6 |
0 |
0 |
0 |
0 |
0% |
Journal of Addictions & Offender
Counseling |
0 |
0 |
0 |
0 |
0 |
0 |
0 |
0% |
| Journal of Child and Adolescent Counseling |
0 |
0 |
0 |
0 |
0 |
0 |
0 |
0% |
| Journal of College Counseling |
2 |
0 |
0 |
0 |
0 |
0 |
0 |
0% |
Journal of Counselor Leadership
and Advocacy |
1 |
5 |
6 |
0 |
0 |
0 |
0 |
0% |
| Journal of Employment Counseling |
2 |
0 |
4 |
0 |
0 |
0 |
0 |
0% |
| Journal of LGBTQ Issues in Counseling |
0 |
1 |
2 |
0 |
0 |
0 |
0 |
0% |
Journal of Military and Government
Counseling |
0 |
0 |
0 |
0 |
0 |
0 |
0 |
0% |
Measurement and Evaluation in
Counseling and Development |
1 |
0 |
2 |
0 |
0 |
0 |
0 |
0% |
| Professional School Counseling |
0 |
0 |
2 |
0 |
0 |
0 |
0 |
0% |
| Rehabilitation Counseling Bulletin |
3 |
1 |
2 |
0 |
0 |
0 |
0 |
0% |
| The Professional Counselor |
0 |
1 |
0 |
0 |
0 |
0 |
0 |
0% |
| Professional School Counseling |
0 |
0 |
2 |
0 |
0 |
0 |
0 |
0% |
Note. Quant = quantitative research articles; Qual = qualitative research articles; Theory = theoretical articles.
aArticles were excluded from analysis if they did not directly address Whiteness or White racial identity (e.g., special issue introductions, personal narratives or profiles, broader focus on social justice issues, ethnic identity, multiculturalism, or primary focus on another racial group).
Coding Frame Development
Dimensions and categories for our coding frame included: journal outlet, publication year, author characteristics (i.e., name, institutional affiliation, ACES region), article type, sample characteristics (e.g., composition, size, gender, race/ethnicity), research components (e.g., research design, data sources or instrumentation, statistical methods, research traditions, trustworthiness strategies), topics discussed (e.g., WRI attitudes, counselor preparation models, intervention use, client outcomes, counseling process), article implications and limitations, and a brief statement of key findings. Over the course of research team meetings, we reviewed and operationalized the coding frame dimensions and categories. We then selected one empirical and one conceptual article to code together in order to refine the coding frame, which resulted in further clarification of some categories.
Data Analysis
To establish evidence of replicability (Neuendorf, 2017), we coded eight (12.7%) randomly selected cases proportionate to the sample composition (i.e., two conceptual, four quantitative, two qualitative). We analyzed the accuracy rate of coding using R data analysis software for statistical analysis (LoMartire, 2020). Across 376 possible observations for eight cases, there was an acceptable rate of coding accuracy (0.89). In addition, pairwise Pearson-product correlations among raters indicated that coding misses did not follow a systematic pattern for any variable (r = −.10 to .65), and thus there were no significant variations in coding among research team members. After pilot coding, we met to discuss areas of coding misses to ensure understanding of the final coding frame.
For the main coding phase, we worked in pairs and divided the sample equally for independent and consensus coding. Upon completion of consensus coding of the entire sample, we extracted 29 keywords describing the Whiteness topics discussed in the articles. Bayne and Hays reviewed the 29 independent topics and collapsed the topics into eight larger themes. To identify themes across the key findings, Bayne and Harness reviewed 125 independent statements based on coder summaries of article findings, and through independent and consensus coding collapsed statements to yield three main themes.
Results
Article Characteristics
We focused on several article characteristics (Research Question 1): article type (conceptual, quantitative, qualitative); number of relevant articles per journal outlet; the relationship between journal outlet and article type; and frequency of Whiteness topics within and across journal outlets. Of the 24 national peer-reviewed counseling journals, eight journals (33.3%) contained publications that met inclusion criteria (i.e., contained keywords for Whiteness from our search criteria and focused specifically on WRI). The number of publications in those journals ranged from 1 to 24 (M = 2.5; Mdn = 7.88; SD = 10.15) and are listed in order of frequency in Table 2). There was not a significant relationship between the journal outlet and article type (i.e., quantitative, qualitative, conceptual) for this topic (r = 0.04, p = .39).
Table 2
Articles Addressing Whiteness and Associated Keywords in National Peer-Reviewed Counseling Journals
| Journal |
Articles Addressing Whiteness |
Percent of Total Sample |
| Journal of Counseling & Development |
24 |
38.1% |
| Journal of Multicultural Counseling and Development |
24 |
38.1% |
| Counselor Education and Supervision |
7 |
11.1% |
| The Journal of Humanistic Counseling |
3 |
4.8% |
| Journal of Mental Health Counseling |
2 |
3.2% |
| Counseling and Values |
1 |
1.6% |
| The Family Journal |
1 |
1.6% |
| Journal of Creativity in Mental Health |
1 |
1.6% |
| Adultspan Journal |
0 |
0% |
| The Career Development Quarterly |
0 |
0% |
| Counseling Outcome Research and Evaluation |
0 |
0% |
| Journal for Social Action in Counseling and Psychology |
0 |
0% |
| The Journal for Specialists in Group Work |
0 |
0% |
| Journal of Addictions & Offender Counseling |
0 |
0% |
| Journal of Child and Adolescent Counseling |
0 |
0% |
| Journal of College Counseling |
0 |
0% |
| Journal of Counselor Leadership and Advocacy |
0 |
0% |
| Journal of Employment Counseling |
0 |
0% |
| Journal of LGBTQ Issues in Counseling |
0 |
0% |
| Journal of Military and Government Counseling |
0 |
0% |
Measurement and Evaluation in Counseling and
Development |
0 |
0% |
| Professional School Counseling |
0 |
0% |
| Rehabilitation Counseling Bulletin |
0 |
0% |
| The Professional Counselor |
0 |
0% |
| Professional School Counseling |
0 |
0% |
Additionally, we identified eight themes of topics discussed within counseling research on Whiteness (see Table 3). For qualitative research, the three most frequently addressed topics were theory development, intrapsychic variables, and multicultural counseling competency (MCC). The most frequent topics discussed in theoretical articles were theory development, counselor preparation, Whiteness and WRI expression, cultural identity development, and counseling process.
Table 3
Themes in Topics Discussed Within Whiteness and WRI Articles
| Theme |
Description |
N
% |
Quant
n / % |
Qual
n / % |
Theory
n / % |
Examples |
| Whiteness and WRI Expression |
Attitudes and knowledge related to WRI and Whiteness constructs, with some (n = 5) examining pre–posttest changes
|
43
68.3% |
32 74.4% |
3
7.0% |
8
18.6% |
WRI attitudes, color-blind racial attitudes, racism and responses, White privilege and responses, and developmental considerations
|
| Cultural Identity Development |
Cultural identities and developmental processes outside of race
|
27
42.9% |
21
77.8% |
1
3.7% |
5
18.5% |
Ethnic identity, womanist identity, cultural demographics such as gender and age
|
| Counselor Preparation |
Training implications, with some presenting training intervention findings (n = 6)
|
23
36.5% |
17
73.9% |
1
4.3% |
5
21.8% |
Pedagogy, training interventions, and supervision process and outcome
|
| Theory Development |
Development or expansion of theoretical concepts |
18
28.6% |
5
27.8% |
5
27.8% |
8
44.4% |
White racial consciousness versus WRI, prominent responses to White privilege, psychological dispositions of White racism
|
| Multicultural Counseling Competency |
Measurements of perceived multicultural counseling competency
|
12
19.0% |
10
83.3% |
2
16.7% |
0
0.0% |
Perceived competency,
link with WRI |
| Counseling Process |
Counseling process and outcome variables
|
11
17.5% |
8
72.7% |
1
9.1% |
2
18.2% |
Client perceptions, working alliance, and clinical applications
|
| Intrapsychic Variables |
Affective and cognitive components that influence Whiteness and WRI
|
11
17.5% |
8
72.7% |
2
18.2% |
1
9.1% |
Personality variables, cognitive development, ego development
|
| Assessment Characteristics |
Development and/or critique of Whiteness and WRI measurements
|
9
14.3% |
8
88.9% |
0
0.0% |
1
11.1% |
Limitations of WRI scales, development of White privilege awareness scales |
| Totala |
|
154
|
111
72.1% |
15
9.7% |
30
19.5% |
|
Note. Quant = quantitative research articles; Qual = qualitative research articles; Theory = theoretical articles.
aPercentage total exceeds 100% because of rounding and/or topic overlap between articles.
Methodological Features
To address Research Question 2, we explored the methodological features of articles. These features included sample composition, research design, data sources, and limitations as reported within each empirical article (n = 46).
Sample Composition
For the 45 studies providing information about the racial/ethnic composition of their samples, White individuals accounted for a mean of 91% of total participants (range = 55%–100%; SD = 14). An average of 14% Black (SD = 6.7), 7.1% Latinx (SD = 4.7), 5.4% Asian (SD = 2.3), and less than 5% each of multiracial, Arab, and Native American respondents were included across the samples. Of studies reporting gender (n = 44), women accounted for an average of 68% of total participants (range = 33–100; SD = 14.7), and men accounted for 31% of total samples (range = 12–67; SD = 14). The age of participants, reported in 71.7% of the empirical studies, ranged from 16 to 81 (M = 29, SD = 8.2).
Of the 61 independent samples across the articles, a majority focused on student populations, with master’s trainees (n = 20, 32.8%), undergraduate students (n = 14, 21.9%), and doctoral trainees (n = 10, 16.4%) representing over 70% of the sample. The remainder of the samples included practitioners (n = 8, 13.1%), unspecified samples (n = 3, 4.9%), university educators (n = 2, 3.3%), educational specialist trainees (n = 2, 3.3%), site supervisors (n = 1, 1.6%), and general population adult samples (n = 1, 1.6%). The target audience of the articles (N = 63) focused primarily on counselor trainees (n = 34, 49.3%) or clients in agency/practice settings (n = 12, 17.4%). Other audiences included practitioners (n = 9, 13%), researchers (n = 3, 4.3%), general population (n = 6, 8.7%), counselor educators (n = 1, 1.4%), and general university personnel (n = 1, 1.4%).
Research Design and Data Sources
Of the 38 quantitative articles, 10 (26.3%) included an intervention as part of the research design. The majority employed a correlational design (n = 27, 71.1%), with the remainder consisting of four (10.5%) descriptive, four (10.5%) quasi-experimental, one (2.6%) ex post facto/causal comparative, one (2.6%) pre-experimental, and one (2.6%) true experimental design. In recruiting and selecting samples, most researchers used convenience sampling (n = 27, 57.4%), while the rest used purposive (n = 12, 31.6%), simple random (n = 5, 10.6%), stratified (n = 2, 4.3%), and homogenous (n = 1, 2.1%) sampling methods.
Regarding study instrumentation, 37 quantitative studies utilized self-report forced-choice surveys, with one study employing a combination of forced-choice and open-ended question surveys. Across the 38 quantitative studies, 13 of 50 (26%) assessments were used more than once. The most frequently used assessment was the White Racial Identity Attitudes Scale (n = 24; Helms & Carter, 1990). The 50 assessments purported to measure the following targeted variables: race/racial identity/racism (n = 17, 34%); MCC (n = 9, 18%); cultural identity (n = 6, 12%); counseling process and outcome (n = 5, 10%); social desirability (n = 2, 4%); and other variables such as personality, anxiety, and ego development (n = 11, 22%). Finally, data analysis procedures included ANOVA/MANOVA (n = 25, 30.9%), correlation (n = 23, 28.4%), regression (n = 17, 21%), t-tests (n = 7, 8.6%), descriptive (n = 5, 6.2%), exploratory factor analysis (n = 1, 1.2%), confirmatory factor analysis (n = 1, 1.2%), SEM/path analysis (n = 1, 1.2%), and cluster analysis (n = 1, 1.2%).
We identified the research traditions of the eight qualitative studies as follows: phenomenology (n = 3, 37.5%), grounded theory (n = 2, 25%), and naturalistic inquiry (n = 1, 12.5%); two were unspecified (25%). The most common qualitative recruitment method was criterion sampling (n = 5, 62.5%), followed by convenience (n = 3, 37.5%), homogenous (n = 2, 25%), snowball/chain (n = 2, 25%), intensity (n = 2, 25%), and stratified purposeful (n = 1, 12.5%) sampling procedures. (Several studies used multiple recruitment methods, resulting in totals greater than 100%.) There were 12 data sources reported across the eight qualitative studies, falling into the following categories: individual interviews (n = 7, 58.3%), focus group interviews (n = 2, 16.7%), artifacts/documents (n = 2, 16.7%), and observations (n = 1, 8.3%). Trustworthiness strategies included prolonged engagement (n = 7, 13.7%); use of a research team (n = 6, 11.8%); researcher reflexivity, triangulation of data sources, thick description, and simultaneous data collection and analysis (n = 5 each, 9.8%); peer debriefing, audit trail, and member checking (n = 4 each, 7.8%); theory development (n = 3, 5.9%); and one each (2%) of external auditor, memos and/or field notes, and persistent observation.
Limitations Within Sampled Studies
Of the 46 empirical studies, 44 (95.7%) reported limitations. Limitations included design issues related to sampling/generalizability (n = 38, 82.6%); self-report/social desirability (n = 23, 50.0%); instrumentation (n = 20, 43.5%); research design concerns related to the ability to directly measure a variable of interest (e.g., clinical work, training activities; n = 7, 15.2%); experimenter/researcher effects (n = 3, 6.5%); use of less sophisticated statistical methods (n = 3, 6.5%); and use of an analogue design (n = 2, 4.3%). Within identified limitations, researchers most often cited limited generalizability with regard to sample composition (i.e., lack of diversity, small sample sizes, homogenous samples). Social desirability was noted as a potential limitation given the nature of the topics (i.e., racism, prejudice, privilege). Instrumentation issues pertained to weak reliability for samples, limited validity evidence, and disadvantages of self-administration. Researchers also acknowledged the difficulty of conceptualizing WRI constructs as distinct, noting the multidimensional nature of WRI and the challenge in discriminating between complex constructs.
Key Findings
There were three main categories of key findings. The largest category (i.e., 51 codes) consisted of identification of correlates and predictors of Whiteness/White racial identity. Findings related to gender and WRI were mixed, with several articles (n = 7) noting differences in WRI stages among men and women (i.e., women more frequently endorsing Contact and Pseudo-Independent stages, men more frequently endorsing Disintegration and Reintegration), and others determining gender differences were not significant in predicting WRI (n = 2). Additional findings included significant positive correlations and predictive effects between WRI, racism, MCC, personality variables (i.e., Openness linked with higher WRI and Neuroticism linked with lower WRI), and working alliance. Other constructs, such as ego defenses, emotional states, social–cognitive maturity, fear, and religious orientation, also demonstrated significant alignment with WRI stages. White guilt, the impact of personal relationships with communities of color, and lower levels of race salience (i.e., race essentialism) were also linked to Whiteness.
The next largest category (i.e., 32 codes) related to critiques of White racial identity models and measures. Most of the conceptual articles focused in some way on this category, often criticizing WRI models as subjective and lacking in complexity, or critiquing WRI measurement and previous research because of issues of reliability and validity. Several stressed caution for interpreting WRI according to existing models, suggesting a more nuanced approach of contextualizing individuals and accounting for within-group variation. Empirical articles also suggested that achieving and maintaining higher levels of WRI, particularly anti-racist identities and attitudes, may be more difficult than originally conceptualized and may require levels of engagement that are difficult to maintain in a racist society.
Training implications and impact (i.e., 24 codes), noted within empirical and conceptual studies, included tips for addressing Whiteness in counselor education (e.g., offering courses focused on Whiteness and anti-racism) and in supervision (e.g., openly discussing race, privilege, and oppression; matching supervisors and supervisees by racial identity when possible). Empirical studies noted mixed improvement in WRI stages and MCC as a result of both general progression through a counselor training program as well as specific multicultural training: Training was linked to increased White guilt and privilege awareness (n = 15), though others did not find significant effects of training (n = 2). Conceptual articles emphasized focusing training on anti-racist development. Collectively, these findings and subsequent implications encourage further research and reflection on the correlates of WRI and MCC, factors facilitating growth, and ways to improve research and measurement to enhance critical engagement with these topics.
Discussion and Implications
In this content analysis of 63 articles covering a 35-year period across eight national counseling journals, we found that a third of counseling journals featured scholarship specifically related to Whiteness, with the Journal of Counseling & Development and the Journal of Multicultural Counseling and Development accounting for more than 76% of the total sampling units. The majority of the articles were quantitative, followed by theoretical and qualitative articles. Topical focus was centered on correlates of Whiteness with variables such as racism and color-blindness, other non-racial components of cultural identity, training implications, and theory development (see Table 3). Interestingly, many Whiteness constructs discussed in the general literature (e.g., White fragility, modern racism, psychosocial costs) were not addressed in counseling scholarship; the primary constructs discussed were WRI and White privilege.
The sample composition across empirical studies was primarily White and female with a mean age in the late 20s and with undergraduate students comprising on average 22% of the article samples. In addition, practitioners, site supervisors, the general population, and EdS trainees only comprised between 1.6% and 13.1% of the samples. Schooley et al. (2019) cautioned against the overuse of undergraduate students when measuring Whiteness constructs because of the complexities and situational influences of WRI development, and this warning seems to hold relevance for counseling scholarship. Methodological selection mirrored previously found patterns in counseling research (Wester et al., 2013), with most quantitative studies relying upon convenience sampling and correlational design with ANOVA/MANOVA as the selected statistical analyses. In addition, 26.3% of the articles included an intervention. For the qualitative studies, the most frequently used tradition and method was phenomenology and individual interviews.
Overall, findings from the sample support theoretically consistent relationships with Whiteness and/or WRI, including their predictive nature of MCC, social desirability, working alliance, and lower race salience. However, findings were mixed on the role of gender and MCC in connection to a training intervention. Additionally, some studies in our sample critiqued WRI models, cautioning against oversimplification of a complex model and highlighting issues in measurement due to subjectivity and social desirability. This critique aligns with previous researchers who have suggested that WRI is more complex than previously indicated (see Helms, 1984, 1990, 2017). WRI may be highly situational and affected by within-group differences and internal and external factors that complicate accuracy in assessment and clinical application. Of particular concern in previous research is the ability to properly conceptualize and measure the Contact and Autonomy stages (Carter et al., 2004). Both stages have demonstrated difficulty in assessment due to an individual’s lack of awareness of personal racism at each stage (Carter et al., 2004; Rowe, 2006). The Autonomy status, in particular, could be impacted by what DiAngelo (2018) referred to as “progressive” or “liberal” Whiteness, in which efforts are more focused on maintaining a positive self-image than engaging with people of color in meaningful ways (Helms, 2017). Therefore, although there are some consistencies and corroborations within counseling literature and other scholarship on Whiteness, the critiques and complexities of the topic suggest further inquiry is needed.
Implications for Counseling Research
Based on our findings, we note several directions for future research. First, future studies could include greater demographic diversity as well as more participation from counselor educators, site supervisors, practitioners, and clients across the ACES regions. Including counselor educators in empirical studies can highlight aspects of Whiteness that influence their approach to training and scholarship. With regard to increasing scholarship involving site supervisors, practitioners, and clients, Hays et al. (2019) highlighted several strategies for recruiting sites to participate as co-researchers as well as obtaining clinical samples through strengthening research–practice partnerships. Additionally, recruiting more heterogenous samples—in terms of sample composition and demographics—could provide much-needed psychometrics for available measures as well as refined operationalization of Whiteness. Additional research can further explore individual correlates and predictors to enhance counselor training, supervision, and practice by identifying opportunities for assessment and development at each level of WRI.
Second, most reports of empirical studies in our sample noted concerns with sampling and generalizability, social desirability, and instrumentation. Given these concerns, researchers are to be cautious about the interpretation and application of previous study findings using the White Racial Identity Attitudes Scale (WRIAS). In particular, scholarship within counseling and related disciplines reveals substantial psychometric concerns with the WRIAS’s Contact and Autonomy stages (Behrens, 1997; Carter et al., 2004; Hays et al., 2008; Malott et al., 2015). The complex nature of assessing WRI-related behaviors that may run counter to a person’s intentions (Carter et al., 2004; DiAngelo, 2018) needs further study. Additionally, given the concerns with self-report measures due to socially desirable responses, it seems problematic that none of the current quantitative articles used performance measures, which could help to compare self-report with behaviors and client outcomes. Future research can therefore emphasize behavioral assessments and clinical outcomes to correlate findings with WRI models.
Third, the use of intervention-based research could explore core components of instruction, awareness, and experience to identify facilitative strategies for enhancing WRI in both counselor trainees and within client populations. Because White people are negatively impacted by racism and restricted racial identity, encouraging growth in WRI in both clinical and educational settings can be a means of promoting wellness for counselors and clients. Thus, research is needed that can carefully examine the complexities of WRI development and address difficulties in assessment due to defensive strategies such as White fragility and lack of insight into the various intra- and interpersonal manifestations of racism.
Finally, though the research examined within this analysis advances the application of WRI theory and practices within the counseling profession, opportunities exist for further exploration of WRI development and the intersection with multiple constructs of Whiteness discussed across the helping professions (e.g., White fragility, color-blindness, race essentialism). The articles analyzed for the present study reflect an assumption that more advanced WRI attitudes, lower color-blind attitudes, greater anti-racism attitudes, and greater awareness of White privilege can yield more positive clinical outcomes. However, given some of the aforementioned limitations, this assumption has not been empirically tested in counseling. Because clients’ and counselors’ affective, cognitive, and behavioral responses to Whiteness can affect the counseling relationship, process, and treatment selection and outcomes (Helms, 1984, 2017), it is imperative that this assumption is properly tested. Empirical and conceptual work should therefore further explore Whiteness constructs to elucidate how White attitudes and behaviors at each stage function for self-protection and move toward aspirational goals of anti-racism and ethical and competent clinical application.
Implications for Counseling Practice, Training, and Supervision
In addition to future research directions related to Whiteness and WRI, findings allow for recommendations for counseling practice, training, and supervision. For example, extant literature emphasizes the importance of racial self-awareness, including an understanding of White privilege and racism. The practice of centering discussions on the harmful impacts of Whiteness, as well as the various ways Whiteness can manifest in therapeutic spaces, allows counselors to examine racial development within and around themselves. White counselors who are able to reflect on their own racial privileges and begin the conversation (i.e., broaching) about racial differences can increase the working alliance quality with clients of color (Burkard et al., 1999; Day-Vines et al., 2007; Helms, 1990).
Furthermore, counselors should heed the themes within the key findings of our sample, following recommendations for taking a broad, contextual, and critical view when understanding and applying WRI models. Counselors can be encouraged to view WRI as Helms (2019) intended—as a broad and complex interplay of relational dynamics, connected with other Whiteness constructs, and following an intentional progression toward anti-racism and social justice. Counselors should take particular caution with viewing the Autonomy stage as a point of arrival, given conflicting findings and the possibility that White people in higher stages may engage in behaviors to assuage guilt rather than to be true allies for people of color. The Helms model associates such attitudes and actions with the Pseudo-Independence stage (Helms, 2019), yet findings cast some doubt as to whether White people who score within the Autonomy stage have actually reached that level of WRI development. Counselors should thus interpret assessment scores with caution and ensure they are also assessing their own level of development and subsequent impact on others through continued and honest reflection and positive engagement in cross-racial relationships.
Regarding training, course content focusing on exploring Whiteness, WRI, and other racial identities through use of an anti-racism training model integrated throughout the curriculum can help students become comfortable with potential cross-racial conflicts and broaching Whiteness (Malott et al., 2015). The Council for Accreditation of Counseling and Related Educational Programs (CACREP) can similarly stress these desired student outcomes when updating standards for counselor training, specifically mentioning the importance of WRI as part of multicultural preparation. It is imperative to begin conversations about race and identity development to create opportunities for growth for any student who may be challenged with their racial identity and how it might impact their clients. Furthermore, counselor educators and supervisors can ask counselors in training to brainstorm how counseling and other services might be developed or adapted in order to contribute toward anti-racist goals and outcomes.
Limitations
The current findings are to be interpreted with caution, as the scope of our study presents some limitations. First, we chose to limit inclusion criteria to national peer-reviewed counseling journals in order to focus on scholarship within professional counseling journals, and therefore our results cannot be generalized to similar disciplines, dissertation research, book chapters, or more localized outlets such as state journals. Our coding sheet was also limited in the information it collected, including sample demographics. Though not all studies included the same demographic variables, we did not capture specifics related to a sample’s political affiliation, religious orientation, ability status, socioeconomic status, diversity exposure, or other details that could have better conceptualized the samples and findings. Additionally, we limited our search to the keywords related to Whiteness that we had identified in related literature but may have missed studies employing constructs outside of our search criteria. Our own identities as White academics may also have influenced the coding process as well as the subsequent interpretation of findings.
Conclusion
This content analysis provides a snapshot of Whiteness scholarship conducted in the counseling profession during a 35-year period. Patterns of study design and analysis were noted, and key findings were summarized to provide context and comparison within the broader literature. Identified themes and relationships highlight theoretically consistent findings for some Whiteness constructs, as well as showcase research gaps that need to be addressed before counselors can apply findings to practice and training. Finally, this content analysis demonstrates the need for a greater understanding of Whiteness and related constructs in counselor education, training, and practice.
Conflict of Interest and Funding Disclosure
The authors reported no conflict of interest
or funding contributions for the development
of this manuscript.
References
American Counseling Association. (2014). ACA code of ethics.
Behrens, J. T. (1997). Does the White Racial Identity Attitude Scale measure racial identity? Journal of Counseling Psychology, 44(1), 3–12. https://doi.org/10.1037/0022-0167.44.1.3
Burkard, A. W., Ponterotto, J. G., Reynolds, A. L., & Alfonso, V. C. (1999). White counselor trainees’ racial identity and working alliance perceptions. Journal of Counseling & Development, 77(3), 324–329. https://doi.org/10.1002/j.1556-6676.1999.tb02455.x
Carter, R. T., Helms, J. E., & Juby, H. L. (2004). The relationship between racism and racial identity for White Americans: A profile analysis. Journal of Multicultural Counseling and Development, 32(1), 2–17. https://doi.org/10.1002/j.2161-1912.2004.tb00357.x
Choney, S. K., & Behrens, J. T. (1996). Development of the Oklahoma Racial Attitudes Scale Preliminary Form (ORAS-P). Multicultural Assessment in Counseling and Clinical Psychology. https://digitalcommons.unl.edu/burosbookmulticultural/10
Claney, D., & Parker, W. M. (1989). Assessing White racial consciousness and perceived comfort with Black individuals: A preliminary study. Journal of Counseling & Development, 67(8), 449–451. https://doi.org/10.1002/j.1556-6676.1989.tb02114.x
Day-Vines, N. L., Wood, S. M., Grothaus, T., Craigen, L., Holman, A., Dotson-Blake, K., & Douglass, M. J. (2007). Broaching the subjects of race, ethnicity, and culture during the counseling process. Journal of Counseling & Development, 85(4), 401–409. https://doi.org/10.1002/j.1556-6678.2007.tb00608.x
DiAngelo, R. (2018). White fragility: Why it’s so hard for White people to talk about racism. Beacon Press.
Frankenberg, R. (1993). White women, race matters: The social construction of Whiteness. University of Minnesota Press.
Hays, D. G., Bolin, T., & Chen, C.-C. (2019). Closing the gap: Fostering successful research-practice partnerships in counselor education. Counselor Education and Supervision, 58(4), 278–292. https://doi.org/10.1002/ceas.12157
Hays, D. G., Chang, C. Y., & Havice, P. (2008). White racial identity statuses as predictors of White privilege awareness. The Journal of Humanistic Counseling, Education and Development, 47(2), 234–246. https://doi.org/10.1002/j.2161-1939.2008.tb00060.x
Helms, J. E. (1984). Toward a theoretical explanation of the effects of race on counseling: A Black and White model. The Counseling Psychologist, 12(4), 153–165. https://doi.org/10.1177/0011000084124013
Helms, J. E. (Ed.) (1990). Black and White racial identity: Theory, research, and practice. Praeger.
Helms, J. E. (1995). An update of Helms’ White and people of color racial identity models. In J. G. Ponterotto, J. M. Casas, L. A. Suzuki, & C. M. Alexander (Eds.), Handbook of multicultural counseling (1st ed.; pp. 181–196). SAGE.
Helms, J. E. (2017). The challenge of making Whiteness visible: Reactions to four Whiteness articles. The Counseling Psychologist, 45(5), 717–726. https://doi.org/10.1177/0011000017718943
Helms, J. E. (2019). A race is a nice thing to have: A guide to being a White person or understanding the White persons in your life (3rd ed.). Cognella.
Helms, J. E., & Carter, R. T. (1990). Development of the White Racial Identity Inventory. In J. E. Helms (Ed.), Black and White racial identity: Theory, research, and practice (pp. 67–80). Greenwood Press.
Henry, P. J., & Sears, D. O. (2002). The Symbolic Racism 2000 Scale. Political Psychology, 23(2), 253–283. https://doi.org/10.1111/0162-895X.00281
LoMartire, R. (2020). Rel: Reliability coefficients. R package version. 1.4.1. https://cran.r-project.org
Malott, K. M., Paone, T. R., Schaefle, S., Cates, J., & Haizlip, B. (2015). Expanding White racial identity theory: A qualitative investigation of Whites engaged in antiracist action. Journal of Counseling & Development, 93(3), 333–343. https://doi.org/10.1002/jcad.12031
McConahay, J. B. (1986). Modern racism, ambivalence, and the Modern Racism Scale. In J. F. Dovidio & S. L. Gaertner (Eds.), Prejudice, discrimination, and racism (pp. 91–125). Academic Press.
McIntosh, P. (1988). White privilege and male privilege: A personal account of coming to see correspondences through work in women’s studies (Wellesley College, Center for Research on Women Working Paper, No. 189). Wellesley College. https://www.wcwonline.org/images/pdf/White_Privilege_and_Male_Privilege_Personal_Account-Peggy_McIntosh.pdf
Neuendorf, K. A. (2017). The content analysis guidebook (2nd ed.). SAGE.
Neville, H. A., Awad, G. H., Brooks, J. E., Flores, M. P., & Bleumel, J. (2013). Color-blind racial ideology: Theory, training, and measurement implications in psychology. American Psychologist, 68(6), 455–466. https://doi.org/10.1037/a0033282
Rowe, W. (2006). White racial identity: Science, faith, and pseudoscience. Journal of Multicultural Counseling & Development, 34(4), 235–243. https://doi.org/10.1002/j.2161-1912.2006.tb00042.x
Schooley, R. C., Debbiesiu, L. L., & Spanierman, L. B. (2019). Measuring Whiteness: A systematic review of instruments and call to action. The Counseling Psychologist, 47(4), 530–565. https://doi.org/10.1177/0011000019883261
Singh, A. A., & Shelton, K. (2011). A content analysis of LGBTQ qualitative research in counseling: A ten-year review. Journal of Counseling & Development, 89(2), 217–226. https://doi.org/10.1002/j.1556-6678.2011.tb00080.x
Spanierman, L. B., & Heppner, M. J. (2004). Psychosocial Costs of Racism to Whites Scale (PCRW): Construction and initial validation. Journal of Counseling Psychology, 51(2), 249–262. https://doi.org/10.1037/0022-0167.51.2.249
Tawa, J. (2017). The Beliefs About Race Scale (BARS): Dimensions of racial essentialism and their psychometric properties. Cultural Diversity and Ethnic Minority Psychology, 23(4), 516–526. https://doi.org/10.1037/cdp0000151
U.S. Census Bureau. (2020). Public Use Microdata Sample data. https://www.census.gov/programs-surveys/acs/data/pums.html
Wester, K. L., Borders, L. D., Boul, S., & Horton, E. (2013). Research quality: Critique of quantitative articles in the Journal of Counseling & Development. Journal of Counseling & Development, 91(3), 280–290. https://doi.org/10.1002/j.1556-6676.2013.00096.x
The authors would like to thank Cheolwoo Park for his invaluable assistance in this study. Hannah B. Bayne, PhD, LMHC (FL), LPC (VA), is an assistant professor at the University of Florida. Danica G. Hays, PhD, is a dean and professor at the University of Nevada Las Vegas. Luke Harness is a doctoral student at the University of Florida. Brianna Kane is a doctoral student at the University of Florida. Harness and Kane contributed equally to the project and share third authorship. Correspondence may be addressed to Hannah B. Bayne, 140 Norman Hall, Gainesville, FL 32611, hbayne@coe.ufl.edu.
Aug 20, 2021 | Volume 11 - Issue 3
Alexander T. Becnel, Lillian Range, Theodore P. Remley, Jr.
In a national sample of current school counselors with membership in the American School Counselor Association (N = 226), we examined the prevalence of suicide training among school counselors as well as differences in suicide assessment self-efficacy and workplace anxiety between school counselors who were exposed to student suicide and those who were not. The results indicate that 38% of school counselors were not prepared for suicide prevention during graduate training. Although school counselors’ exposure to suicide was not related to their workplace anxiety, those who were exposed to a student suicide attempt had higher suicide assessment self-efficacy scores than those who were not. This study demonstrates the impact of suicide exposure on school counselors and the need for additional suicide assessment training.
Keywords: school counselors, suicide, suicide assessment, self-efficacy, workplace anxiety
Suicide continues to be a growing concern for young people in the United States. Suicide is the second leading cause of death among children between the ages of 11 and 18, claiming the lives of 2,127 middle school– and high school–aged children in 2019 alone (Centers for Disease Control and Prevention [CDC], 2021). In 2019, a nationwide survey found that 18.8% of high school students reported seriously considering attempting suicide, 15.7% reported making a plan to attempt suicide, and 8.9% reported attempting suicide (Ivey-Stephenson et al., 2019). As youth suicide rates continue to rise (National Institute of Mental Health [NIMH], 2019), it is becoming increasingly important to understand how school counselors are prepared to work with suicidal youth, as well as the impact of suicidality on them.
Children and adolescents spend significant amounts of time at school, making school counselors the primary suicide and risk assessors for this population (American School Counselor Association [ASCA], 2020b). School counselors are more likely to assess youth for suicide risk than any other mental health professional (Schmidt, 2016). In 2002, a national study of ASCA members found that 30% of professional school counselors experienced a suicide-related crisis event while they were graduate student interns (Allen et al., 2002). In a more recent study, about two thirds of school counselors reported that they were conducting multiple suicide assessments each month (Gallo, 2018). Stickl Haugen et al. (2021) found that 79.8% of school counselors worked with a student who had previously attempted suicide and 36.7% experienced a student’s death by suicide. As school counselors become more frequently exposed to student suicide, it is important to understand their preparation for this role and the impact of these events on the school counselors themselves.
School Counselor Suicide and Crisis Training
Although school counselors are often exposed to student suicide, many school counselors lack appropriate crisis intervention and suicide assessment training (Allen et al., 2002; Springer et al., 2020; Wachter Morris & Barrio Minton, 2012) and lack confidence in their ability to assess students for suicide risk (Gallo, 2018; Schmidt, 2016). About 20 years ago, one third of school counselors entered the field without any formal crisis intervention coursework and nearly 60% did not feel adequately prepared to handle a school crisis event (Allen et al., 2002). Ten years later, school counselors did not fare any better, with less than a quarter of school counselors reporting that they completed a course in crisis intervention and nearly two thirds reporting that a crisis intervention course was not even offered during their master’s program (Wachter Morris & Barrio Minton, 2012). Not surprisingly, therefore, school counselors feel unprepared. In a national survey, 44% of school counselors reported being unprepared for a student suicide attempt, and 57% reported being unprepared for a student’s death by suicide (Solomonson & Killam, 2013). In another national survey, Gallo (2018) found that only 50% of school counselors thought that their training adequately prepared them to assess suicidal students, and only 59% felt prepared to recognize a student who was at risk. These results are especially troubling considering that the Council for Accreditation of Counseling and Related Educational Programs (CACREP) requires school counselor education programs to provide both suicide prevention and suicide assessment training (CACREP, 2015).
Exposure to Suicide and Self-Efficacy
Mental health professionals often question their professional judgment following an exposure to suicide (Sherba et al., 2019; Thomyangkoon & Leenars, 2008). Consequently, it is imperative to explore school counselor self-efficacy in the aftermath of a student suicide. Self-efficacy is the degree to which individuals believe that that they can achieve self-determined goals, and individuals are more likely to be successful in achieving those goals simply by belief in their success (Bandura, 1986). Counselor self-efficacy is defined as counselors’ judgment of their ability to provide counseling to their clients (Larson et al., 1992). As counselors spend more years in practice, their self-efficacy increases (Goreczny et al., 2015; Kozina et al., 2010; Lent et al., 2003). Further, counselor education faculty have significantly higher levels of suicide assessment self-efficacy than their students (Douglas & Wachter Morris, 2015). The relationship between counselor self-efficacy and work experience is well documented, so it is imperative to control for years of counseling experience as a potential covariate when studying other factors that can affect counselor self-efficacy.
Although the literature regarding school counselors’ exposure to suicide is sparse, more studies have focused on the experiences of related professions, such as clinical counselors, social workers, psychiatrists, and psychologists. In a national survey, 23% of clinical counselors experienced a client’s death by suicide at some point in their career (McAdams & Foster, 2002). In the aftermath of their clients’ deaths by suicide, those counselors reported a loss of self-esteem and an increase of intrusive thoughts. They increased referrals for hospitalization for clients at risk, gave increased attention to signs for suicide, and increased their awareness of legal liabilities in their practices. In a study of community-based mental health professionals who experienced a client death by suicide, one third considered changing careers and about 15% considered early retirement in the aftermath of the suicide (Sherba et al., 2019). Psychologists who felt responsible for the death were more likely to experience a sense of professional incompetence (Finlayson & Graetz Simmonds, 2018). Among psychiatrists, those who experienced a patient’s suicidal death were more likely in the future to suggest hospitalization for patients who showed risk signs for suicide (Greenberg & Shefler, 2014). Additionally, 20% of the psychiatrists in Thomyangkoon and Leenars’s (2008) study considered changing professions after experiencing a patient death by suicide. Given the similarities in these professions, it is reasonable to suggest that school counselors may feel more anxious about their jobs following a suicide exposure.
To date, there are only three published studies that explore suicide exposures among school counselors (Christianson & Everall, 2008; Gallo et al., 2021; Stickl Haugen et al., 2021). In a qualitative study, high school counselors felt a lack of personal support from their fellow staff members and noted the importance of self-care in the aftermath of a student death by suicide. Additionally, those who lost students to suicide thought that a lack of practice standards made it difficult to navigate these difficult situations (Christianson & Everall, 2008). In another qualitative study, elementary school counselors who worked with suicidal students recognized their important work in preventing suicide but also reported a lack of suicide prevention training opportunities tailored toward working with young children (Gallo et al., 2021). In a quantitative study, most school counselors thought that a student’s death by suicide left both personal and professional impacts on their lives. These school counselors most often reported low mood, a sense of guilt or responsibility, and preoccupation with the incident as personal impacts. They also identified heightened awareness of suicide risk, more professional caution around suicide, and seeking additional training as professional impacts. The researchers suggested that future studies should determine if the number of student deaths by suicide influences the impact of the suicide exposure (Stickl Haugen et al., 2021). However, this study did not examine anxiety, an important personal impact, nor did it examine self-efficacy in dealing with suicide attempts, a more likely occurrence than suicide deaths.
Research Questions
The following research questions guided this study:
- What is the prevalence of graduate and postgraduate training in suicide prevention, crisis intervention, and suicide postvention among current school counselors?
- Are there differences in suicide assessment self-efficacy between school counselors exposed and not exposed to student deaths by suicide and suicide attempts, controlling for years of school counseling experience as a covariate?
- Does the number of suicide exposures relate to school counselors’ level of suicide assessment self-efficacy when controlling for years of school counseling experience as a covariate?
- Are there differences in workplace anxiety between school counselors exposed and not exposed to student deaths by suicide and suicide attempts, controlling for years of school counseling experience as a covariate?
Method
Procedure
We obtained approval from our university’s Human Subjects Protection Review Committee prior to conducting this study. Using a random number generator, we randomly selected 5,000 members from the ASCA member directory to receive a link to the survey. When potential participants clicked the link, they viewed and agreed to an informed consent statement before they were permitted to view the survey. This statement also informed participants that they could stop participation or withdraw their participation at any time. Upon agreement to the informed consent statement, participants were directed to the survey. This online survey was administered via Qualtrics, which allowed them to respond anonymously.
Participants
From the 5,000 potential participants, 422 began the survey. From these participants, 101 opened the survey and did not answer any questions, 5 did not agree to the informed consent statement, 29 reported that they were not current school counselors, and 60 did not complete the survey. Thus, 226 of the 5,000 ASCA members completed the survey (4.52%). An a priori power analysis (Cohen, 1992) with a power of .8, a medium effect size, and α = .05 determined that the required sample size for our most robust test was 175.
Participants were 226 current school counselors (201 women, 88.9%; 25 men, 11.1%). The racial categories included 192 White (85%), nine Black or African American (4%), eight “other” races (3.5%), six Asian (2.7%), five biracial or multiracial (2.2%), three American Indian or Alaska Native (1.3%), and three not reporting race (1.3%). The ethnicity categories included 210 participants (92.9%) who were not of Hispanic or Latino or Spanish origin and 16 (7.1%) who were of Hispanic or Latino or Spanish origin. The mean age was 39 years (SD = 10.68), and the mean years of experience working as a school counselor was 7 (SD = 6.98). With regard to school setting, 52 school counselors worked in an elementary or primary school (23%), 58 worked in a middle or junior high school (25.7%), 81 worked in a high school (35.8%), 19 worked in a K–12 school (8.4%), and 16 worked in another type of school not listed (7.1%). Although ASCA does not provide demographic information about their members, this sample is similar in its demographic makeup to the sample in Gilbride et al.’s (2016) study, which sought to describe the demographic identity of ASCA’s membership.
Instrumentation
The survey packet consisted of three instruments: the demographic questionnaire, the Counselor Suicide Assessment Efficacy Survey (CSAES; Douglas & Wachter Morris, 2015), and the Workplace Anxiety Scale (WAS; McCarthy et al., 2016).
Demographic Questionnaire
Using a demographic questionnaire, we asked participants to identify the following information: sex, race, ethnicity, age, years of school counseling experience, and school type (e.g., high school, middle school). Additionally, we asked participants to identify the types of suicide exposures that they have encountered in their school counseling careers. If they reported exposure to either deaths by suicide or suicide attempts, the survey followed up with additional questions about the number of exposures, the amount of time since the first suicide exposure, and the amount of time since the most recent suicide exposure. We asked participants if their schools had crisis plans or crisis teams. We also asked participants if they had training in suicide prevention, crisis intervention, and suicide postvention during graduate school and the number of postgraduate training hours in each of these areas.
CSAES
The CSAES evaluates counselors’ confidence in their ability to assess clients for suicide risk and intervene with a client at risk of suicide. It includes 25 items in four subscales: General Suicide Assessment, Assessment of Personal Characteristics, Assessment of Suicide History, and Suicide Intervention. Each item is rated on a 5-point Likert scale from 1 (not confident) to 5 (highly confident). High scores indicate high self-efficacy. Among school counselors in the original study, each subscale had good internal consistency (α = .88–.81) and acceptable goodness of fit. As suggested by Douglas and Wachter Morris (2015), we scored each subscale separately and averaged each score. This process created four comparable subscale scores.
WAS
The WAS measures participants’ job-related anxiety. This scale asks participants to rate eight items such as “I worry that my work performance will be lower than that of others at work” on a 5-point scale from 1 (strongly disagree) to 5 (strongly agree). High scores on the WAS indicate higher levels of job-related anxiety. The WAS demonstrated good internal consistency (α = .94) and acceptable goodness of fit (McCarthy et al., 2016).
Data Analysis
To address our first research question, we used descriptive statistics to examine the prevalence of training among the participants. We used analysis of covariance (ANCOVA) to detect differences in both suicide assessment self-efficacy (CSAES scores) and workplace anxiety (WAS scores) while controlling for years of school counseling experience between school counselors who were exposed to student suicide and those who were not. We considered exposure to deaths by suicide and exposure to suicide attempts as different types of exposure. Therefore, we performed a total of four ANCOVAs: (a) differences in CSAES scores between school counselors exposed to deaths by suicide and those not exposed, (b) differences in CSAES scores between school counselors exposed to suicide attempts and those not exposed, (c) differences in WAS scores between school counselors exposed to deaths by suicide and those not exposed, and (d) differences in WAS scores between school counselors exposed to suicide attempts and those not exposed. We also used analysis of variance (ANOVA) to determine the difference in years of school counseling experience between those exposed to suicide and those not exposed. To determine the relationship between the number of suicide exposures and counselor suicide assessment self-efficacy, we also completed two partial correlations between the number of exposures to student death by suicide and CSAES scores, and the number of exposures to student suicide attempts and CSAES scores.
Results
A total of 64 school counselors reported that they experienced a student death by suicide during their school counseling experience (28.3%), with a mean of 2.11 deaths (SD = 2.21). On average, their first suicide death was 6.72 years ago (SD = 5.87), and the most recent suicide death was 3.84 years ago (SD = 3.88). A total of 124 participants experienced a student suicide attempt during their school counseling experience (54.9%), with a mean of 5.36 attempts (SD = 10.54). On average, the first suicide attempt was 5.91 years ago (SD = 6.07), and the most recent attempt was 1.82 years ago (SD = 2.10). Of all 226 school counselors, 195 worked in schools that have crisis plans (86.3%), and 170 worked in schools that have crisis teams (75.2%).
Suicide Training
Regarding suicide prevention training during their graduate program, 140 (62%) received some training, but 86 (38%) received no training. Regarding crisis intervention training during their graduate program, 142 (63%) received some, but 84 (37%) received none. Regarding suicide postvention, only 87 (38.5%) received some, but 139 (61.5%) received none. The number of postgraduate training hours varied widely for each preparation type. For suicide prevention, training hours averaged 12.20 (SD = 28.61); for crisis intervention, training hours averaged 9.04 (SD = 15.51); and for suicide postvention, training hours averaged 6.45 (SD = 18.14). We removed one participant’s postgraduate training data that was more than 3 standard deviations higher than the mean. In order to better illustrate the distribution of postgraduate training hours, we grouped the number of training hours into four categories: 0 hours, 1–10 hours, 11–50 hours, and more than 50 hours of postgraduate training. Nearly a quarter of the participants (24.3%) received no postgraduate training in suicide prevention, about a third of the participants (30.5%) received no postgraduate training in crisis intervention, and half (50.4%) received no postgraduate training in suicide postvention.
To further demonstrate the disparity of suicide training, cross-tabulation was performed between graduate training and the number of postgraduate training hours. We reported this data in Table 1. Most surprisingly, 25 school counselors (11.1%) received no graduate training in suicide prevention, nor any postgraduate hours of training in suicide prevention; another 45 (19.9%) received no graduate training and only 10 or fewer hours of postgraduate training in suicide prevention, making nearly 1 in 3 school counselors unprepared to provide suicide prevention services. Crisis intervention fared similarly with 26 school counselors (11.5%) reporting no graduate training and no postgraduate training hours and 41 school counselors (18.1%) reporting no graduate training and 10 or fewer postgraduate training hours. Again, nearly 1 in 3 school counselors were not adequately prepared to provide this important service. Crisis postvention fared the worst, with 80 school counselors (35.4%) reporting that they received no graduate training and no postgraduate training hours, and 46 school counselors (20.4%) reporting no graduate training and fewer than 10 hours of postgraduate training. More than half of the school counselors surveyed are unprepared to face the aftermath of a suicide.
Table 1
Graduate Training and Postgraduate Training Hours
| Number of postgraduate training hours |
Received graduate training |
Did not receive graduate training |
|
Frequency |
Percentage |
Frequency |
Percentage |
| Suicide Prevention |
|
|
|
|
| 0 hours |
30 |
13.3 |
25 |
11.1 |
| 1–10 hours |
73 |
32.3 |
45 |
19.9 |
| 11–50 hours |
29 |
12.8 |
15 |
6.6 |
| 50 or more hours |
8 |
3.6 |
1 |
0.4 |
| Total |
140 |
62.0 |
86 |
38.0 |
|
|
|
|
|
| Crisis Intervention |
|
|
|
|
| 0 hours |
43 |
19.0 |
26 |
11.5 |
| 1–10 hours |
69 |
30.5 |
41 |
18.1 |
| 11–50 hours |
26 |
11.5 |
16 |
7.0 |
| 50 or more hours |
4 |
1.8 |
1 |
0.4 |
| Total |
142 |
63.0 |
84 |
37.0 |
|
|
|
|
|
| Suicide Postvention |
|
|
|
|
| 0 hours |
34 |
15.0 |
80 |
35.4 |
| 1–10 hours |
37 |
16.4 |
46 |
20.4 |
| 11–50 hours |
12 |
5.3 |
11 |
4.8 |
| 50 or more hours |
4 |
1.8 |
2 |
0.9 |
| Total |
87 |
38.5 |
139 |
61.5 |
Suicide Exposure and Suicide Assessment Self-Efficacy
An ANOVA indicated that school counselors exposed to a student death by suicide had significantly more years of school counseling experience (M = 11.9, SD = 7.87) than school counselors not exposed to a student death by suicide (M = 5.1, SD = 5.56): F(1, 224) = 21.512, p < .001. Controlling for years of school counseling experience as a covariate, an ANCOVA indicated that there was no significant difference between these two groups in General Suicide Assessment, F(1, 223) = .316, p = .574; Assessment of Personal Characteristics, F(1, 223) = .156, p = .694; Suicide Intervention, F(1, 223) = .028, p = .867; or Assessment of Suicide History, F(1, 223) = 1.095, p = .133.
Similarly, results of an ANOVA indicated that school counselors exposed to student suicide attempts had significantly more years of school counseling experience (M = 8.8, SD = 7.31) than counselors not exposed (M = 4.9, SD = 5.94): F(1, 224) = 8.055, p = .005. Controlling for years of school counseling experience, an ANCOVA indicated significant differences between the two groups in General Suicide Assessment, F(1, 223) = 6.014, p = .015; Assessment of Personal Characteristics, F(1, 223) = 7.140, p = .008; and Suicide Intervention, F(1, 223) = 6.671, p = .010; but not Assessment of Suicide History, F(1, 223) = .763, p = .383. Overall, effect sizes were small.
Number of Exposures and Self-Efficacy
A partial correlation between the number of suicide exposures and CSAES scores while controlling for years of school counseling experience was not statistically significant. There was no significant relationship between the number of death by suicide exposures and General Suicide Assessment, r(61) = .137, p = .285; Assessment of Suicide History, r(61) = .207, p = .104; Assessment of Personal Characteristics, r(61) = .170, p = .184; or Suicide Intervention, r(61) = .077, p = .551. Likewise, there was also no significant relationships between the number of suicide attempt exposures and General Suicide Assessment, r(121) = −.028, p = .762; Assessment of Suicide History, r(121) = .087, p = .336; Assessment of Personal Characteristics, r(121) = .131, p = .150; or Suicide Intervention, r(121) = .076, p = .401. We reported data regarding the frequency of suicide exposure in Table 2.
Suicide Exposure and Workplace Anxiety
In WAS scores, an ANCOVA revealed that there were no significant differences between school counselors exposed and not exposed to a student death by suicide when controlling for years of school counseling experience: F(1, 223) = .412, p = .522. Likewise, an ANCOVA revealed that there was no significant difference in WAS scores between school counselors exposed and not exposed to student suicide attempts when controlling for years of school counseling experience: F(1, 223) = .238, p = .626. To further illustrate the relationship between years of school counseling experience and workplace anxiety, a correlation coefficient indicated that these measures were significantly related, r(224) = −.260, p < .001.
Discussion
Among these school counselors, more than a quarter experienced a student’s death by suicide and over half experienced a student’s suicide attempt. These results are consistent with previous studies indicating that many school counselors will eventually be exposed to a student suicide during their careers (Allen et al., 2002; Gallo, 2018; Schmidt, 2016; Stickl Haugen et al., 2021). Given how common suicide experiences are, school counselors need to be trained to manage suicide-related crises.
Training
A surprising result in our study was the overall lack of suicide and crisis training reported. As seen in Table 1, nearly 2 in 5 school counselors (38%) reported that they received no suicide prevention training during their graduate education. Additionally, a quarter of the school counselors in this study reported that they received no postgraduate training in suicide prevention, and half reported between 1 and 10 hours. Thus, a sizeable portion of these school counselors were not adequately trained to incorporate suicide prevention programs into their school counseling practice. This finding echoes Gallo (2018), who reported that only 60% of school counselors felt prepared to identify students at risk for suicide. These rates are poor considering that CACREP requires suicide assessment and suicide prevention training as a standard of all counselor education programs (CACREP, 2015). Further, ASCA states that school counselors are responsible for identifying students at risk for suicide and ensuring that suicide prevention programs are in place in schools (ASCA, 2020a). The lack of training reported in this study is particularly troubling given that all of the participants in this study were members of ASCA.
Table 2
Frequency of Student Suicide Exposure
| Variable |
Frequency |
Percentage |
| Number of student deaths by suicide (n = 64) |
|
|
| 1 |
37 |
57.8 |
| 2 |
15 |
23.4 |
| 3–5 |
8 |
12.5 |
| > 5 |
4 |
6.3 |
| Years since first death by suicide (n = 64) |
|
|
| Within 1 year |
12 |
18.8 |
| 1 and 5 years |
25 |
39.0 |
| 6 and 10 years |
12 |
18.8 |
| More than 10 years |
15 |
23.4 |
| Years since most recent death by suicide (n = 64) |
|
|
| Within 1 year |
23 |
35.9 |
| Between 1 and 5 years |
26 |
40.6 |
| Between 6 and 10 years |
11 |
17.2 |
| More than 10 years |
4 |
6.3 |
| Number of student suicide attempts (n = 124) |
|
|
| 1 |
29 |
23.4 |
| 2 |
29 |
23.4 |
| 3–5 |
44 |
35.5 |
| > 5 |
22 |
17.7 |
| Years since first student attempt (n = 124) |
|
|
| Within 1 year |
30 |
24.2 |
| Between 1 and 5 years |
51 |
41.1 |
| Between 6 and 10 years |
21 |
17.0 |
| More than 10 years |
22 |
17.7 |
| Years since most recent attempt (n = 124) |
|
|
| Within 1 year |
84 |
67.7 |
| Between 1 and 5 years |
33 |
26.6 |
| Between 6 and 10 years |
6 |
4.8 |
| More than 10 years |
1 |
0.8 |
Crisis intervention training among school counselors also was poor. Comparable to the finding on suicide prevention training, a third of these school counselors reported no graduate training in crisis intervention. Further, more than a third reported that they did not receive postgraduate training hours in crisis intervention, and nearly half received between 1 and 10 hours of postgraduate training. A significant portion of these school counselors were not adequately prepared to respond to crises in their schools. These findings are slightly worse than the findings from 20 years ago when one third of a sample of school counselors reported that they entered the field with no formal crisis intervention coursework (Allen et al., 2002). However, these findings are much better than Wachter Morris and Barrio Minton’s (2012) study in which only 20% of school counselors completed a course in crisis intervention during their master’s degree program. Although preparation has increased, crisis preparation for school counseling students must continue to improve given that school counselors regularly experience crises (Wachter, 2006) and school counseling students often experience crises while still in graduate school completing their practicum or internship (Wachter Morris & Barrio Minton, 2012). The number of school counselors who experienced a student suicide event in the current study also supports the notion that school counselors regularly experience crises.
Most of these school counselors (61.5%) were not trained in their graduate programs for suicide postvention. Half of the surveyed school counselors reported that they received no postgraduate training hours in suicide postvention, with an additional 38% reported having received between 1 and 10 hours of postgraduate training. These results demonstrate that the vast majority of school counselors are not prepared to respond to a student’s suicidal death. This finding is distressing because school counselors play a vital role in the aftermath of a student suicide (Maples et al., 2005; Substance Abuse and Mental Health Services Administration [SAMHSA], 2016).
Suicide Assessment Self-Efficacy
Among these counselors, exposure to suicide alone did not make a difference with their suicide assessment self-efficacy or workplace anxiety. Years of school counseling experience appears to have a much more important role in suicide assessment self-efficacy and reduced anxiety than experiencing a student’s death by suicide. This result supports previous studies that found that years of experience has a positive relationship with self-efficacy (Douglas & Wachter Morris, 2015; Kozina et al., 2010; Lent et al., 2003). It also parallels the previous finding that the impact of a client’s suicidal death on a mental health practitioner decreases as the practitioner gains years of experience (McAdams & Foster, 2002). This result is different from Stickl Haugen et al.’s (2021) finding that school counselors who were exposed to a student death had higher levels of suicide assessment self-efficacy than those not exposed. However, Stickl Haugen et al. did not control for years of school counseling experience.
In contrast, exposure to suicide attempts did make a difference in suicide assessment self-efficacy. Even after controlling for years of experience, counselors with suicide attempt experience reported more efficacy in three of four subscales: General Suicide Assessment, Assessment of Personal Characteristics, and Suicide Intervention. One explanation for this outcome is that a student suicide attempt experience might motivate school counselors to learn about suicide and the risk factors associated. This explanation echoes Wagner et al.’s (2020) finding that counselors found additional training in the aftermath of a suicide very helpful. Many of the school counselors in the current study received no formal training, so it is possible that these experiences helped them fill in knowledge gaps, which in turn increased their self-efficacy. Training increases self-efficacy (Al-Darmaki, 2004; Mirick et al., 2016; Wachter Morris & Barrio Minton, 2012), so it is also possible that this experience worked as an in vivo training for these school counselors, increasing their self-efficacy.
Workplace Anxiety
Although mental health clinicians often experience symptoms of anxiety in the wake of a student suicide (McAdams & Foster, 2002; Sherba et al., 2019), present results suggest that a student’s death or suicide attempt does not have an impact on school counselors’ workplace anxiety. One explanation for this finding is the relationship between self-efficacy and anxiety. Overall, these school counselors had high self-efficacy scores in each of the four subscales. Previous research indicated that as self-efficacy increases, anxiety decreases (Bodenhorn & Skaggs, 2005; Gorecnzy et al., 2015; Larson et al., 1992). The death by suicide experience might not have impacted the counselors’ anxiety in this study because of their overall high self-efficacy. Another explanation is that the school counselors in this study had on average several years of experience (M = 7.05). Workplace anxiety levels decrease as school counselors spend more time on the job.
Implications
These results have several implications for school counselors and school counselor educators. First, school counselor educators and school counseling graduate programs should be aware of both the overall disparity of graduate-level suicide and crisis training as well as the benefits that training can provide to future school counselors. Regarding suicide prevention, crisis intervention, and suicide postvention, there are far too many untrained school counselors among the current body of school counselors. School counseling students are a vulnerable group when it comes to suicide assessment self-efficacy (Douglas & Wachter Morris, 2015), so it is imperative to support their professional development. School counseling graduate programs must increase their efforts to adequately train and prepare school counselors for suicide prevention, assessment, and intervention.
Second, school counselors should prepare to face the probability of having to deal with student suicide attempts and student deaths by suicide. If school counselors do not receive this training during their graduate programs, then they must seek continuing education opportunities that address suicide prevention, crisis intervention, and suicide postvention. Suicide and crisis training increases counselor self-efficacy (Mirick et al., 2016; Wachter Morris & Barrio Minton, 2012), making appropriate preparation vital. Additionally, school counselors could consider clinical supervision as a supplemental layer of support. School counselors receive supervision at much lower rates than their clinical counterparts (Perera-Diltz & Mason, 2012) even though many school counselors desire more supervision (Cook et al., 2012). Given that school counseling–focused supervision can increase self-efficacy (Tang, 2019) and school counselors feel a lack of personal support in the aftermath of a suicide (Christianson & Everall, 2008), school counselors must seek clinical supervision.
Finally, school counselor educators should consider training efforts that focus specifically on student suicide attempts. In the current study, school counselors exposed to a suicide attempt were more efficacious than school counselors not exposed to a student suicide attempt. Modeling these experiences through the use of specific role plays could help school counseling students feel more confident about their suicide assessment capabilities. Although CACREP does not require counselor education programs to provide suicide postvention training (CACREP, 2015), perhaps standards should adapt to include this important training area. Regardless, programs should also emphasize this training to best prepare school counselors.
Limitations and Suggestions for Future Research
Some factors limited this study. Although we had a national sample, we surveyed only current members of ASCA. It is possible that school counselors who are not members of ASCA might have responded differently. The study also had a low response rate (4.64%). Those school counselors who responded may be uniquely interested in this area, so the results may not reflect all school counselors. This study also did not limit the types of school counselors who could participate. It is possible that school counselors who work with younger children, such as elementary and primary school counselors, have less familiarity with suicide assessment and intervention than those school counselors who work with older children. The inclusion of these counselors could have affected the results of this study. Finally, this study did not ask participants if they graduated from a CACREP-accredited program. Because suicide prevention and assessment training are required components of CACREP-accredited programs, it is possible that school counselors who graduated from these programs may have different levels of training and self-efficacy than those trained in unaccredited programs.
For future studies, researchers should consider limiting their samples to specific levels of schooling such as elementary, middle, or high school. This change would help illustrate the nuanced differences among school counselors in different academic environments as well as increase focus on the school counselors who most often work with suicidal students. Future studies should also consider surveying a sample that includes all school counselors, not just ASCA members. Researchers should also differentiate between school counselors who graduated from CACREP-accredited programs and those who did not. Collecting this data would allow researchers to detect if there are any differences in suicide assessment training and self-efficacy between these two groups. Finally, future researchers should consider designing a study that seeks to identify the factors that most impact suicide assessment self-efficacy. Although this study showed that a suicide attempt experience could impact suicide assessment self-efficacy, other factors, such as self-confidence, could have a larger influence.
Suicide continues to be understudied in school counseling. Even though this study demonstrates the high likelihood that a school counselor will experience a student suicide, school counselors continue to report a lack of preparation in suicide prevention, crisis intervention, and suicide postvention. Although school counselors who experienced a student suicide attempt appeared to gain self-efficacy from their experiences, additional training in counseling suicidal students might help school counselors feel prepared before they face such serious situations. If additional training can help school counselors save students from suicide, then efforts must be made to adequately prepare them.
Conflict of Interest and Funding Disclosure
The authors reported no conflict of interest
or funding contributions for the development
of this manuscript.
References
Al-Darmaki, F. R. (2004). Counselor training, anxiety, and counseling self-efficacy: Implications for training psychology students from the United Arab Emirates University. Social Behavior and Personality: An International Journal, 32(5), 429–439. https://doi.org/10.2224/sbp.2004.32.5.429
Allen, M., Burt, K., Bryan, E., Carter, D., Orsi, R., & Durkan, L. (2002). School counselors’ preparation for and participation in crisis intervention. Professional School Counseling, 6(2), 96–102.
American School Counselor Association. (2020a). The school counselor and suicide risk assessment. https://schoolcounselor.org/Standards-Positions/Position-Statements/ASCA-Position-Statements/The-School-Counselor-and-Suicide-Risk-Assessment
American School Counselor Association. (2020b). The school counselor and student mental health. https://schoolcounselor.org/Standards-Positions/Position-Statements/ASCA-Position-Statements/The-School-Counselor-and-Student-Mental-Health
Bandura, A. (Ed.). (1986). Social foundations of thought and action: A social cognitive theory. Prentice Hall.
Bodenhorn, N., & Skaggs, G. (2005). Development of the School Counselor Self-Efficacy Scale. Measurement and Evaluation in Counseling and Development, 38(1), 14–28. https://doi.org/10.1080/07481756.2005.11909766
Centers for Disease Control and Prevention. (2021). Injury center: Violence prevention: Suicide prevention. https://webappa.cdc.gov/sasweb/ncipc/leadcause.html
Christianson, C. L., & Everall, R. D. (2008). Constructing bridges of support: School counsellors’ experiences of student suicide. Canadian Journal of Counselling, 42(3), 209–221.
Cohen, J. (1992). A power primer. Psychological Bulletin, 112(1), 155–159. https://doi.org/10.1037//0033-2909.112.1.155
Cook, K., Trepal, H., & Somody, C. (2012). Supervision of school counselors: The SAAFT model. Journal of School Counseling, 10(21). https://files.eric.ed.gov/fulltext/EJ981202.pdf
Council for Accreditation of Counseling and Related Educational Programs. (2015). 2016 CACREP standards. http://www.cacrep.org/wp-content/uploads/2017/08/2016-Standards-with-citations.pdf
Douglas, K. A., & Wachter Morris, C. A. (2015). Assessing counselors’ self-efficacy in suicide assessment and intervention. Counseling Outcome Research and Evaluation, 6(1), 58–69. https://doi.org/10.1177/2150137814567471
Finlayson, M., & Graetz Simmonds, J. (2018). Impact of client suicide on psychologists in Australia. Australian Psychologist, 53(1), 23–32. https://doi.org/10.1111/ap.12240
Gallo, L. L. (2018). The relationship between high school counselors’ self-efficacy and conducting suicide risk assessments. Journal of Child and Adolescent Counseling, 4(3), 209–225. https://doi.org/10.1080/23727810.2017.1422646
Gallo, L. L., Rausch, M. A., Beck, M. J., & Porchia, S. (2021). Elementary school counselors’ experiences with suicidal students, Journal of Child and Adolescent Counseling, 7(1), 26–41. https://doi.org/10.1080/23727810.2020.1835419
Gilbride, D. D., Goodrich, K. M., & Luke, M. (2016). The professional peer membership of school counselors and the resources used within their decision-making. The Journal of Counselor Preparation and Supervision, 8(2). https://repository.wcsu.edu/jcps/vol8/iss2/4
Goreczny, A. J., Hamilton, D., Lubinski, L., & Pasquinelli, M. (2015). Exploration of counselor self-efficacy across academic training. The Clinical Supervisor, 34(1), 78–97. https://doi.org/10.1080/07325223.2015.1012916
Greenberg, D., & Shefler, G. (2014). Patient suicide. Israel Journal of Psychiatry & Related Sciences, 51(3), 193–198.
Ivey-Stephenson, A. Z., Demissie, Z., Crosby, A. E., Stone, D. M., Gaylor, E., Wilkins, N., Lowry, R., & Brown, M. (2019). Suicidal ideation and behaviors among high school students — Youth Risk Behavior Survey, United States, 2019. Morbidity and Mortality Weekly Report, Supplement 69(1), 47–55. https://doi.org/10.15585/mmwr.su6901a6
Kozina, K., Grabovari, N., De Stefano, J., & Drapeau, M. (2010). Measuring changes in counselor self-efficacy: Further validation and implications for training and supervision. The Clinical Supervisor, 29(2), 117–127. https://doi.org/10.1080/07325223.2010.517483
Larson, L. M., Suzuki, L. A., Gillespie, K. N., Potenza, M. T., Bechtel, M. A., & Toulouse, A. L. (1992). Development and validation of the Counseling Self-Estimate Inventory. Journal of Counseling Psychology, 39(1), 105–120. https://doi.org/10.1037/0022-0167.39.1.105
Lent, R. W., Hill, C. E., & Hoffman, M. A. (2003). Development and validation of the Counselor Activity Self-Efficacy Scales. Journal of Counseling Psychology, 50(1), 97–108. https://doi.org/10.1037/0022-0167.50.1.97
Maples, M. F., Packman, J., Abney, P., Daugherty, R. F., Casey, J. A., & Pirtle, L. (2005). Suicide by teenagers in middle school: A postvention team approach. Journal of Counseling & Development, 83(4), 397–405. https://doi.org/10.1002/j.1556-6678.2005.tb00361.x
McAdams, C. R., III., & Foster, V. A. (2002). An assessment of resources for counselor coping and recovery in the aftermath of client suicide. Journal of Humanistic Counseling, Education and Development, 41(2), 232–242.
McCarthy, J. M., Trougakos, J. P., & Cheng, B. H. (2016). Are anxious workers less productive workers? It depends on the quality of social exchange. Journal of Applied Psychology, 101(2), 279–291. https://doi.org/10.1037/apl0000044
Mirick, R. G., Bridger, J., McCauley, J., & Berkowitz, L. (2016). Continuing education on suicide assessment and crisis intervention for social workers and other mental health professionals: A follow-up study. Journal of Teaching in Social Work, 36(4), 363–379. https://doi.org/10.1080/08841233.2016.1200171
National Institute of Mental Health. (2019). Mental health information: Statistics: Suicide. https://www.nimh.nih.gov/health/statistics/suicide.shtml
Perera-Diltz, D. M., & Mason, K. L. (2012). A national survey of school counselor supervision practices: Administrative, clinical, peer, and technology mediated supervision. Journal of School Counseling, 10, 1–34. https://files.eric.ed.gov/fulltext/EJ978860.pdf
Substance Abuse and Mental Health Services Administration. (2016). Preventing suicide: A toolkit for high school. Center for Mental Health Services, Substance Abuse and Mental Health Services Administration. https://store.samhsa.gov/product/Preventing-Suicide-A-Toolkit-for-High-Schools/SMA12-4669
Schmidt, R. C. (2016). Mental health practitioners’ perceived levels of preparedness, levels of confidence and methods used in the assessment of youth suicide risk. The Professional Counselor, 6(1), 76–88. https://doi.org/10.15241/rs.6.1.76
Sherba, R. T., Linley, J. V., Coxe, K. A., & Gersper, B. E. (2019). Impact of client suicide on social workers and counselors. Social Work in Mental Health, 17(3), 279–301. https://doi.org/10.1080/15332985.2018.1550028
Solomonson, L. L., & Killam, W. (2013). A national study on crisis intervention: Are school counselors prepared to respond? Ideas and Research You Can Use: VISTAS 2013. https://www.counseling.org/docs/default-source/vistas/a-national-study-on-crisis-intervention.pdf?sfvrsn=b3b9af05_11
Springer, S., Paone, C. H., Colucci, J., & Moss, L. J. (2020). Addressing suicidality: Examining preservice school counselors’ perceptions of their training experiences. Journal of Child and Adolescent Counseling, 6(1), 18–36. https://doi.org/10.1080/23727810.2018.1556990
Stickl Haugen, J., Waalkes, P. L., & Lambie, G. W. (2021). A national survey of school counselors’ experiences with student death by suicide. Professional School Counseling, 25(1), 1–11. https://doi.org/10.1177/2156759X21993804
Tang, A. (2019). The impact of school counseling supervision on practicing school counselors’ self-efficacy in building a comprehensive school counseling program. Professional School Counseling, 23(1), 1–11. https://doi.org/10.1177/2156759X20947723
Thomyangkoon, P., & Leenars, A., (2008). Impact of death by suicide of patients on Thai psychiatrists. Suicide & Life-Threatening Behavior, 38(6), 728–740. https://doi.org/3994/10.1521/suli.2008.38.6.728
Wachter, C. A. (2006). Crisis in the schools: Crisis, crisis intervention training, and school counselor burnout (Publication No. 3221458). [Doctoral dissertation, University of North Carolina at Greensboro]. ProQuest Dissertations Publishing.
Wachter Morris, C. A., & Barrio Minton, C. A. (2012). Crisis in the curriculum? New counselors’ crisis preparation, experiences, and self-efficacy. Counselor Education and Supervision, 51(4), 256–269. https://doi.org/10.1002/j.1556-6978.2012.00019.x
Wagner, N. J., Grunhaus, C. M. L., & Tuazon, V. E. (2020). Agency responses to counselor survivors of client suicide. The Professional Counselor, 10(2), 251–265. https://doi.org/10.15241/njw.10.2.251
Alexander T. Becnel, PhD, NCC, LPC, is a doctoral candidate at the University of Holy Cross. Lillian Range, PhD, is a professor at the University of Holy Cross. Theodore P. Remley, Jr., JD, PhD, NCC, is a professor at the University of Holy Cross. Correspondence may be addressed to Alexander T. Becnel, 4123 Woodland Drive, New Orleans, LA 70131, abecnel2@uhcno.edu.
Aug 20, 2021 | Volume 11 - Issue 3
Eric G. Suddeath, Eric R. Baltrinic, Heather J. Fye, Ksenia Zhbanova, Suzanne M. Dugger,
Sumedha Therthani
This study examined differences in 149 counselor education doctoral students’ self-efficacy toward teaching related to their number of experiences with fieldwork in teaching (FiT). Results showed counselor education doctoral students began FiT experiences with high levels of self-efficacy, which decreased after one to two FiT experiences, increased slightly after three to four FiT experiences, and increased significantly after five or more FiT experiences. We discuss implications for how counselor education doctoral programs can implement and supervise FiT experiences as part of their teaching preparation practices. Finally, we identify limitations of the study and offer future research suggestions for investigating FiT experiences in counselor education.
Keywords: teaching preparation, self-efficacy, fieldwork in teaching, counselor education, doctoral students
Counselor education doctoral students (CEDS) need to engage in actual teaching experiences as part of their teaching preparation (Baltrinic et al., 2016; Baltrinic & Suddeath, 2020a; Barrio Minton, 2020; Swank & Houseknecht, 2019), yet inconsistencies remain in defining what constitutes actual teaching experience. Fortunately, several researchers (e.g., Association for Counselor Education and Supervision [ACES], 2016; Hunt & Weber Gilmore, 2011; Suddeath et al., 2020) have identified examples of teaching experiences, which we aggregated and defined as fieldwork in teaching (FiT). FiT includes the (a) presence of experiential training components such as co-teaching, formal teaching practicums and/or internships, and teaching assistantships (ACES, 2016); (b) variance in amount of responsibility granted to CEDS (Baltrinic et al., 2016; Barrio Minton & Price, 2015; Orr et al., 2008; Suddeath et al., 2020); and (c) use of regular supervision of teaching (Baltrinic & Suddeath, 2020a; Suddeath et al., 2020). Findings from several studies suggested that a lack of FiT experience can thwart CEDS’ teaching competency development (Swank & Houseknecht, 2019), contribute to CEDS’ feelings of insufficient preparation for future teaching roles (Davis et al., 2006), create unnecessary feelings of stress and burnout for first-year faculty (Magnuson et al., 2004), and lead to feelings of inadequacy among new counselor educators (Waalkes et al., 2018). Counselor education (CE) researchers reference FiT experiences (Suddeath et al., 2020) among a variety of teaching preparation practices, such as co-teaching (Baltrinic et al., 2016), supervision of teaching (Baltrinic & Suddeath, 2020a), collaborative teaching teams (CTT; Orr et al., 2008), teaching practicums (Baltrinic & Suddeath, 2020a; Hall & Hulse, 2010), teaching internships (Hunt & Weber Gilmore, 2011), teaching to peers within teaching instruction courses (Baltrinic & Suddeath, 2020b; Elliot et al., 2019), and instructor of record (IOR) experiences (Moore, 2019).
Participants across studies emphasized the importance of including FiT experiences within teaching preparation practices. Both CEDS and new faculty members reported that engaging in actual teaching (e.g., FiT) as part of their teaching preparation buffered against lower teaching self-efficacy (Baltrinic & Suddeath, 2020a; Elliot et al., 2019; Suddeath et al., 2020). These findings are important because high levels of teaching self-efficacy are associated with increased student engagement (Gibson & Dembo, 1984), positive learning outcomes (Goddard et al., 2000), greater job satisfaction, reduced stress and emotional exhaustion, longevity in the profession (Klassen & Chiu, 2010; Skaalvik & Skaalvik, 2014), and flexibility and persistence during perceived setbacks in the classroom (Elliot et al., 2019; Gibson & Dembo, 1984).
FiT Within Counselor Education
Existing CE teaching literature supports the presence and use of FiT within a larger framework of teaching preparation. Despite existing findings, variability exists in how FiT is both conceptualized and implemented among doctoral programs and in how doctoral students specifically engage in FiT during their program training. Current literature supporting FiT suggests several themes, which are outlined below, to support our gap in understanding of (a) whether FiT experiences are required, (b) the number of FiT experiences in which CEDS participate, (c) the level and type of student responsibility, and (d) the supervision and mentoring practices that support student autonomy within FiT experiences (e.g., Baltrinic et al., 2016, 2018; Orr et al., 2008; Suddeath et al., 2020).
Teaching Internships and Fieldwork
Teaching internships are curricular teaching experiences in which CEDS co-teach (most often) a master’s-level course with a program faculty member or with peers while receiving regular supervision (Hunt & Weber Gilmore, 2011). These experiences are offered concurrently with pedagogy or adult learning courses (Hunt & Weber Gilmore, 2011) or after taking a course (Waalkes et al., 2018). Teaching internships typically include group supervision (Baltrinic & Suddeath, 2020a), though the frequency and structure of supervision varies greatly (Suddeath et al., 2020). Participants in Baltrinic and Suddeath’s (2020a) study reported that teaching practicum and internship experiences are often included alongside multiple types of internships (e.g., clinical, supervision, and research), which led to less time to process their own teaching experiences. The level of responsibility within FiT experiences also varies. Specifically, CEDS may take on minor roles, including “observing faculty members’ teaching and . . . contributing anecdotes from their counseling experiences to class discussion” (Baltrinic et al., 2016, p. 38), providing the occasional lecture or facilitating a class discussion, or engaging in administrative duties such as grading and making copies of course materials (Hall & Hulse, 2010; Orr et al., 2008). Research also suggests that CEDS may share the responsibility for designing, delivering, and evaluating the course (Baltrinic et al., 2016). Finally, CEDS may take on sole/primary responsibility, including the design and delivery of all aspects of a course (Orr et al., 2008).
Co-Teaching and CTT
It is important to distinguish formal curricular FiT experiences such as teaching practicums and internships from informal co-curricular co-teaching experiences. For example, Baltrinic et al. (2016) identified co-teaching as a process of pairing experienced faculty members with CEDS for the purpose of increasing their knowledge and skill in teaching through supervised teaching experiences. CEDS often receive more individual supervision and mentoring in these informal experiences based on individual agreements between the CEDS and willing faculty members (Baltrinic & Suddeath, 2020a). One example of a formal co-teaching experience (i.e., CTT) comes from Orr et al. (2008). In this model, CEDS initially observe a course or courses while occasionally presenting on course topics. The CEDS then take the lead for designing and delivering the course while under the direct supervision (both live in the classroom and post-instruction) of counseling faculty members.
Instructor of Record
At times, CEDS have the opportunity to teach a course as the sole instructor, what Moore (2019) and Orr et al. (2008) defined as an instructor of record (IOR). In these cases, IORs are fully responsible for the delivery and evaluation components of the course, including determining students’ final grades. CEDS may take on IOR roles after completing a progression of teaching responsibilities over time under supervision (Moore, 2019; Orr et al., 2008). In some instances, CEDS who serve as IORs are hired as adjunct or part-time instructors (Hebbani & Hendrix, 2014). Ultimately, it seems like a respectable outcome of teaching preparation in general, and specifically FiT, to prepare CEDS to transition into IOR roles. CEDS who attain the responsibility of IOR for one class are partially prepared for managing a larger teaching workload as a faculty member (i.e., teaching three classes per semester; 3:3 load).
Impact of Teaching Fieldwork
Overall, researchers identified FiT experiences as essential for strengthening CEDS’ feelings of preparedness to teach (Hall & Hulse, 2010), for fostering their teaching identities (Limberg et al., 2013; Waalkes et al., 2018), and for supporting their perceived confidence and competence to teach (Baltrinic et al., 2016; Orr et al., 2008). CE research suggests several factors that contribute to the relative success of the FiT experience. For example, Hall and Hulse (2010) found fieldwork most helpful when the experiences mimicked the actual roles and responsibilities of a counselor educator rather than guest lecturing or providing the occasional lecture. Participants in Hunt and Weber Gilmore’s (2011) study echoed this sentiment, emphasizing the importance of experiences related to the design, delivery, and evaluation of a course. Important experiences included developing or co-developing course curriculum and materials (e.g., exams, syllabi, grading rubrics), facilitating class discussions, lecturing, and evaluating student learning. Additionally, these experiences helped CEDS to translate adult learning theories and pedagogy into teaching practice, which is an essential process for strengthening CEDS’ teaching identity (Hunt & Weber Gilmore, 2011; Waalkes et al., 2018). CE literature also points to the importance of providing CEDS with multiple supervised, developmentally structured (Orr et al., 2008) FiT experiences to increase levels of autonomy and responsibility with teaching and related duties (Baltrinic et al., 2016; Baltrinic & Suddeath, 2020a; Orr et al., 2008). Hall and Hulse found that teaching a course from start to finish contributed most to CEDS’ perceived preparedness to teach. The CTT approach (Orr et al., 2008) is one example of how CE programs developmentally structure FiT experiences.
Research affirms the integration of supervision across CEDS’ FiT experiences (e.g., Baltrinic & Suddeath, 2020a; Elliot et al., 2019; Hunt & Weber Gilmore, 2011). CEDS receive the essential support, feedback, and oversight during supervision that helps them make sense of teaching experiences and identify gaps in teaching knowledge and skills (Waalkes et al., 2018). Research suggests that structured, weekly supervision is most helpful in strengthening CEDS’ perceived confidence (Suddeath et al., 2020) and competence in teaching (Orr et al., 2008). Baltrinic and Suddeath (2020a) and Elliot et al. (2019) also identified supervision of FiT as an essential experience for buffering against CEDS’ fear and anxiety associated with initial teaching experiences. Both studies found that supervision led to fewer feelings of discouragement and perceived failures related to teaching, as well as increased confidence in their capabilities, even when teaching unfamiliar material. Elliot et al. attributed this to supervisors normalizing CEDS’ teaching experiences as a part of the developmental process, which helped them to push through the initial discomfort and fear in teaching and reframe it as an opportunity for growth.
Self-Efficacy Toward Teaching
Broadly defined, self-efficacy is the future-oriented “belief in one’s capabilities to organize and execute the courses of action required to produce given attainments” (Bandura, 1997, p. 3). Applied to teaching, it is confidence in one’s ability to select and utilize appropriate teaching behaviors effectively to accomplish a specific teaching task (Tschannen-Moran et al., 1998). Research in CE has outlined the importance of teaching self-efficacy on CEDS’ teaching development, including its relationship to a strengthened sense of identity as a counselor educator (Limberg et al., 2013); increased autonomy in the classroom (Baltrinic et al., 2016); greater flexibility in the application of learning theory; increased focus on the teaching experience and students’ learning needs instead of one’s own anxiety; and pushing through feelings of fear, self-doubt, and incompetence associated with initial teaching experiences (Elliot et al., 2019). Previous research affirms FiT as a significant predictor of teaching self-efficacy (Olguin, 2004; Suddeath et al., 2020; Tollerud, 1990). Recently, Suddeath et al. (2020) found that students participating in more FiT experiences also reported higher levels of teaching self-efficacy.
Purpose of the Present Study
In general, research supports the benefits of FiT experiences (e.g., increased self-efficacy, strengthened teaching identity, and a better supported transition to the professoriate) and ways in which FiT experiences (e.g., multiple, developmentally structured, supervised) should be provided as part of CE programs’ teaching preparation practices. Past and current research supports a general trend regarding the relationship between CE teaching preparation, including FiT experiences, and teaching self-efficacy (Suddeath et al., 2020). However, we know very little about how the number of FiT experiences, specifically, differentially impacts CEDS’ teaching self-efficacy. To address this gap, we examined the relationship between the number of CEDS’ FiT experiences and their reported self-efficacy in teaching. Accordingly, we proceeded in the present study guided by the following research question: How does CEDS’ self-efficacy toward teaching differ depending on amount of FiT experience gained (i.e., no experience in teaching, one to two experiences, three to four experiences, five or more experiences)? This research question was prompted by the work of Olguin (2004) and Tollerud (1990), who investigated CEDS’ reported differences in self-efficacy toward teaching across similarly grouped teaching experiences. We wanted to better understand the impact of FiT experiences on CEDS’ teaching self-efficacy given the prevalence of teaching preparation practices used in CE doctoral programs.
Method
Participant Characteristics
A total of 171 individuals responded to the survey. Participants who did not finish the survey or did not satisfy inclusionary criteria (i.e., 18 years or older and currently enrolled in a doctoral-level CACREP-accredited CE program) were excluded from the sample, leaving 149 usable surveys. Of these 149 participants, 117 (79%) were female and 32 (21%) were male. CEDS ranged in age from 23–59 years with a mean age of 34.73. Regarding race, 116 CEDS (73%) identified as White, 25 (17%) as Black, six (4%) as Asian, one (0.7%) as American Indian or Alaskan Native, and one (0.7%) as multiracial. Fifteen participants (10%) indicated a Hispanic/Latino ethnicity. Of the 149 participants, 108 provided their geographic region, with 59 (39%) reportedly living in the Southern United States, 32 (21%) in the Midwest, 10 (7%) in the West, and eight (5%) in the Northeast. Participants’ time enrolled in a CE program ranged from zero semesters (i.e., they were in their first semester) to 16 semesters (M = 6.20).
Sampling Procedures
After obtaining IRB approval, we recruited participants using two convenience sampling strategies. First, we sent counselor education and supervision doctoral program liaisons working in CACREP-accredited universities a pre-notification email (Creswell & Guetterman, 2019), which contained an explanation and rationale for this proposed study; a statement about informed consent and approval; a link to the composite survey, which included the demographic questionnaire; a question regarding FiT experiences; the Self-Efficacy Toward Teaching Inventory (SETI; Tollerud, 1990); and a request to forward the recruitment email (which was copied below the pre-notification text) to all eligible doctoral students. Next, we solicited CEDS’ participation through the Counselor Education and Supervision Network Listserv (CESNET-L), which is a professional listserv of counselors, counselor educators, and master’s- and doctoral-level CE students. We sent two follow-up participation requests, one through CESNET-L and the other to doctoral program liaisons (Creswell & Guetterman, 2019) to improve response rates. We further incentivized participation through offering participants a chance to win one of five $20 gift cards through an optional drawing.
Data Collection
We collected all research data through the survey software Qualtrics. CEDS who agreed to participate clicked the survey link at the bottom of the recruitment email, which took them to an informed consent information and agreement page. Participants meeting inclusionary criteria then completed the basic demographic questionnaire, a question regarding their FiT experiences, and the SETI.
Measures
We used a composite survey that included a demographic questionnaire, a question regarding FiT experiences, and a modified version of the SETI. To strengthen the content validity of the composite survey, we selected a panel of three nationally recognized experts known for their research on CEDS teaching preparation to provide feedback on the survey items’ “relevance, representativeness, specificity, and clarity” as well as “suggested additions, deletions, and modifications” of items (Haynes et al., 1995, pp. 244, 247). We incorporated feedback from these experts and then piloted the survey using seven recent graduates (i.e., within 4 years) from CACREP-accredited CE doctoral programs. Feedback from the pilot group influenced final modifications of the survey.
Demographic Questionnaire
The demographic questionnaire included questions regarding CEDS’ sex, age, race/ethnicity, geographic region, and time in program. Example items included: “Age in years?,” “What is your racial background?,” “Are you Hispanic or Latino?,” and “In which state do you live?”
Fieldwork Question
We used CE literature (e.g., ACES, 2016; Baltrinic et al., 2016; Orr et al., 2008) as a guide for defining and constructing the item to inquire about CEDS’ FiT experiences, which served as the independent variable in this study. In the survey, FiT was defined as teaching experiences within the context of formal teaching internships, informal co-teaching opportunities, graduate teaching assistantships, or independent teaching of graduate or undergraduate courses. Using this definition, participants then indicated “the total number of course sections they had taught or cotaught.” Following Tollerud (1990) and Olguin (2004), we also grouped participants’ FiT experiences into four groups (i.e., no experience, one to two experiences, three to four experiences, five or more experiences) to extend their findings.
Self-Efficacy Toward Teaching
To measure self-efficacy toward teaching, the dependent variable in this study, we used a modified version of the SETI. The original SETI is a 35-item self-report measure in which participants indicate their confidence to implement specific teaching skills and behaviors in five teaching domains within CE: course preparation, instructor behavior, materials, evaluation and examination, and clinical skills training. We modified the SETI according to the expert panel’s recommendations, which included creating 12 new items related to using technology in the classroom and teaching adult learners, as well as modifying the wording of several items to match CACREP 2016 teaching standards. This modified version of the SETI contained 47 items. Examples of new and modified items in each of the domains included: “Incorporate models of adult learning” (Course Preparation), “Attend to issues of social and cultural diversity” (Instructor Behavior), “Utilize technological resources to enhance learning” (Materials), “Construct multiple choice exams” (Evaluation and Examination), and “Provide supportive feedback for counseling skills” (Clinical Skills Training). The original SETI produced a Cronbach’s alpha of .94, suggesting strong internal consistency. Other researchers using the SETI reported similar findings regarding the internal consistency including Richardson and Miller (2011), who reported alphas of .96, and Prieto et al. (2007), who reported alphas of .94. The internal consistency for the modified SETI in this study produced a Cronbach’s alpha of .97, also suggesting strong internal consistency of items.
Design
This study used a cross-sectional survey design to investigate group differences in CEDS’ self-efficacy toward teaching by how many FiT experiences students had acquired (Creswell & Guetterman, 2019). Cross-sectional research allows researchers to better understand current beliefs, attitudes, or practices at a single point in time for a target population. This approach allowed us to gather information related to current FiT trends and teaching self-efficacy beliefs across CE doctoral programs.
Data Preparation and Analytic Strategy
After receiving the participant responses, we coded and entered them into SPSS (Version 27) for conducting all descriptive and inferential statistical analyses. Based upon previous research by Tollerud (1990) and Olguin (2004), we then grouped participants according to the number of experiences reported: no fieldwork experience, one to two experiences, three to four experiences, and five or more experiences. We then ran a one-way ANOVA to determine if CEDS’ self-efficacy significantly (p < .05) differed according to the number of teaching experiences accrued, followed by post hoc analyses to determine which groups differed significantly.
Results
We sought to determine whether CEDS with no experience in teaching, one to two experiences, three to four experiences, or five or more experiences differed in terms of their self-efficacy toward teaching scores. Overall, individuals in this study who reported no FiT experience indicated higher mean SETI scores (n = 10, M = 161.00, SD = 16.19) than those with one to two fieldwork experiences (n = 37, M = 145.59, SD = 21.41) and three to four fieldwork experiences (n = 32, M = 148.41, SD = 20.90). Once participants accumulated five or more fieldwork experiences (n = 70, M = 161.06, SD = 19.17), the mean SETI score rose above that of those with no, one to two, and three to four FiT experiences. The results also indicated an overall mean of 5.51 FiT experiences (SD = 4.63, range = 0–21).
As shown in Table 1, a one-way ANOVA revealed a statistically significant difference between the scores of the four FiT groups, F (3, 145) = 6.321, p < .001, and a medium large effect size (h2 = .12; Cohen, 1992). Levene’s test revealed no violation of homogeneity of variance (p = .763). A post hoc Tukey Honest Significant Difference test allowed for a more detailed understanding of which groups significantly differed. Findings revealed a statistically significant difference between the mean SETI scores for those with one to two fieldwork experiences and five or more experiences (mean difference = −15.46, p = .001) and for those with three to four and five or more experiences (mean difference = −12.65, p = .018). There was no significant difference between those with no FiT experience and those with five or more experiences, and in fact, these groups had nearly identical mean scores (i.e., 161.00 and 161.06, respectively). Although the drop is not significant, there is a mean difference of 15.40 from no FiT experience to one to two experiences. These results suggest that perceived confidence in teaching, as measured by the SETI, began high, dropped off after one to two experiences, slightly rose after three to four, and then increased significantly from 148.41 to 161.06 after five or more experiences, returning to pre-FiT levels.
Table 1
Means, Standard Deviations, and One-Way Analysis of Variance for Study Variables
| Measure |
No FiT |
1–2 FiT |
3–4 FiT |
5 or More FiT |
F (3, 145) |
h2 |
|
M |
SD |
M |
SD |
M |
SD |
M |
SD |
| SETI |
161.00 |
16.19 |
145.59 |
21.41 |
148.41 |
20.90 |
161.06 |
19.17 |
6.321* |
.12 |
Note. SETI = Self-Efficacy Toward Teaching Inventory; FiT = fieldwork in teaching.
*p < .001.
Discussion
The purpose of this study was to investigate whether CEDS with no experience in teaching, one to two experiences, three to four experiences, or five or more experiences differed in terms of their self-efficacy toward teaching scores. Overall, one-way ANOVA results revealed a significant difference in SETI scores by FiT experiences. Post hoc analyses revealed an initial substantial drop from no experience to one to two experiences and a significant increase in self-efficacy toward teaching between one to two FiT experiences and five or more experiences as well as between three to four FiT experiences and five or more experiences.
The CE literature supports the general trend observed in this study, that as the number of FiT experiences increases, so does CEDS’ teaching self-efficacy (e.g., Baltrinic & Suddeath 2020a; Hunt & Weber Gilmore, 2011; Suddeath et al., 2020). Many authors have articulated the importance of multiple fieldwork experiences for preparing CEDS to confidently transition to the professoriate (e.g., Hall & Hulse, 2010; Orr et al., 2008). Participants in a study by Hunt and Weber Gilmore (2011) identified engagement in multiple supervised teaching opportunities that mimicked the actual teaching responsibilities required of a counselor educator as particularly helpful. Tollerud (1990) and Olguin (2004) found that the more teaching experiences individuals acquired during their doctoral programs, the higher their self-efficacy toward teaching. Encouragingly, nearly half of CEDS in this study (47%) indicated that participating in five or more teaching experiences increased their teaching self-efficacy. This increase in teaching self-efficacy may be due to expanded use of teaching preparation practices within CE doctoral programs (ACES, 2016).
Participants in the current study reported an initial drop in self-efficacy after their initial FiT experiences, which warrants explanation. Specifically, the initial drop in CEDS’ self-efficacy could be due to discrepancies between their estimation of teaching ability and their actual capability, further supporting the idea of including actual FiT earlier in teaching preparation practices, albeit titrated in complexity. Though one might assume that as participants acquired additional teaching experience their SETI scores would have increased, the initial pattern from no experience to one to two FiT experiences did not support this. However, self-efficacy is not necessarily a measure of actual capability, but rather one’s confidence to engage in certain behaviors to achieve a certain task (Bandura, 1997). It is plausible that participants may have initially overestimated their own abilities and level of control over the new complex task of teaching, which may explain the initial drop in self-efficacy among participants. For participants lacking FiT experience, social comparison may have led them to “gauge their expected and actual performance by comparison with that of others” (Stone, 1994, p. 453)—in this case, with other CEDS with more FiT experiences.
Social comparisons used to generate appraisals of teaching self-efficacy beliefs may be taken from “previous educational experiences, tradition, [or] the opinion of experienced practitioners” (Groccia & Buskist, 2011, p. 5). Thus, participants in this study who lacked prior teaching experience may have initially overestimated their capability as a result of previous educational experiences. When individuals initially overestimate their abilities to perform a new task, they may not put in the time or effort needed to succeed at a given task. Tollerud (1990) suggested that those without any actual prior teaching experience may not realize the complexity of the task, the effort required, or what skills are needed to teach effectively. In the current study, this realization may be reflected in participants’ initial drop in mean SETI scores from no teaching experiences to one to two teaching experiences.
The CE literature offers clues for how to buffer against this initial drop in self-efficacy. For example, CE teaching preparation research suggests the importance of engaging in multiple teaching experiences (Suddeath et al., 2020) with a gradual increase in responsibility (Baltrinic et al., 2016) and frequent (i.e., weekly) supervision from CE faculty supervisors, as well as feedback and support from peers (Baltrinic & Suddeath, 2020a, 2020b; Elliot et al., 2019). These authors’ findings reportedly support students’ ability to normalize their initial anxiety, fears, and self-doubts; conceptualize their struggle and discomfort as a part of the developmental process; push through perceived failings; and reflect on and grow from initial teaching experiences. Elliot et al. (2019) noted specifically that supervision with peer support increased participants’ (a) ability to access an optimistic mindset amidst self-doubt, (b) self-efficacy in teaching, (c) authenticity in subsequent teaching experiences, and (d) facility with integrating theory into teaching practice. Overall, the current findings add to the CE literature by suggesting CE programs increase the number of FiT experiences (to at least five, preferably) for CEDS.
Our findings also reflect similarities in CEDS’ self-efficacy patterns to those of Tollerud (1990) and Olguin (2004). Similar to Tollerud and Olguin, we grouped participants according to the number of FiT experiences: no fieldwork experience, one to two experiences, three to four experiences, and five or more experiences. This study identified the same pattern in teaching self-efficacy as observed by Tollerud and Olguin, with those who reported no FiT experience indicating higher mean SETI scores than those with one to two FiT experiences and three to four FiT experiences. Although scores slightly increased from one to two FiT experiences to three to four FiT experiences, it was not until CEDS accumulated five or more FiT experiences that the mean SETI score rose above that of those with no FiT experiences. The consistency of this pattern over the span of 30 years seems to confirm the importance of providing CEDS several FiT opportunities (i.e., at least five) to strengthen their self-efficacy in teaching. Though responsibility within FiT experiences was aggregated in this study as it was in Tollerud and Olguin, research (e.g., Baltrinic et al., 2016; Orr et al., 2008) and common sense would suggest that CEDS need multiple supervised teaching opportunities with progressively greater responsibility and autonomy. However, future research is needed to examine how CEDS’ self-efficacy toward teaching changes over time as they move from having no actual teaching experience, to beginning their FiT, to accruing substantial experiences with FiT.
Implications
For many counselor educators, teaching and related responsibilities consume the greatest proportion of their time (Davis et al., 2006). As such, providing CEDS multiple supervised opportunities (Orr et al., 2008; Suddeath et al., 2020) to apply theory, knowledge, and skills in the classroom before they transition to the professoriate seems important for fostering teaching competency (Swank & Houseknecht, 2019) and, ideally, mitigating against feelings of stress and burnout that some first-year counselor educators experience as a result of poor teaching preparation (Magnuson et al., 2006). Given the initial drop in self-efficacy toward teaching as identified in this study and the relationship between higher levels of self-efficacy and increased student engagement (Gibson & Dembo, 1984) and learning outcomes (Goddard et al., 2000), greater job satisfaction, reduced stress and emotional exhaustion (Klassen & Chiu, 2010; Skaalvik & Skaalvik, 2014), and flexibility and persistence during perceived setbacks in the classroom (Elliot et al., 2019), several suggestions are offered.
Although it is an option in many CE doctoral programs, some CEDS may graduate without any significant FiT experiences (Barrio Minton & Price, 2015; Hunt & Weber Gilmore, 2011; Suddeath et al., 2020). Although not all CEDS want to go into the professoriate, for those interested in working in academia, it is our hope that programs will provide students with multiple—and preferably at least five—developmentally structured supervised teaching opportunities. Whether these are formal curricular FiT experiences such as teaching practicums and internships or informal co-curricular co-teaching or IOR experiences (and likely a combination of the two), CE literature suggests that these experiences should include frequent and ongoing supervision (Baltrinic & Suddeath, 2020a) and progress from lesser to greater responsibility and autonomy within the teaching role (Baltrinic et al., 2016; Hall & Hulse, 2010; Orr et al., 2008). These recommendations for the structuring of FiT are important given the incredible variation in this aspect of training (e.g., Orr et al., 2008; Suddeath et al., 2020) and the consistency in the observed pattern of self-efficacy toward teaching and the number of FiT experiences (Olguin, 2004; Tollerud, 1990).
To help buffer against the initial drop in self-efficacy toward teaching scores from zero to one to two teaching experiences in this study and previous research (Olguin, 2004; Tollerud, 1990), research emphasizes the importance of increased oversight and support of CEDS before and during their first teaching experiences (Baltrinic & Suddeath, 2020a; Elliot et al., 2019; Stone, 1994). CE faculty members who teach coursework in college teaching, are instructors for teaching internships, and/or are providing supervision of teaching for FiT experiences should normalize initial anxiety and self-doubt (Baltrinic & Suddeath, 2020a; Elliot et al., 2019) and encourage realistic expectations for students’ first teaching experiences (Stone, 1994). Stone (1994) suggested that fostering realistic expectations in those engaging in a new task may actually “increase effort, attention to strategy, and performance by increasing the perceived challenge of tasks” (p. 459). This was evident in Elliot et al.’s (2019) study in which CEDS reframed the initial struggles with teaching experiences as opportunities for growth and development. On the other hand, individuals who overestimate or strongly underestimate self-efficacy may not put in the time or effort needed to succeed at a given task. For example, those who overestimate their capabilities may not increase their effort, as they already believe they are going to perform well (Stone, 1994). Similarly, those who underestimate their ability may not increase effort or give sufficient attention to strategy, as they perceive that doing so would not improve their performance anyway. These findings support the need for CE programs to provide oversight and support and engender realistic expectations before or during students’ first FiT experiences.
Limitations and Future Research
Limitations existed related to the sample and survey. Representativeness of the sample, and thus generalizability of findings, is limited by the voluntary nature of the study (i.e., self-selection), cross-sectional design (i.e., tracking efficacy beliefs over time), and solicitation of participants via CESNET-L (i.e., potential for CEDS to miss the invitation to participate) and doctoral program liaisons (i.e., unclear how many forwarded the invitation). Another limitation relates to the variability in participants’ FiT experiences, such as the assigned role and responsibility within FiT, frequency and quality of supervision, and whether and how experiences were developmentally structured. Additionally, self-report measures were used, which are prone to issues of self-knowledge (e.g., over- or underestimation of capability with self-efficacy, accurate recall of FiT experiences) and social desirability.
Future research could utilize qualitative methods to investigate what components of FiT experiences (e.g., quality, type of responsibility) prove most helpful in strengthening CEDS’ self-efficacy and how it changes with increased experience. Given the limitations of self-efficacy, researchers could also investigate other outcomes (e.g., test scores, student evaluations) instead of or alongside self-efficacy. Although this study identified the importance of acquiring at least five FiT experiences for strengthening SETI scores, little is known about how to developmentally structure FiT experiences so as to best strengthen self-efficacy toward teaching. Researchers could use quantitative approaches to investigate the relationship between various aspects of CEDS’ FiT experiences (e.g., level of responsibility and role, frequency and quality of supervision) and SETI scores. Researchers could also develop a comprehensive model for providing FiT that includes recommendations as supported by CE research (e.g., Baltrinic et al., 2016; Baltrinic & Suddeath, 2020a, 2020b; Elliot et al., 2019; Orr et al., 2008; Suddeath et al., 2020; Swank & Houseknecht, 2019). Finally, instead of investigating FiT experiences of CEDS and their impact on teaching self-efficacy, future research could investigate first-year counselor educators to determine if and how their experience differs.
Conclusion
Investigating teaching preparation practices within CE doctoral programs is essential for understanding and improving training for future counselor educators. Although research already supports the inclusion of multiple supervised teaching experiences within CE doctoral programs (Suddeath et al., 2020), the results of this study provide greater clarity to the differential impact of FiT experiences on CEDS’ teaching self-efficacy. Given the consistently observed pattern of teaching self-efficacy and FiT experiences from this and other studies over the last 30 years, doctoral training programs should thoughtfully consider how to support students through their first FiT experiences, and ideally, offer students multiple opportunities to teach.
Conflict of Interest and Funding Disclosure
The authors reported no conflict of interest
or funding contributions for the development
of this manuscript.
References
Association for Counselor Education and Supervision. (2016). Best practices in teaching in counselor education report. https://acesonline.net/wp-content/uploads/2018/11/ACES-Teaching-Initiative-Taskforce-Final-Report-2016.pdf
Baltrinic, E. R., Jencius, M., & McGlothlin, J. (2016). Coteaching in counselor education: Preparing doctoral students for future teaching. Counselor Education and Supervision, 55(1), 31–45. https://doi.org/10.1002/ceas.12031
Baltrinic, E. R., Moate, R. M., Hinkle, M. G., Jencius, M., Taylor, J. Z. (2018). Counselor educators’ teaching mentorship styles: A Q methodology study. The Professional Counselor, 8(1), 46–59. https://doi.org/10.15241/erb.8.1.46
Baltrinic, E. R., & Suddeath, E. (2020a). Counselor education doctoral students’ lived experiences with supervision of teaching. Counselor Education and Supervision, 59(3), 231–248. https://doi.org/10.1002/ceas.12186
Baltrinic, E. R., & Suddeath, E. G. (2020b). A Q methodology study of a doctoral counselor education teaching instruction course. The Professional Counselor, 10(4), 472–487. https://doi.org/10.15241/erb.10.4.472
Bandura, A. (1997). Self-efficacy: The exercise of control. Freeman.
Barrio Minton, C. A. (2020). Signature pedagogies: Doctoral-level teaching preparation. Teaching and Supervision in Counseling, 2(2), 39–46. https://doi.org/10.7290/tsc020205
Barrio Minton, C. A., & Price, E. (2015, October). Teaching the teacher: An analysis of teaching preparation in counselor education doctoral programs. Presentation session presented at the meeting of the Association for Counselor Education and Supervision Biannual Conference, Philadelphia, PA.
Cohen, J. (1992). A power primer. Psychological Bulletin, 112(1), 155–159. https://doi.org/10.1037/0033-2909.112.1.155
Creswell, J. W., & Guetterman, T. C. (2019). Educational research: Planning, conducting, and evaluating quantitative and qualitative research (6th ed.). Pearson.
Davis, T. E., Levitt, D. H., McGlothlin, J. M., & Hill, N. R. (2006). Perceived expectations related to promotion and tenure: A national survey of CACREP program liaisons. Counselor Education and Supervision, 46(2), 146–156. https://doi.org/10.1002/j.1556-6978.2006.tb00019.x
Elliot, A., Salazar, B. M., Dennis, B. L., Bohecker, L., Nielson, T., LaMantia, K., & Kleist, D. M. (2019). Pedagogical perspectives on counselor education: An autoethnographic experience of doctoral student development. The Qualitative Report, 24(4), 648–666. https://doi.org/10.46743/2160-3715/2019.3714
Gibson, S., & Dembo, M. H. (1984). Teacher efficacy: A construct validation. Journal of Educational Psychology, 76(4), 569–582. https://doi.org/10.1037/0022-0663.76.4.569
Goddard, R. D., Hoy, W. K., & Hoy, A. W. (2000). Collective teacher efficacy: Its meaning, measure, and impact on student achievement. American Educational Research Journal, 37(2), 479–507. https://doi.org/10.2307/1163531
Groccia, J. E., & Buskist, W. (2011). Need for evidence-based teaching. New Directions for Teaching and Learning, 2011(128), 5–11. https://doi.org/10.1002/tl.463
Hall, S. F., & Hulse, D. (2010). Perceptions of doctoral level teaching preparation in counselor education. The Journal of Counselor Preparation and Supervision, 1(2), 2–15. https://core.ac.uk/download/pdf/234957931.pdf
Haynes, S. N., Richard, D. C. S., & Kubany, E. S. (1995). Content validity in psychological assessment: A functional approach to concepts and methods. Psychological Assessment, 7(3), 238–247.
https://doi.org/10.1037/1040-3590.7.3.238
Hebbani, A., & Hendrix, K. G. (2014). Capturing the experiences of international teaching assistants in the US American classroom. New Directions for Teaching and Learning, 2014(138), 61–72. https://doi.org/10.1002/tl.20097
Hunt, B., & Weber Gilmore, G. (2011). Learning to teach: Teaching internships in counselor education and supervision. The Professional Counselor, 1(2), 143–151. https://doi.org/10.15241/bhh.1.2.143
Klassen, R. M. & Chiu, M. M. (2010). Effects on teachers’ self-efficacy and job satisfaction: Teacher gender, years of experience, and job stress. Journal of Educational Psychology, 102(3), 741–756. https://doi.org/10.1037/a0019237
Limberg, D., Bell, H., Super, J. T., Jacobson, L., Fox, J., DePue, M. K., Christmas, C., Young, M. E., & Lambie, G. W. (2013). Professional identity development of counselor education doctoral students: A qualitative investigation. The Professional Counselor, 3(1), 40–53. https://doi.org/10.15241/dll.3.1.40
Magnuson, S., Black, L. L., & Lahman, M. K. E. (2006). The 2000 cohort of new assistant professors of counselor education: Year 3. Counselor Education and Supervision, 45(3), 162–179.
https://doi.org/10.1002/j.1556-6978.2006.tb00140.x
Magnuson, S., Shaw, H., Tubin, B., & Norem, K. (2004). Assistant professors of counselor education: First and second year experiences. Journal of Professional Counseling: Practice, Theory, and Research, 32(1), 3–18. https://doi.org/10.1080/15566382.2004.12033797
Moore, A. (2019). Counselor education and supervision doctoral students’ experiences as instructors of record teaching a master’s level counseling course: A descriptive phenomenological investigation [Doctoral dissertation, Kent State University]. OhioLINK. http://rave.ohiolink.edu/etdc/view?acc_num=kent1573225509664446
Olguin, D. L. C. (2004). Determinants of preparation through perceptions of counseling and teaching self-efficacy among prospective counselor educators [Doctoral dissertation, University of New Orleans]. ProQuest.
Orr, J. J., Hall, S. F., & Hulse-Killacky, D. (2008). A model for collaborative teaching teams in counselor education. Counselor Education and Supervision, 47(3), 146–163. https://doi.org/10.1002/j.1556-6978.2008.tb00046.x
Prieto, L. R., Yamokoski, C. A., & Meyers, S. A. (2007). Teaching assistant training and supervision: An examination of optimal delivery modes and skill emphases. Journal of Faculty Development, 21(1), 33–43.
Richardson, R., & Miller, D. (2011). Predicting the use of learner-centered instructional methods by undergraduate social work faculty. Journal of Baccalaureate Social Work, 16(2), 115–130.
https://doi.org/10.18084/basw.16.2.v17824840x8v130l
Skaalvik, E. M., & Skaalvik, S. (2014). Teacher self-efficacy and perceived autonomy: Relations with teacher engagement, job satisfaction, and emotional exhaustion. Psychological Reports, 114(1), 68–77. https://doi.org/10.2466/14.02.pr0.114k14w0
Stone, D. N. (1994). Overconfidence in initial self-efficacy judgments: Effects on decision processes and performance. Organizational Behavior and Human Decision Processes, 59(3), 452–474.
https://doi.org/10.1006/obhd.1994.1069
Suddeath, E. G., Baltrinic, E., & Dugger, S. (2020). The impact of teaching preparation practices on self-efficacy toward teaching. Counselor Education and Supervision, 59(1), 59–73. https://doi.org/10.1002/ceas.12166
Swank, J. M., & Houseknecht, A. (2019). Teaching competencies in counselor education: A Delphi study. Counselor Education and Supervision, 58(3), 162–176. https://doi.org/10.1002/ceas.12148
Tollerud, T. R. (1990). The perceived self-efficacy of teaching skills of advanced doctoral students and graduates from counselor education programs [Doctoral dissertation, University of Iowa]. ProQuest.
Tschannen-Moran, M., Hoy, A. W., & Hoy, W. K. (1998). Teacher efficacy: Its meaning and measure. Review of Educational Research, 68(2), 202–248. https://doi.org/10.3102/00346543068002202
Waalkes, P. L., Benshoff, J. M., Stickl, J., Swindle, P. J., & Umstead, L. K. (2018). Structure, impact, and deficiencies of beginning counselor educators’ doctoral teaching preparation. Counselor Education and Supervision, 57(1), 66–80. https://doi.org/10.1002/ceas.12094
Eric G. Suddeath, PhD, LPC-S (MS), is an associate professor at Denver Seminary. Eric R. Baltrinic, PhD, LPCC-S (OH), is an assistant professor at the University of Alabama. Heather J. Fye, PhD, NCC, LPC (OH), is an assistant professor at the University of Alabama. Ksenia Zhbanova, EdD, is an assistant professor at Mississippi State University-Meridian. Suzanne M. Dugger, EdD, NCC, ACS, LPC (MI), SC (MI, FL), is a professor and department chair at Florida Gulf Coast University. Sumedha Therthani, PhD, NCC, is an assistant professor at Mississippi State University. Correspondence may be addressed to Eric G. Suddeath, 6399 South Santa Fe Drive, Littleton, CO 80120, ericsuddeath@gmail.com.